

China Wheat Imports & Grain Stockpiling: Market Impact
Reviewed September 2026 against USDA World Agricultural Supply and Demand Estimates (WASDE) and China’s National Bureau of Statistics.
Try it: Run your own numbers →
“China’s wheat import delays affect up to 600,000 metric tons of shipments, primarily from Australia.”
“As the world’s largest wheat importer, China’s reduced activity impacts Southeast Asian grain imports and global prices.”
China buys less wheat from abroad when its own harvest and state reserves are full, and that single decision moves global wheat markets more than any other country’s. Global wheat ending stocks are forecast at 262.8 million tonnes for 2025/26 — a 10-year low — against projected 2024/25 production of 798.2 million tonnes, per USDA’s WASDE report. When the world’s largest buyer pulls back even briefly, exporters in Australia, Canada and the United States feel it first, and the effects move outward from there.
Table of Contents
- Why China Delays Wheat Imports
- China’s Grain Stockpiling Strategy
- The Global Wheat Market Squeeze
- China’s Agricultural Drone Boom
- China Grain Import Trends by Sourcing Country
- Wheat Shipment Exposure Calculator
- How to Track the Next Shift Yourself
- FAQ
- Try it: Run your own numbers

Why China Delays Wheat Imports
China’s pullback from wheat purchases is not a one-off event — it is a recurring pattern tied to its domestic harvest cycle and state reserve levels. When Chinese state enterprises reported grain purchases from farmers of 420 million tonnes in 2024 (China National Bureau of Statistics), that scale of domestic procurement is exactly why import appetite softens in years when the harvest comes in strong. The mechanics behind a pullback typically follow the same sequence:
- Abundant Domestic Supplies: A strong corn and wheat harvest fills state and private inventories, reducing the urgency to buy overseas.
- Declining Local Prices: Heavy domestic procurement pushes local wheat prices down, making imported grain comparatively less attractive.
- Reduced Demand for Imports: With state reserves well stocked, buyers cancel or defer confirmed shipments rather than take delivery.
- Strategic Pause: Import timing shifts to later in the marketing year, giving the domestic market room to clear existing stock before new cargoes land.
Cargo-level cancellation and resale volumes (such as the widely reported 600,000-metric-ton Australian shipment delay and the roughly 240,000-metric-ton resale into Southeast Asia) are trade-press figures tied to specific 2024 cargoes rather than USDA-published series, so treat them as historical context for that episode rather than a number to extrapolate forward. For the current official supply-and-demand picture, USDA’s WASDE report is the authoritative, regularly updated source — see the refresh path below.
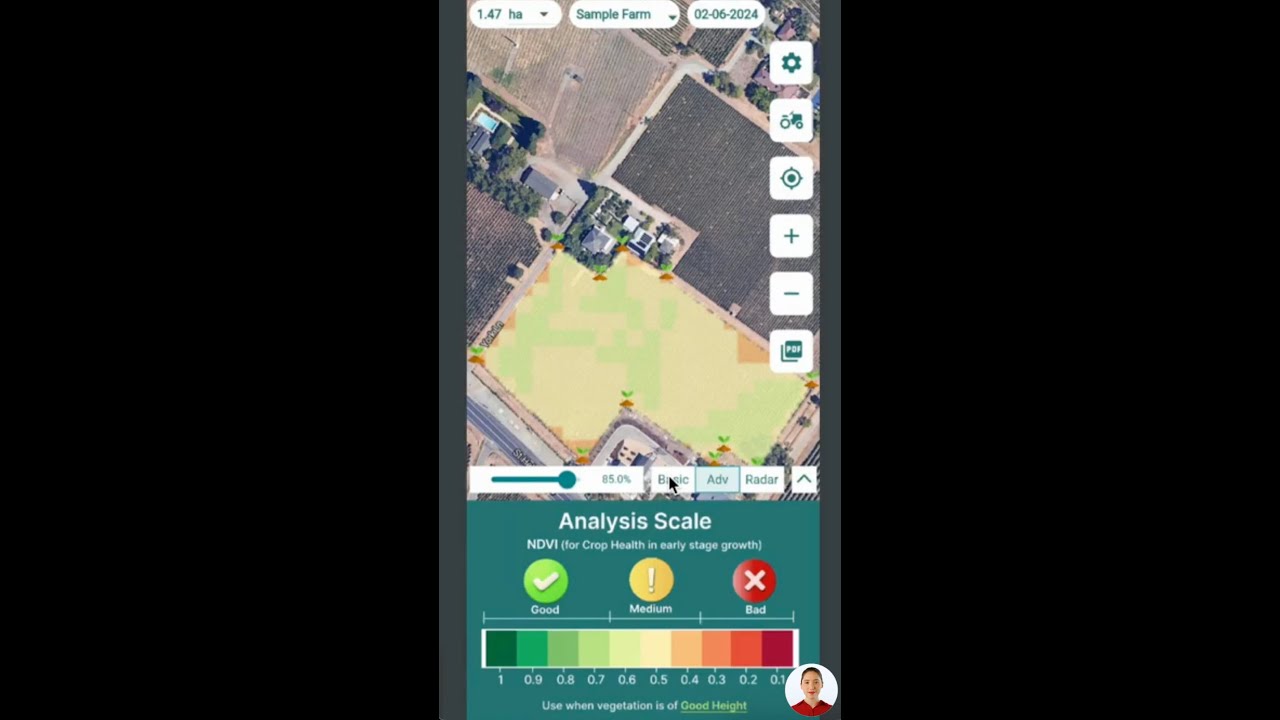
At Farmonaut, our satellite-based crop monitoring API tracks crop health signals across major growing regions in near real time, which is one of the few independent ways to anticipate a harvest-driven import pullback before it shows up in trade data.
China’s Grain Stockpiling Strategy
China’s stockpiling isn’t just a buffer against bad harvests — it is deliberate policy tied to food-security goals. State enterprises purchased 420 million tonnes of grain from farmers in 2024, according to China’s National Bureau of Statistics, a figure that captures the scale at which the state grain system is designed to operate independent of import markets.
- Protecting Local Farmers: Reducing imports supports domestic wheat prices during years of surplus.
- Reorienting Import Purpose: Purchases increasingly target milling-quality wheat for flour rather than feed-grade grain, since domestic corn covers feed demand.
- Enhancing Domestic Stockpiling: China’s state stockpiler, Sinograin, has expanded storage capacity in Northeast China to handle record corn procurement.
- Balancing Reserves Against Oversupply: The policy goal is enough reserve to guarantee food security without so much surplus that it collapses farm-gate prices.

For a full breakdown of how state reserve purchases are reported, see China’s official statistics release: China National Bureau of Statistics. Farmonaut’s AI-powered advisory system, Jeevn AI, translates crop-health and yield-outlook data into the kind of early signal that state buyers and private traders both watch for.

The Global Wheat Market Squeeze
The global wheat market is entering 2025/26 with ending stocks forecast at 262.8 million tonnes — the lowest in a decade — even as 2024/25 production came in at 798.2 million tonnes, per USDA’s WASDE. That combination — solid production but shrinking carryover — means the buffer against a bad harvest anywhere in the Northern Hemisphere is thinner than it has been in ten years. It also means China’s import decisions land on a market with less slack to absorb a swing in demand either direction.
This is the mechanism behind the “grain imports” and “global wheat market” search terms bringing readers here: buyers, traders and policy analysts want to know how much stock cushion actually exists before they commit to a position. USDA’s WASDE figures are the reference point institutional traders use for exactly this question.
Redirected cargoes are the clearest evidence of this dynamic in practice: when China defers shipments, exporters resell into Southeast Asia rather than let vessels sit idle, and buyers in Thailand and neighboring markets gain temporary negotiating leverage from the surplus. Farmonaut’s satellite and weather data API gives grain traders in Southeast Asia and elsewhere the field-level data needed to time purchases against these redirected flows rather than reacting after prices have already moved.
Comparative Snapshot: How Wheat Import Behavior Differs by Buyer
| Buyer / Region | Role in Global Wheat Trade | Primary Driver of Import Volume | Where to Verify Current Figures |
|---|---|---|---|
| China | World’s largest wheat importer by volume in most recent USDA marketing years | Domestic harvest size and state reserve levels | USDA WASDE monthly release |
| United States (exporter) | Top-tier global wheat exporter | Export competitiveness vs. Black Sea and EU supply | USDA Foreign Agricultural Service (FAS) export sales reports |
| European Union (exporter/importer) | Major producer with variable net trade position | Weather-driven yield swings across member states | Eurostat and EU Commission short-term outlook |
| Southeast Asia (importer bloc) | Secondary buyer, absorbs redirected cargoes | Price competitiveness of diverted shipments | USDA FAS Grain: World Markets and Trade |
This table is deliberately built around where to verify rather than a single point-in-time number, because trade volumes shift monthly with each WASDE release. The structural takeaway — China’s decisions carry outsized weight because of its import share, not because its behavior is unusual — holds regardless of which month’s figures you check.
China’s Agricultural Drone Boom
Separate from import policy, China’s domestic drone-based farming has scaled to a level that is reshaping how the country manages the crop yields underpinning its self-sufficiency push. Agricultural drone application coverage in China reached 173 million hectares in 2024, according to Global Agriculture Industry Reports — a figure that reflects sprayed and monitored cropland, not total farmland. Within that market, DJI held a 54.82% share of China’s agricultural drone market in 2024, per Market Research Future.
- Scale of Adoption: 173 million hectares of drone-covered farmland in 2024 signals drone spraying and monitoring is now mainstream on Chinese farms, not a pilot technology.
- Market Concentration: DJI’s 54.82% share in 2024 means a majority of China’s agricultural drone fleet runs on a single manufacturer’s platform, which matters for parts availability and service networks.
- Link to Grain Strategy: Higher-precision input application supports the yield consistency China needs to keep leaning on domestic harvests rather than imports.
Two figures the research for this piece could not confirm from a published source: per-hectare drone operating cost and season-over-season ROI for individual Chinese farms. If you need those numbers for a specific operation, the closest available proxies are equipment-lease rates published by regional agricultural machinery cooperatives and China’s Ministry of Agriculture and Rural Affairs mechanization statistics releases — neither of which was part of the verified brief for this article, so we’re flagging the gap rather than guessing at a number.
Farmonaut’s own satellite-based monitoring plays a comparable role for row-crop and orchard operations outside China: instead of a drone flyover, our imagery-based advisory pulls the same kind of field-health signal remotely. You can see the platform in action via our Android and iOS apps.

China Grain Import Trends by Sourcing Country
China’s wheat sourcing shifts between Australia, Canada and the United States depending on price, shipping cost and bilateral trade conditions in a given marketing year. The research brief for this article does not contain a verified country-by-country import share breakdown for the current marketing year — that data point is a known gap rather than something we’re estimating. The authoritative source for that breakdown is USDA’s Foreign Agricultural Service Grain: World Markets and Trade report, published monthly alongside WASDE, which lists China’s wheat imports by country of origin.
What is documented in this brief is the demand-side context: with 2025/26 global ending stocks forecast at a 10-year low of 262.8 million tonnes, any resumption of Chinese buying interest lands on a tighter global supply base than in prior years — which is one reason sourcing-country shifts (toward or away from Canada, Australia, or the US) tend to move price spreads between origins more sharply when overall stocks are already thin.
China’s domestic grain market dynamics — record harvests, storage capacity limits, and price stabilization efforts — are the upstream drivers of which sourcing country picks up or loses share in a given year. Government price-support policy generally aims to support local farmers without triggering a deeper import pullback than warranted by actual harvest surplus.
What Determines Which Exporter Wins Chinese Orders
- Freight cost: Black Sea and Australian origins typically have shorter sailing times to Chinese ports than US Gulf or Pacific Northwest origins.
- Protein and milling quality: Chinese millers specify protein content thresholds that vary by end use (bread flour vs. noodle flour), which favors different origins in different years.
- Bilateral trade terms: Phytosanitary agreements and tariff-rate quota allocations affect which origins clear customs fastest.
- Currency and hedging costs: Exchange-rate movements between the Chinese yuan and exporter currencies (Australian dollar, Canadian dollar, US dollar) shift landed cost comparisons month to month.
Wheat Shipment Exposure Calculator
If you trade, hedge, or plan logistics around wheat cargoes moving toward or away from China, the tool below estimates how a shipment volume change compares to the current global stocks-to-production ratio, using the USDA figures cited above as the baseline.
Run your own numbers
Assumptions: uses the USDA WASDE 2025/26 ending-stocks forecast (262.8 million tonnes) and 2024/25 production estimate (798.2 million tonnes) as defaults — replace them with the current month's WASDE figures for an up-to-date result. This tool does not account for quality grade, freight cost, or currency effects, and is for directional reference only, not a trading signal.
How to Track the Next Shift Yourself
Because China's import behavior and global stock levels change monthly, the durable value of this article is the method, not last year's numbers. Use this checklist to get a current read at any point:
- Check the latest WASDE release. USDA's World Agricultural Outlook Board publishes WASDE monthly with updated global wheat production, trade and ending-stocks projections at USDA WASDE; subscribe at esmis.nal.usda.gov for the monthly release.
- Cross-check China's state procurement data. China's National Bureau of Statistics periodically reports state grain purchase volumes; the 420-million-tonne 2024 figure cited above came from its official statistics portal.
- Watch USDA FAS Grain: World Markets and Trade for the country-by-country import breakdown WASDE's headline tables don't include.
- Monitor crop-health signals directly. Satellite-derived vegetation indices and yield-outlook tools — including Farmonaut's own — can flag a strong or weak harvest weeks before it shows up in official trade statistics.
- Track Chicago wheat futures as the fastest-moving proxy for how traders are pricing in a Chinese demand shift, keeping in mind futures react to sentiment before official data confirms it.
This sequence works the same whether China is buying heavily or pulling back — it's the repeatable method for reading the next move, not a one-time snapshot.
Conclusion
China's wheat-buying behavior and stockpiling policy will keep swinging with its own harvest cycle, and that swing will keep moving global wheat prices because of how much of world import volume China represents. The concrete numbers worth anchoring to right now: global wheat ending stocks forecast at 262.8 million tonnes for 2025/26 (a 10-year low), 2024/25 production at 798.2 million tonnes, China's 2024 state grain purchases at 420 million tonnes, and a domestic drone-farming sector covering 173 million hectares with DJI holding 54.82% share in 2024. Each of those will be updated on its own schedule — WASDE monthly, China's statistics bureau periodically, drone-market reports annually — so treat this article as a snapshot with a refresh path, not a final answer.
At Farmonaut, our satellite-based crop monitoring and AI-powered advisory systems are built for exactly this kind of tracking — turning field-level and regional crop-health signals into an early read on the harvests that drive these import decisions. Whether you're a trader hedging a cargo, a farmer planning around price volatility, or an analyst covering the grain trade, the tools below can help.
Explore Farmonaut's web application or download our Android and iOS apps to start tracking crop conditions and market signals directly.
FAQ Section
Q1: How significant is China's role in global wheat imports?
A1: China has been the world's largest wheat importer in recent USDA marketing years. Its purchasing decisions carry outsized weight because global wheat ending stocks are forecast at just 262.8 million tonnes for 2025/26 — a 10-year low, per USDA's WASDE report — leaving little buffer to absorb a shift in Chinese demand.
Q2: What causes China to slow its wheat imports?
A2: The recurring pattern is a strong domestic harvest combined with heavy state procurement — China's state enterprises purchased 420 million tonnes of grain from farmers in 2024 (China National Bureau of Statistics) — which fills reserves and reduces near-term need for imported wheat.
Q3: Where can I find the current global wheat stocks and production figures?
A3: USDA's WASDE report, published monthly by the World Agricultural Outlook Board, is the authoritative source. See the report at esmis.nal.usda.gov and subscribe for monthly updates.
Q4: How big is China's agricultural drone market?
A4: Agricultural drone application coverage reached 173 million hectares in China in 2024, with DJI holding a 54.82% market share that year, according to Global Agriculture Industry Reports and Market Research Future.
Q5: How does China balance domestic grain supply and international trade for food security?
A5: China leans on large state grain purchases from domestic farmers (420 million tonnes in 2024) and stockpiling infrastructure like Sinograin's storage facilities to reduce reliance on imports, then adjusts import volumes at the margin based on harvest size and reserve levels — importing more in weaker domestic years and pulling back when reserves are full.
Q6: What data sources should traders and analysts monitor for China grain import trends?
A6: USDA's WASDE (production and stocks), USDA FAS Grain: World Markets and Trade (country-by-country trade flows), and China's National Bureau of Statistics (domestic procurement) together give the clearest picture — see the tracking checklist above for how to use each one.
Earn With Farmonaut
Earn 20% recurring commission with Farmonaut's affiliate program by sharing your promo code and helping farmers save 10%. Onboard 10 Elite farmers monthly to earn a minimum of $148,000 annually—start now and grow your income!
Farmonaut Subscriptions
Stay ahead in the dynamic world of agriculture with Farmonaut's comprehensive solutions. Whether you're a farmer, trader, or policymaker, our tools provide the insights you need to make informed decisions in an ever-changing global market.



Discussion
Questions, corrections or field experience? Share them below. First-time comments are reviewed before they appear, and your email is never published.
No comments yet. Be the first to add a question or your experience.

 Inclusive Growth Chain
 AdBio
AdBio MISE Maroc
 Drift-Sense
 NWNS
NWNS Red August Group
 Farm Inc
 WeMe Global
 Agrotoken
 Blue BearX
 Insignito
 Croptimum
 DnCubed
 Field Capacity
 Indosistim Teknologi
 Liquify Digital
 CU Foods
 BeyondTech Global
 Licence holder · Niger · Gold
 Licence holder · Nigeria · Gold + lithium










