Athabasca Basin Uranium Exploration: 5 Powerful Geophysical Insights
“Over 20 airborne magnetic surveys were conducted in the Athabasca Basin in 2023, advancing uranium exploration precision.”
Introduction: Athabasca Basin Uranium Exploration and the Geophysical Revolution
The Athabasca Basin in Northern Saskatchewan, Canada, stands at the epicenter of global uranium exploration, holding approximately 20% of the world’s recoverable uranium reserves. Known for its high-grade deposits, with ore bodies often exceeding 20% U3O8 concentration, the region attracts leading mining companies aiming to discover and develop the next generation of uranium resources.
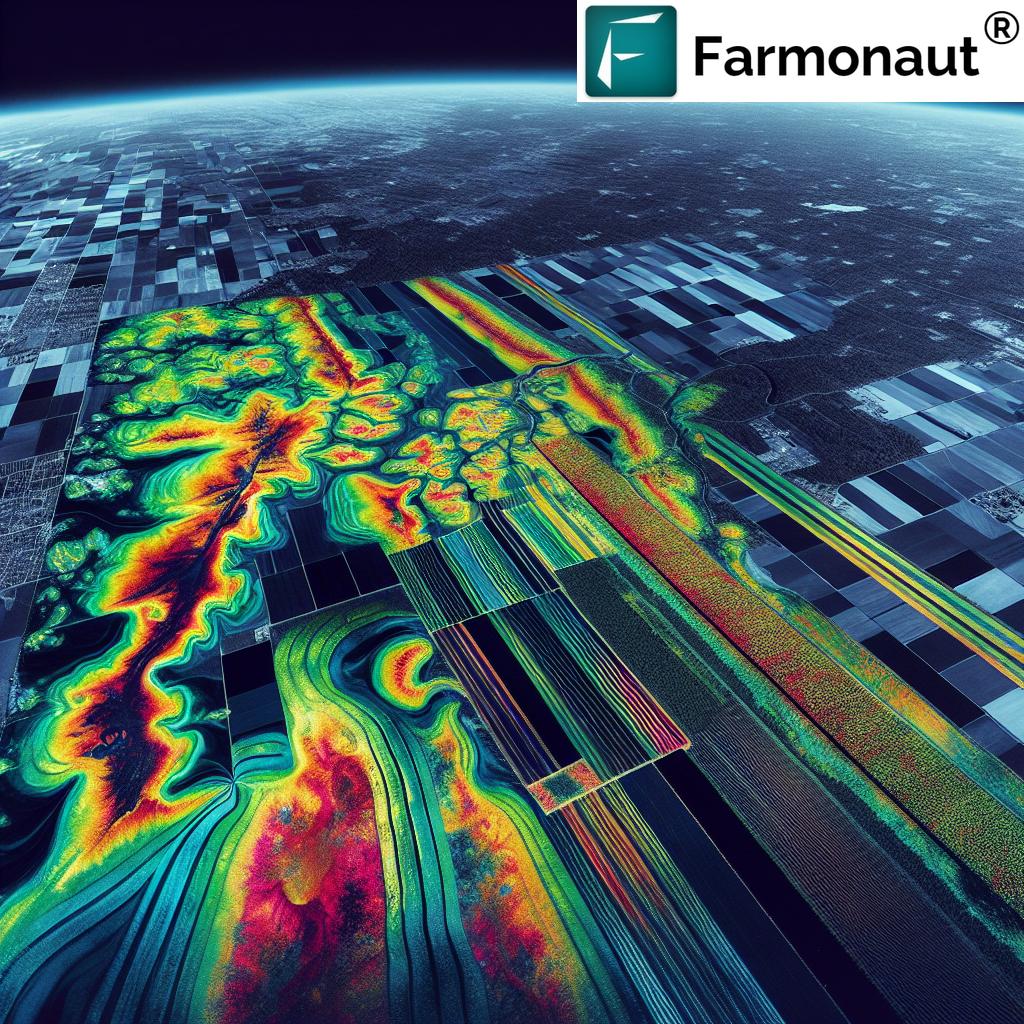
What sets modern uranium exploration in the Athabasca Basin apart is its reliance on advanced geophysical survey data integration and evolving airborne strategies. Magnetic, radiometric, gravity, and electromagnetic (EM) surveys—paired with digital synthesis of historical datasets and cutting-edge modelling—are redefining how we locate and characterize uranium targets, even at significant depths or beneath challenging surface cover.
In this definitive guide, we distill the 5 most powerful geophysical insights currently shaping exploration success stories across the Athabasca Basin. Our professional review draws on the latest results and methodologies from active projects—highlighting trends from integrated data interpretation, magnetic and radiometric targeting, EM anomaly analysis, radiometric enhancement, to intelligent mineral claim staking. The future of uranium exploration in Saskatchewan is being written now, and understanding these methods is key to participating in this new era of resource discovery.


Looking to integrate up-to-date satellite weather and geophysical data into your own platform or workflow? Explore Farmonaut’s high-performance Satellite Weather & Geophysical Survey Data API and comprehensive API Developer Documentation for seamless access and advanced custom solutions.
“Saskatchewan’s Athabasca Basin holds 20% of the world’s uranium, with geophysical data integration driving new discoveries.”
Comparative Overview Table: Geophysical Techniques in Athabasca Basin Uranium Exploration
To provide clarity on the multitude of survey methods powering present-day uranium exploration in Saskatchewan, we present a comparative table showcasing the principles, technical characteristics, and typical applications of each primary geophysical technique.
| Key Technique | Principle | Est. Survey Coverage (km²) | Est. Depth Penetration (m) | Resolution | Key Advantages | Limitations | Typical Usage in Uranium Exploration |
|---|---|---|---|---|---|---|---|
| Airborne Magnetic Survey | Measures subtle variations in Earth’s magnetic field caused by different rock types. | 10,000+ | up to 1,000m | High (<50m line spacing achievable) | Maps basement architecture; identifies magnetic lows associated with potential mineralization zones. | Non-unique; requires interpretation alongside geology. | Inferring unconformity depth/structure; delineating targets for uranium and critical minerals. |
| Radiometric Survey | Detects gamma radiation from surface rocks/soils, quantifying K, Th, U content. | 5,000–20,000 | Surface to ~30m | Moderate (pixel size ~30–100m) | Rapid coverage of large areas; highlights radiogenic anomalies even under shallow cover. | Attenuated by overburden; may miss deep-seated targets. | Direct uranium prospecting; anomaly enhancement for drill targeting. |
| Electromagnetic (EM) Survey (VTEM, MegaTEM, GeoTEM, etc.) |
Measures subsurface electrical conductivity contrasts; identifies conductors (e.g., graphitic pelites). | 1,000–10,000 | Up to 500m (VTEM); TDEM up to 700m+ | High (down to 25m line spacing) | Direct detection of conductive anomalies linked with basement-hosted uranium deposits. | Susceptible to cultural noise; complex interpretation in conductive overburden. | Identifying fault zones, alteration, and graphite-rich units; key in drill targeting strategies. |
| Gravity Survey | Assesses subsurface density variations indicating geological contacts or alteration zones. | 500–2,000 | Upto 2,000m | Moderate | Effective in mapping basin thickness and large-scale structures. | Lower resolution for fine features; high operational cost over large areas. | Refining models of basin architecture; supplementing other geophysical data. |
| Seismic Survey | Uses acoustic waves to image subsurface layers and faults with high precision. | Up to 1,000 | >2,000m | Very High (down to meter-scale) | Detailed structural imaging; direct detection of alteration and unconformity zones. | Expensive; often used post-discovery for resource definition. | Deposit-scale characterization; supporting advanced exploration and resource estimation. |
1. Geophysical Survey Data Integration: The Cornerstone of Modern Exploration
At the heart of the Athabasca Basin’s ongoing success in uranium exploration lies comprehensive geophysical survey data integration. This approach encompasses the assembly and synthesis of multiple, independently-acquired datasets—from both historical and newly-acquired airborne surveys—leveraged through advanced GIS and modeling platforms.
- Historical Data Compilation: We begin by gathering magnetic, radiometric, gravity, and EM datasets available from government (e.g., Mining and Petroleum GeoAtlas), federal agencies, and private surveys. This includes stratigraphy and structure maps, mineral occurrence records, historical drilling and geochemical data, and even satellite imagery.
- Digital Data Reprocessing & Reinterpretation: Once compiled, these datasets are reprocessed and integrated within GIS—allowing for reinterpretation using current understanding, machine learning methodologies, and improved spatial alignment.
- Contemporary Data Acquisition: New airborne surveys (e.g., MobileMT, Xcite TDEM) are used for infilling, providing higher-resolution coverage, and lending direct detection power for previously unknown conductor, magnetic, or radiometric anomalies.
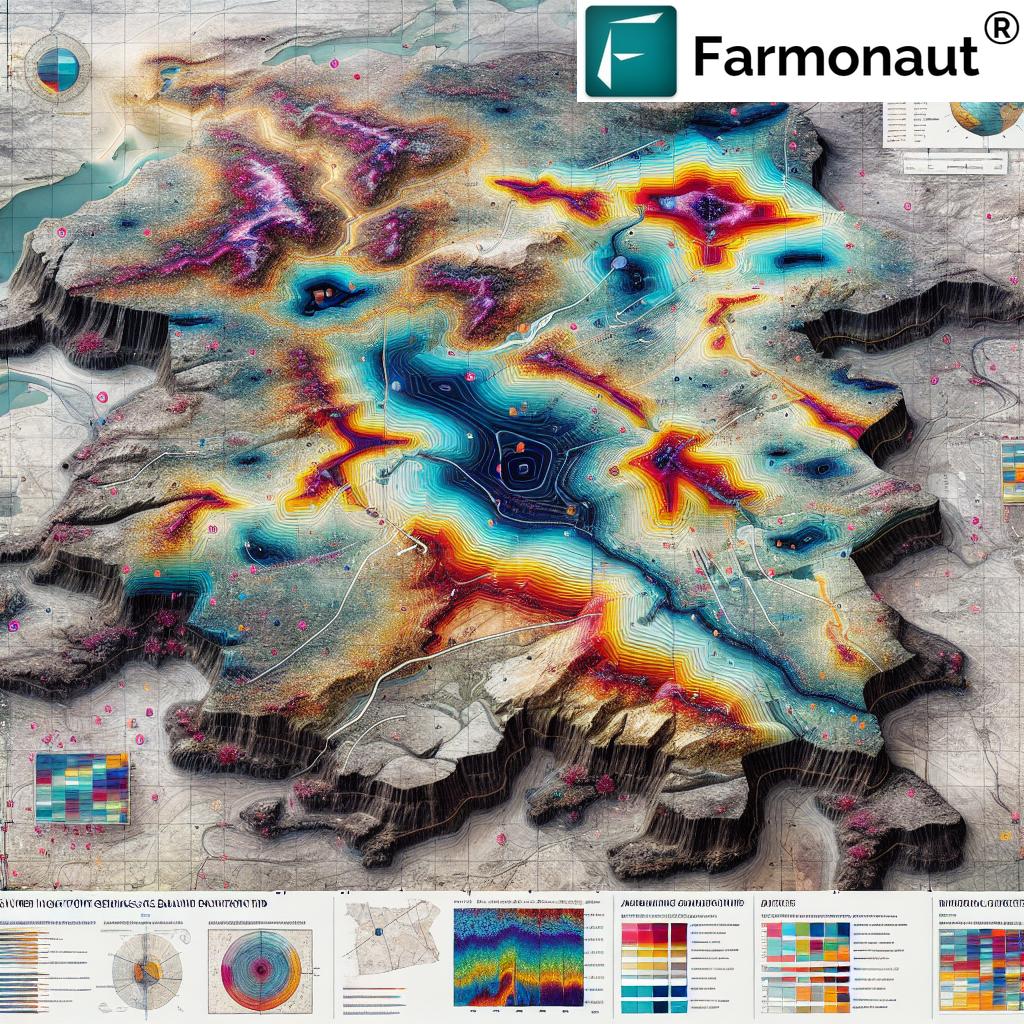
- Integrated Interpretation: The true power of data integration is realized in overlaying magnetic derivative background images with EM decay products, radiometric ratio images, and topographic layers—ultimately guiding mineral claim targeting and drill target prioritization.
This layered approach underpins all modern uranium and critical mineral exploration in Canada, and serves as the critical technical foundation for effective exploration investment decisions throughout Saskatchewan’s resource-rich regions.
Why is Integration Essential?
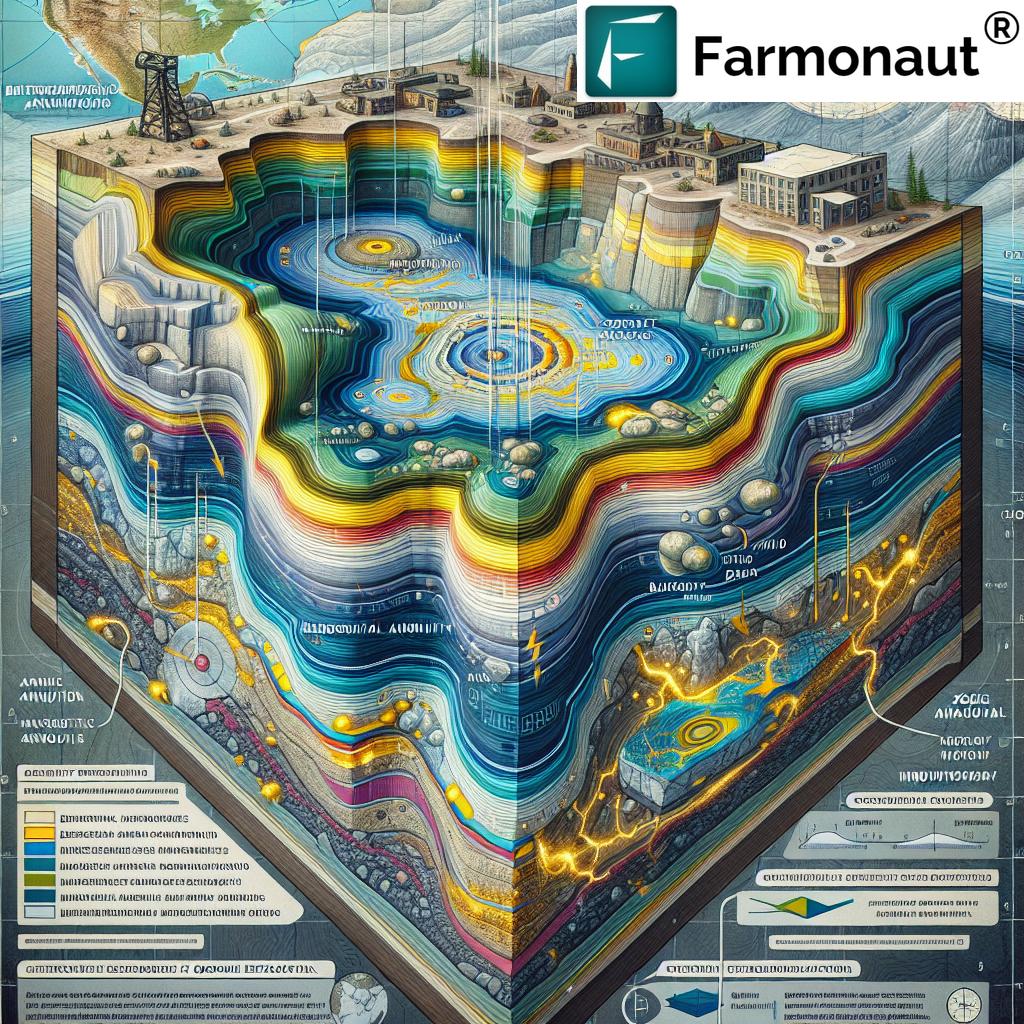
- High-grade uranium deposits frequently lie at depth (hundreds of meters below surface) and are often masked by significant glacial overburden and surface cover, obscuring their direct detection.
- Integration unveils subtle, coincident geophysical features (e.g., EM conductors aligning with magnetic lows and subtle radiometric enhancements) which are hallmark signatures of basement-hosted unconformity-related uranium deposits.
Ultimately, geophysical data reinterpretation substantially improves our capacity to identify anomalies of interest, characterize structural trends, and de-risk exploration drilling programs—a paradigm that is powering the next wave of discoveries not just in Saskatchewan, but globally.
Farmonaut’s blockchain-based Product Traceability Solutions offer secure, transparent records from source to end-user, ensuring every stage of the mineral or agricultural product journey can be digitally verified for authenticity and regulatory compliance.
2. Airborne Magnetic and Radiometric Surveys: Revealing Hidden Uranium Targets
Airborne surveys are the primary engines of rapid, large-scale data acquisition in the Athabasca Basin. Magnetic and radiometric methods, in particular, combine to provide a nuanced view of both the subsurface structural architecture and direct uranium prospectivity.
Airborne Magnetic Survey: Mapping the Hidden Basement
- Magnetic datasets capture subtle changes in the Earth’s magnetic field. Since the Athabasca Basin unconformity is a key control for high-grade uranium, mapping underlying magnetic lows (often corresponding to graphitic pelites or altered basement rocks) enables us to predict the locations where mineralization controls concentrate.
- Modern techniques (like high-sensitivity sensors, close line spacing, and powerful derivative imaging) have led to detection of intricate fault networks, folds, and alteration zones—features central to uranium deposit models.
- Background: For example, the strong correlation between known uranium occurrences (such as the Rabbit Lake and Cigar Lake mines) and mapped magnetic lows is a foundational exploration insight across Saskatchewan.
Radiometric Survey: Enhancing Direct Uranium Detection
- Radiometric surveys measure K, Th, U (potassium, thorium, uranium) concentrations at or near the surface, using aircraft-mounted sensors.
- Although radiometric signatures can be muted by thick overburden in the basin, advanced analysis—including ratio products and statistical enhancement—often reveals subtle radiometric anomalies related to alteration halos or background enrichment.
- Enhanced radiometric mapping is particularly valuable in areas where the basin sandstone cover is thin, or where structural corridors permit upward migration of radiogenic elements.
Integration: The most prospective uranium targets are typically coincident anomalies—where magnetic lows, radiometric enhancements, and EM conductors spatially overlap. This multi-dataset convergence serves as a strong drill targeting and staking tool in ongoing claim management.
3. Electromagnetic Conductor Anomalies and Basement-Hosted Uranium Deposits
The central technical focus of recent Athabasca Basin surveys has been the identification and modelling of electromagnetic conductor anomalies. These are zones of heightened electrical conductivity in the subsurface—frequently tracing graphitic pelite units, clay alteration, or fault-related fluid pathways—that provide the most direct geophysical clues to high-grade, basement-hosted uranium mineralization.
How Are EM Conductor Anomalies Detected?
- Airborne EM Surveys: Technologies such as VTEM (Versatile Time-Domain EM), MegaTEM, GeoTEM, MobileMT, and Xcite TDEM (Time Domain Electromagnetic) surveys are routinely flown in the region.
- Data Products: The resulting data are visualized as decay colour images (where “hot” colours indicate electrical conductors) and cross-plotted against magnetic derivative background maps to identify coincident, priority anomalies.
- High-definition Modelling: The use of modern inversion and 3D modeling techniques enables us to resolve not just the presence but also the geometry, dip, and connectivity of these conductive bodies beneath cover.
Interpretation: EM conductors that are spatially coincident with magnetic lows—especially those aligning along regional structural trends—are highly prioritized as drill targets, having proven spatial association with several discovered Athabasca uranium deposits.
For resource companies, optimizing onsite operations and field logistics is mission-critical. Farmonaut’s Fleet Management solution empowers teams to track vehicles, schedule deployments, and coordinate data acquisition efforts efficiently—maximizing safety and minimizing resource wastage on large exploration sites in remote regions.
Example: Prioritizing Drill Targets
Across Mustang’s extensive projects, detected conductors at 914W, Spur, Ford Lake, and Cigar Lake East frequently present as “hot” features on EM decay colour images:
- For instance, at Ford Lake, a notable untested EM conductor (hot colour) coincides with a magnetic-low trend and sits along a mapped fold axis—directly associated with a known uranium occurrence nearby.
- At 914W, an EM conductor of interest overlies a subdued radiometric U signature (priority target area) and aligns along a trend with other mineral occurrences.
4. Advanced Radiometric Anomaly Detection under Surface Cover
While radiometric surveys have long been a mainstay for direct uranium exploration, maximizing their efficacy in the Athabasca Basin—dominated by sandstone and glacial overburden—demands advanced approaches to signal enhancement, ratio analysis, and anomaly discrimination.
- Ratio Analysis and Products: Calculating ratios (e.g., U/Th, K/U) and producing composite ternary images allows us to visually enhance areas with subtle radiometric responses that could signal upward-leaked uranium or alteration pathfinders beneath shallow cover.
- Surface Cover Correction: By integrating radiometric results with elevation models and geochemical information, we can partially correct for surface attenuation—reducing false negatives, especially in the Spur and South Basin regions where thick till may mute primary signals.
Modern Example: Spur Project Radiometrics
The Spur Project, located about 30 km south of the basin, highlights the intersection of regional magnetic-low and EM conductor trends. Here, radiometric anomalies exist but are subdued by overlying material. The deployment of the Xcite TDEM system—co-collecting modern EM and radiometrics—stands to fill gaps left by historical coverage, advancing our anomaly detection capability.
Managing extensive datasets and field operations in multi-hectare projects? Farmonaut’s Large-Scale Farm & Land Management App is engineered for corporate or research teams. Access satellite monitoring, geo-tagging, and field management dashboards in one unified platform—ideal for both agribusiness and mining resource management alike.
5. Mineral Claim Targeting and Project Prioritization: Case Examples across Saskatchewan
Perhaps the most material result of comprehensive geophysical data integration and reinterpretation is its direct impact on mineral claim targeting, staking, and project prioritization. Here, we review the outcomes as seen in key active projects within Mustang’s uranium portfolio, referencing mapped regional trends, claim outlines, anomaly detection, and multi-layer data overlays.
Note: Each example below is underpinned by high-resolution EM decay images (where hot colours indicate conductors), greyscale magnetic derivative backgrounds, ternary radiometric overlays, and georeferenced claim and occurrence data (map layers retrieved from Government of Saskatchewan Mining and Petroleum GeoAtlas and Natural Resources Canada).
A. 914W Project (approx. 45 km south of Basin edge)
- Hosts an EM conductor anomaly coincident with a magnetic low and subtle radiometric uranium signature.
- Lies along a regional trend with multiple uranium and REE occurrences; selected for imminent field prospecting.
- Refer to Figure 1: 914W Project Claim Map and Occurrences Mosaic.
B. Spur Project (30 km south of Basin)
- Intersected by regional magnetic-low and EM conductor trends.
- Shows radiometric anomalies despite significant surface cover.
- Project also considered prospective for REE mineralization.
- See Figure 2: Spur Project Ternary Radiometric and EM Panels.
C. Ford Lake (within Basin, near south edge)
- Comprises three non-contiguous claim blocks (interpreted unconformity depth ~400m).
- Features a strong EM conductor anomaly coincident with a magnetic-low trend; spatially associated with a known uranium occurrence.
- Mapping and sampling planned for follow-up.
- Reference: Figure 3: Ford Lake EM/Magnetic/Occurrence Composite
D. Cigar Lake East (within Basin, east edge)
- Historic and untested NE-SW magnetic-low trends coincide with EM anomalies inside Mustang’s claims.
- Adjacent to known mineralized trends, along strike from historic Rabbit Lake Mine.
- See: Figure 4: Cigar Lake East EM/Magnetic/Drillhole Map.
Targeting Advantages
- Cost-Efficiency: By focusing field work on priority claim blocks with coincident anomalies, resources are conserved for the highest-potential areas.
- Portfolio Management: Immediate results enable dynamic review of new claim staking opportunities or joint venture evaluations across the wider Athabasca region.
Exploration and mining companies face increasing regulatory pressure to document sustainability efforts. Farmonaut’s Carbon Footprinting platform delivers real-time data on carbon emissions and resource usage at the project level—supporting compliance and ESG reporting for both agricultural and mineral resource enterprises.
Industry & Technology Trivias
- Did you know? The Athabasca Basin’s geological complexity means that less than 10% of its area has been drill-tested despite over 50 years of exploration.
- Modern airborne surveys can detect conductive anomalies as subtle as a few parts per million, revolutionizing basement-hosted uranium discovery.
Farmonaut Solutions for Data-driven Decision-making in Resource Sectors
As industries like mining and agriculture become increasingly reliant on advanced geophysical data and integrated monitoring, platforms that deliver real-time, accessible insights are key to operational success. Farmonaut’s technologies empower users across scales—from exploration geologists to agribusinesses and government bodies—with:
- Satellite-Based Crop and Land Health Monitoring: Multispectral satellite imagery for site condition assessment, vegetation and surface anomaly tracking over thousands of hectares.
- AI-driven Advisory Systems: For data-rich recommendations on operational decisions, optimizing both resource management and exploration focus.
- Blockchain Traceability: Detailed, tamper-proof documentation for every stage in the mineral or agricultural product lifecycle.
- Fleet and Resource Management: Streamlined logistics management for field teams, machinery, and geophysical survey campaigns.
- Carbon Footprint Monitoring: Automated, site-based accounting of greenhouse gas emissions—essential for meeting evolving ESG and compliance standards.
- API Access for Developers: Seamless integration of weather and geophysical data into proprietary software, dashboards, or research platforms.
Real-time, high-resolution insights—from satellite crop monitoring to integrated mineral datasets—are now available on mobile, web, or via API. This is not just about discovering uranium in the Athabasca Basin; it’s about applying the same decision-making advantage to every sector dealing with complex assets distributed over large landholdings.
Increase rural access to financing: Farmonaut’s Crop Loan and Insurance solutions harness satellite monitoring and geophysical data to validate crop area and condition, minimizing fraud and accelerating insurance or loan approvals for agricultural and resource-adjacent properties.
Frequently Asked Questions (FAQ) – Athabasca Basin Uranium Exploration & Geophysical Insights
Q1. What is the primary focus keyword for this resource?
A: The primary focus keyword is “Athabasca Basin uranium exploration.” Additional core keywords include: geophysical survey data integration, airborne magnetic and radiometric surveys, uranium exploration in Saskatchewan, electromagnetic conductor anomalies, and mineral claim targeting.
Q2. Why are EM conductors and magnetic lows so critical in uranium exploration in the basin?
A: EM conductors (notably in graphitic pelites) and magnetic lows are markers of fault zones and alteration associated with basement-hosted unconformity uranium deposits—making coincident anomalies high-priority drill targets.
Q3. How do airborne radiometric surveys overcome surface cover challenges?
A: Through advanced statistical products (ratios of K, Th, U) and integration with elevation/topography models, radiometric surveys can highlight subtle anomalies suggesting buried mineralization, even if thick overburden attenuates signal intensity.
Q4. What role does Farmonaut play in resource and exploration management?
A: Farmonaut provides satellite-based agricultural and land management solutions, AI advisory, traceability, fleet/resource management, carbon footprint tracking, and API integrations—enabling data-driven decisions for wide-ranging enterprises across agriculture and resource extraction sectors.
Q5. Where can I access live satellite or geophysical data for my land or project?
A: Through the Farmonaut web/mobile app (Access Now), Android or iOS downloads, or via developer API and dashboards for corporate users/developers.
Conclusion
As we look to the future of Athabasca Basin uranium exploration in Saskatchewan, success will be shaped by those companies and teams that most effectively harness the integrated power of geophysical survey data, airborne magnetic and radiometric surveys, advanced EM modeling, and intelligent data-driven targeting. The five key insights detailed in this blog—each rooted in the synthesis of multi-layered data, cutting-edge interpretation, and rapid response field programs—mark the blueprint for discovery in one of the world’s most prolific critical mineral regions.
For professionals and operations managers involved in mining, agriculture, or land management, the pace of technological advancement—spanning from geophysical interpretation to automated satellite monitoring—demands readiness to adapt and capitalize on new information sources. Platforms like Farmonaut make these insights actionable, scalable, and accessible for enterprises of all sizes, accelerating not just discovery but smarter stewardship of our planet’s most valuable resources.