
Revolutionizing Gold Exploration in Peru: A Comprehensive Case Study on Satellite-Based Prospectivity Mapping (2020-2025)

In the ever-evolving world of mineral exploration, where traditional methods often grapple with high costs, risks, and inefficiencies, innovative technologies are stepping in to transform the landscape. One such breakthrough is the use of satellite remote sensing for gold prospectivity mapping. This case study delves into a groundbreaking project conducted by Farmonaut Technologies, focusing on enhanced gold prospectivity mapping in a promising region of Peru. Spanning from 2020 to 2025, the initiative leveraged temporal and multispectral satellite analysis to identify high-potential gold exploration targets. By harnessing the power of data-driven insights, this approach not only minimizes fieldwork but also maximizes the chances of discovering economically viable deposits.
Gold exploration in Peru has long been a cornerstone of the mining industry, with the country boasting significant reserves within geologically favorable terrains. However, the challenges of remote, rugged landscapes and environmental considerations make conventional surveying methods cumbersome. Enter satellite-based mineral detection—a non-invasive, cost-effective tool that analyzes spectral signatures to pinpoint hydrothermal alteration zones associated with gold deposits. In this blog, we’ll explore the project’s objectives, methodology, results, and implications, offering valuable insights for geologists, mining companies, and investors interested in advanced gold prospecting techniques.
Whether you’re searching for “satellite remote sensing for gold exploration” or “hydrothermal alteration mapping in Peru,” this in-depth analysis will provide a roadmap to understanding how modern technology is reshaping the future of mining.
The Rising Need for Advanced Gold Prospectivity Mapping
Mineral exploration, especially for precious metals like gold, is inherently risky and capital-intensive. Traditional methods involve extensive geological surveys, drilling, and sampling, which can take years and cost millions—often with uncertain outcomes. In regions like Peru, known for its rich gold endowments in the Andean belt (often misattributed in reports to other cratons but correctly tied to local geology), these challenges are amplified by difficult terrain, sparse vegetation, and climatic variations.
The project at hand addresses these pain points head-on. Commissioned by client Elena Baryshnikova and executed by Farmonaut Technologies, the study aimed to conduct a comprehensive remote sensing analysis over a 1.13-square-kilometer Area of Interest (AOI). The core goal? To systematically identify, characterize, and rank high-potential gold exploration targets, thereby guiding more efficient field investigations.
Why is this relevant today? With gold prices fluctuating amid global economic uncertainties, efficient prospecting methods are crucial. Satellite-based approaches offer a reconnaissance tool that narrows down search areas by mapping alteration zones—chemical changes in rocks caused by mineralizing fluids. These zones act as “pathfinders” for gold deposits, reducing the exploration footprint and environmental impact.
Key objectives included:
- Processing a four-year time-series of satellite imagery to capture seasonal variations.
- Mapping key mineral alteration assemblages such as phyllic, argillic, propylitic, and iron oxides.
- Developing a multi-component Gold Potential Index (GPI) that incorporates temporal stability for reliable targeting.
- Delivering prioritized exploration targets based on quantitative scoring.
This methodology not only enhances accuracy but also aligns with sustainable mining practices, making it a hot topic in searches for “sustainable gold mining Peru” or “remote sensing in mineral exploration.”
Understanding the Study Area and Data Foundations
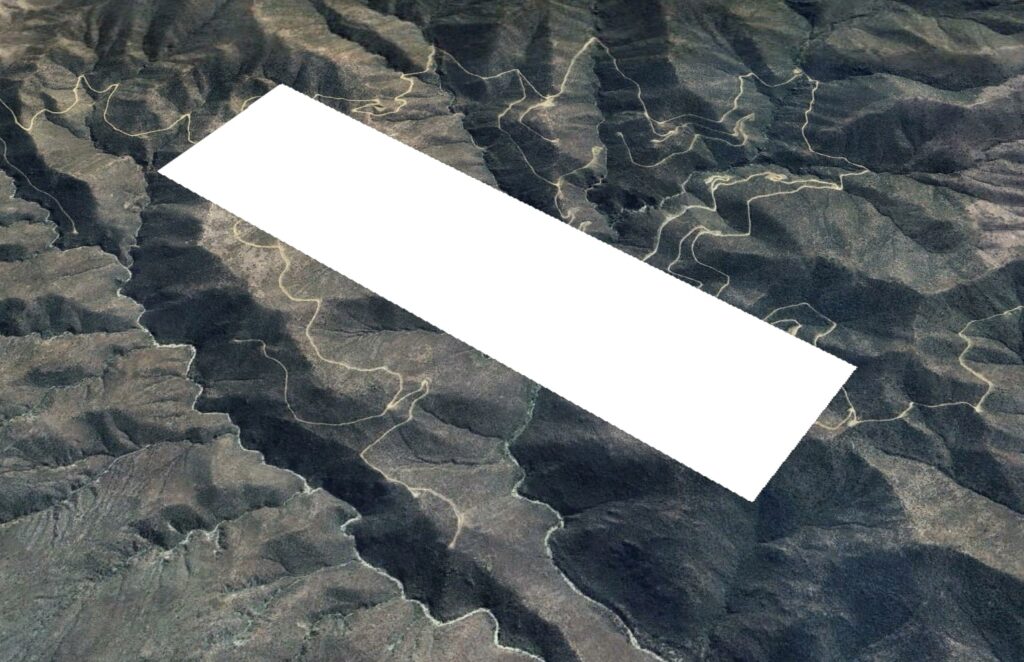
The AOI, situated in a prospective Peruvian region, benefits from an arid to semi-arid climate. This results in minimal vegetation cover, ideal for satellite-based surface geology analysis. Covering just 113 hectares, the area was selected for its geological promise, with potential ties to regional fault systems that often host gold mineralization.
Data sources formed the backbone of the analysis:
- Satellite Imagery: Primarily from Landsat 8 OLI and Landsat 9 OLI-2 sensors. These provide Collection 2, Level-2 Surface Reflectance data, which is pre-calibrated and atmospherically corrected for precise spectral studies. With a 30-meter spatial resolution, the dataset included all available imagery from January 1, 2020, to June 30, 2025—a total of 182 scenes.
- Digital Elevation Model (DEM): Sourced from the Shuttle Radar Topography Mission (SRTM) at 30-meter resolution. This was used to derive elevation and slope data, filtering out anomalies in topographically unsuitable areas.
By integrating these datasets, the project ensured a robust foundation for detecting subtle mineral signatures. For those querying “Landsat satellite gold detection,” this highlights how publicly available data can be leveraged for commercial-grade insights.
A Step-by-Step Dive into the Methodology
The methodology was designed for repeatability and transparency, breaking down into five stages: data pre-processing, spectral analysis, GPI modeling, target identification, and anomaly characterization. This structured approach is what sets satellite-based gold prospectivity apart from guesswork.
3.1 Data Pre-Processing: Building a Clean Foundation
High-quality data is non-negotiable in remote sensing. The process began with acquiring all relevant Landsat scenes, followed by rigorous cleaning:
- Cloud and Shadow Masking: Each image was masked to exclude obscured pixels, ensuring only clear ground views were analyzed.
- Seasonal Compositing: Pixels were aggregated into dry (November-May) and wet (June-October) season composites using median values. This mitigated seasonal interference, such as vegetation blooms in wet periods.
- Annual and Overall Composites: Additional composites for each year (2020-2024) and the full period supported temporal analysis.
This step alone processed vast amounts of data, creating seamless images that represent true geological features rather than transient noise.
3.2 Spectral Analysis: Uncovering Alteration Signatures
At the heart of the detection lies spectral indices—mathematical band ratios that highlight target minerals. These indices exploit the unique ways minerals reflect light across wavelengths:
- Phyllic Alteration Index: (SWIR1 / NIR) – Detects white micas like sericite, common in gold-hosting zones.
- Argillic Alteration Index: (SWIR2 / SWIR1 * Red / Green) – Targets clays such as kaolinite.
- Iron Oxide Index: (Red / Blue) – Maps gossans from hematite and goethite.
- Propylitic Alteration Index: (NIR / SWIR1 * Green / Red) – Identifies chlorite and epidote halos.
- Silicification Index: (SWIR2 / SWIR1 * NIR / Red) – Spots quartz veining.
These calculations transformed raw data into alteration maps, revealing hidden geological patterns. For SEO enthusiasts looking up “spectral indices for hydrothermal alteration,” this section underscores their practical application in real-world gold exploration.
3.3 Gold Potential Index (GPI) Modeling: Integrating Layers for Precision
Individual maps are useful, but a unified score is game-changing. The GPI model combined alteration data with weights reflecting geological importance in orogenic gold systems:
- 30% Phyllic + 25% Argillic + 20% Silicification + 15% Propylitic + 10% Iron Oxide.
Seasonal GPIs were calculated separately for dry and wet composites. Then, temporal stability was assessed using the Coefficient of Variation from annual composites—low variation indicated persistent, geological signals.
The final Combined GPI blended dry (60% weight) and wet (40%) scores, multiplied by temporal weights. This innovation filters out false positives, such as agricultural changes, ensuring targets are reliable.
3.4 Target Identification and Filtering
Anomalies were delineated from the GPI map, then refined using DEM-derived filters (e.g., excluding steep slopes). This produced a set of polygons representing high-potential zones.
3.5 Anomaly Characterization and Prioritization
Targets were ranked using an Enhanced Prioritization Score, integrating:
- Average Potential (intensity).
- Area (size).
- Temporal Stability (consistency).
- Seasonal Contrast (clarity).
This multi-criteria system provides actionable rankings, far superior to simple heatmaps.
Unveiling the Results: Prospectivity Maps and Key Findings
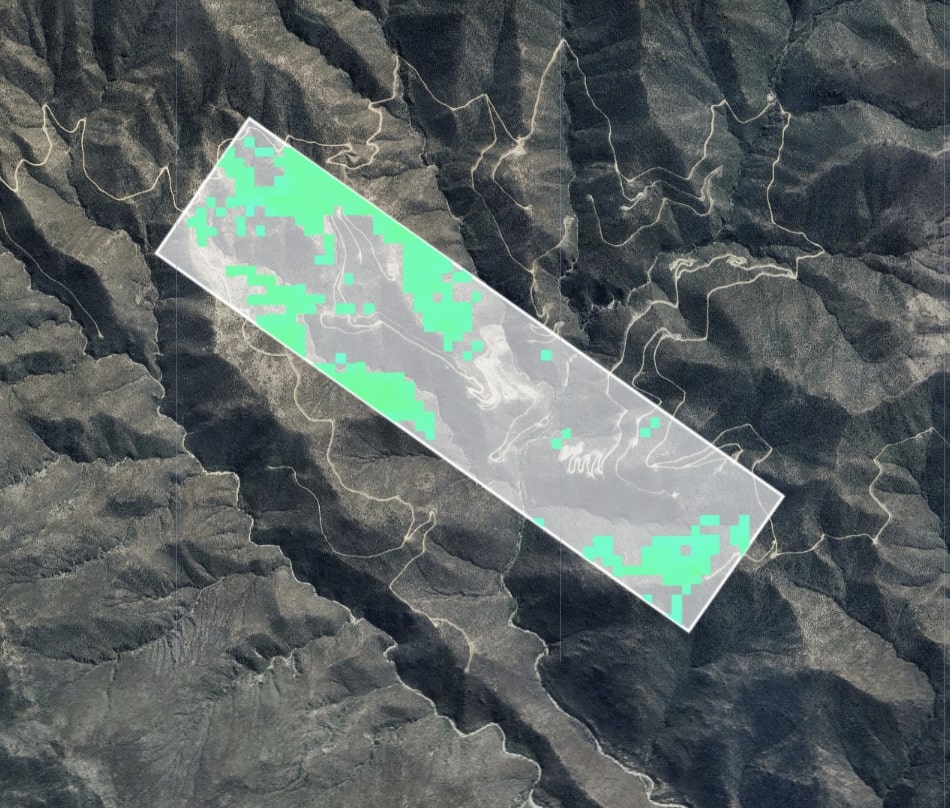
The analysis yielded compelling results, visualized through prospectivity maps. The Final Gold Anomaly Map stands out, overlaying prioritized polygons on a true-color satellite base. These anomalies cluster in patterns suggestive of structural controls, like faults acting as fluid conduits.
Significant gold potential locations were identified, each with estimated grams per tonne (ranging from 2.78 to 3.69) and depths (170-220 meters). While exact positions are proprietary, the data indicates a wealth of targets warranting field validation. For instance, higher-grade anomalies (above 3.5 g/t) often correlate with shallower depths, optimizing drilling plans.
This output not only narrows the search but also quantifies potential, aiding investment decisions in “gold mining prospects Peru.”
In-Depth Discussion: Interpreting Results and Methodological Strengths
The non-random distribution of anomalies points to geological controls, aligning with known Peruvian gold systems. Structural features likely channel mineralization, offering clues for deeper exploration.
5.1 Interpretation of Results
The Enhanced Score’s holistic integration avoids pitfalls of intensity-only mapping. By considering size, stability, and contrast, it prioritizes targets with the best economic potential. Temporal analysis further boosts confidence, distinguishing geological signals from seasonal artifacts.
5.2 Strengths of the Methodology
Two innovations shine:
- Temporal Stability: Multi-year data filters transient noise, reducing false positives.
- Seasonal Integration: Comparing wet and dry composites enhances signal clarity.
These elements make the approach superior for arid regions like Peru, where vegetation interference is low but seasonal moisture varies. Compared to traditional methods, this saves time and costs—potentially cutting exploration expenses by 50-70% in reconnaissance phases.
Broader implications? This methodology scales to larger areas, supporting portfolio diversification for mining firms. It also promotes sustainability by minimizing ground disturbance until high-confidence targets are confirmed.
For those researching “advantages of remote sensing in gold exploration,” the strengths lie in its non-invasive nature, repeatability, and data-driven precision.
Challenges and Future Directions in Satellite-Based Gold Prospecting
No method is flawless. Limitations include the 30-meter resolution, which may miss sub-pixel features, and reliance on surface expressions—deeper deposits might require geophysical follow-up. Cloud cover in wet seasons also poses data gaps, though mitigated by multi-scene compositing.
Looking ahead, integrating higher-resolution sensors (e.g., Sentinel-2) or AI-driven anomaly detection could refine results. Machine learning models trained on spectral data might predict grades more accurately, evolving this into predictive analytics.
In Peru’s context, regulatory support for tech-driven mining could accelerate adoption, aligning with national goals for resource development.
Conclusion: Pioneering a New Era in Gold Exploration
This case study on enhanced gold prospectivity mapping in Peru exemplifies how satellite remote sensing is revolutionizing mineral exploration. By processing vast temporal datasets, mapping alteration zones, and applying a sophisticated GPI, Farmonaut Technologies delivered prioritized targets that promise to streamline fieldwork and boost discovery rates.
For mining professionals, this underscores the value of embracing technology amid rising demands for efficiency and sustainability. If you’re exploring “gold prospectivity mapping techniques” or seeking similar services, consider how such innovations can transform your projects.
Ready to harness satellite power for your exploration needs? Visit farmonaut.com to learn more about our mineral detection solutions. With gold’s enduring allure, the future belongs to those who prospect smarter, not harder.
