

Reviewed September 2026 against USDA Economic Research Service farm technology data and industry market research from Mordor Intelligence and Research and Markets.
Try it: Run your own numbers →
US Precision Farming Market Size & Spray Drone Costs
The US precision farming market is valued at $10.54 billion, according to Mordor Intelligence’s North America precision agriculture analysis, growing at a compound annual rate of 12.5% per market research consensus figures. Only 27% of US farms had adopted any precision agriculture practice as of the USDA’s 2023 Technology Use Survey — but that number splits sharply by farm size, and the crop-spraying-drone segment inside this market is growing nearly three times faster than the market as a whole. This article breaks down what the numbers actually say, who is buying what, and what a spray drone costs to own versus hire.



US Precision Farming Market Size
The US precision farming market is valued at $10.54 billion, per Mordor Intelligence’s North America precision agriculture market analysis, with a projected compound annual growth rate of 12.5% through the current forecast window according to consensus figures compiled by MarketsandMarkets’ precision farming market report. That growth rate reflects demand across guidance systems, variable rate application, remote sensing, and farm management software — the core categories that make up the “precision farming” label in most industry segmentations.
For context on scale: North America as a whole (the region Mordor Intelligence tracks separately from the narrower US-only figure) captures the bulk of global precision agriculture revenue, driven by large corn, soybean, and wheat operations concentrated in the Midwest and Great Plains. The market’s growth is not evenly distributed — it concentrates in specific farm sizes and specific technology categories, which the next two sections quantify directly rather than describing in general terms.
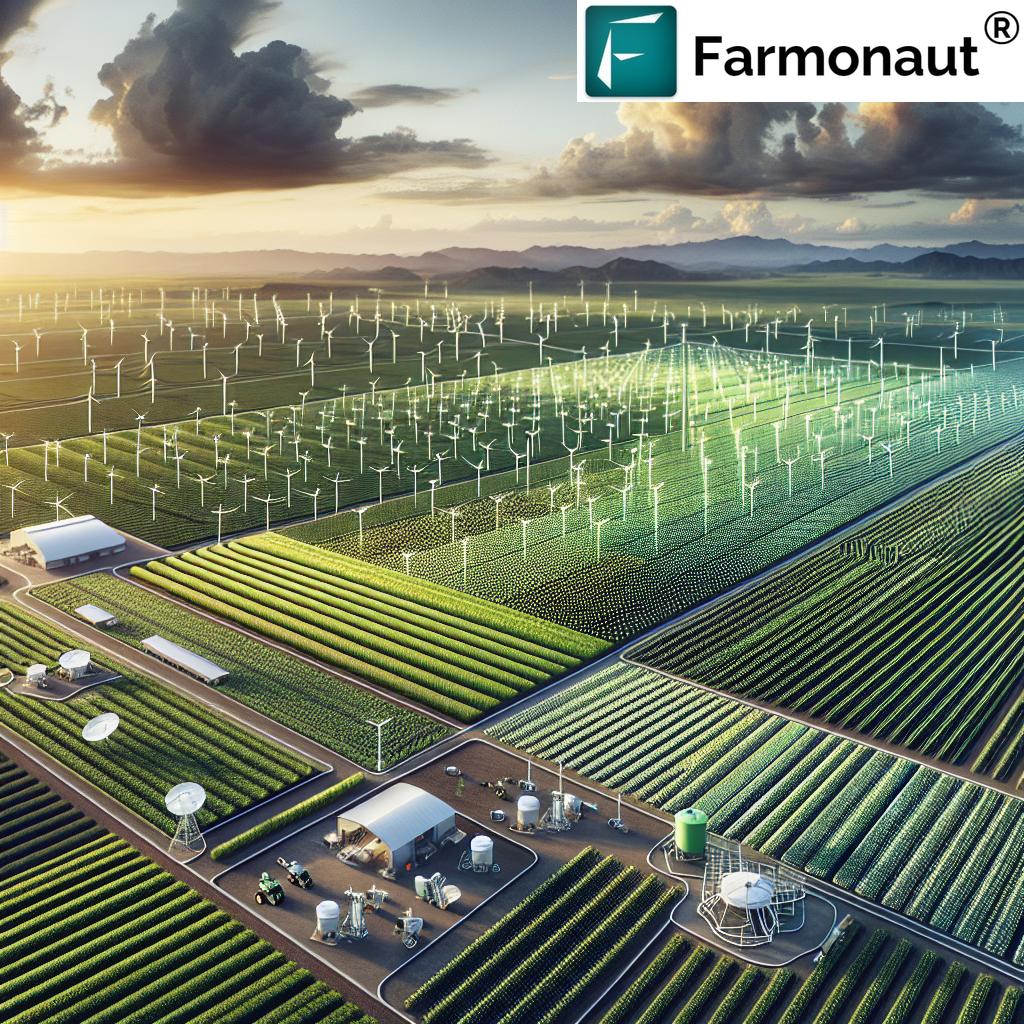

Industry organizations including the American Society of Agricultural and Biological Engineers (ASABE) and the American Society of Agronomy (ASA) continue to publish research and adoption guidance that shapes how this market is measured and where new standards emerge. Neither organization publishes a market-size figure of its own — the dollar figures above come from commercial market research firms that track equipment sales, software subscriptions, and service contracts across the sector.
Adoption Rates by Farm Size: The Real Number
The headline adoption figure most articles cite — “27% of US farms use precision agriculture” — is accurate but incomplete on its own. According to the USDA Economic Research Service’s farm technology use survey, published in 2023, 27% of all US farms had adopted at least one precision agriculture practice. But USDA ERS data on large-scale crop farms shows that among farms with more than $1 million in annual income, adoption jumps to 68%. Precision farming in the US is overwhelmingly a large-operation story: the biggest farms adopted it more than twice as often as the national average.
Drone-specific adoption is much narrower than adoption of guidance systems or variable rate technology. Per the same USDA ERS chart on drone adoption, only 12% of large-scale crop farms had adopted drones as of the 2023 survey — a fraction of the 68% overall precision-ag adoption rate for that same farm-size cohort. Drones remain the least-adopted precision technology category USDA tracks, even among the operations most likely to have adopted everything else.
The gap between 68% overall adoption and 12% drone adoption on the same large farms is the clearest evidence that drones are a distinct purchasing decision from guidance systems or soil sensors — not simply the next rung on the same adoption ladder. A farm can run RTK-guided autosteer and variable rate seeding for years before it ever buys a spray drone, because the equipment class, the regulatory requirements (FAA Part 107 certification, state pesticide applicator licensing), and the labor model are all different.
USDA NASS runs its farm technology surveys annually each December and January, with adoption data from those surveys typically released roughly six months later. The next precision technology adoption dataset covering the current survey year is expected in December 2026, with results likely published around June 2027. For the most current adoption figures by state, query USDA NASS QuickStats directly and filter for “Farms with Precision Agriculture” under the Economics category.
Precision Spraying Drones: Market Size and Cost
The crop spraying drone market — the category behind searches for “precision spraying agriculture” and “spraying drones agriculture” — is valued separately from the broader precision farming figure above. According to Research and Markets’ crop spraying drone report, the global crop spraying drone market is valued at $4.48 billion, with a projected compound annual growth rate of 32.7% from 2026 to 2030 — more than double the 12.5% CAGR of the broader precision farming market. Spraying drones are the fastest-growing subsegment inside precision agriculture technology by a wide margin.
On the ground, that growth shows up as roughly 7.2 million acres of US farmland now under drone spray application and an estimated 38,000 active agricultural spray drones operating across the country, per market research consensus figures compiled by the Agricultural Drone Directory’s 2026 statistics guide. Divide those two figures and the average US spray drone covers roughly 190 acres of treated farmland — consistent with a single operator running one or two drones across a mid-size row-crop operation rather than large custom-application fleets.
What a Spray Drone Actually Costs
Hardware pricing is concrete and checkable. A DJI Agras T40, one of the most widely deployed agricultural spray drones in the US market, lists at $19,999 according to Drone Launch Academy’s agricultural drone resource page. Once you add batteries, chargers, a generator or power source for field charging, training, and insurance, total ownership cost for a typical agricultural spray drone setup runs $30,000 to $40,000, per Farmonaut’s own drone spraying cost guide.
For farms that don’t want to own hardware, hiring a certified operator is the alternative. Average rates for FAA Part 107-certified UAS pilots providing agricultural spraying services run $162 per hour, according to Drone Launch Academy’s rate data. At that rate, a custom-hire arrangement can make sense for smaller acreages where the $30,000–$40,000 ownership cost would take years to pay back through avoided labor and input savings alone.
Return-on-investment timelines for owned equipment run 1 to 3 years, according to Agrinofy’s agricultural drone ROI guide, depending on acreage sprayed per season, crop value, and how much of the labor and input savings the operation captures directly rather than through a contractor. A related but distinct yield driver: eliminating soil compaction from ground-rig spraying — which drones avoid entirely by not driving through the field — is associated with a 5–10% yield improvement, per University of Nebraska-Lincoln research cited in Farmonaut’s spray drone benefits guide. That compaction-avoidance gain compounds with, rather than substitutes for, the direct labor and chemical-use savings drones deliver.
Precision Crop Spraying: Regional Demand
Searches for spray drone services by specific location — including operators near Sullivan, Illinois, in the heart of Midwest corn and soybean country — reflect a real and growing local-service market rather than a niche interest. Illinois, alongside Iowa, Indiana, and the broader Corn Belt, sits inside the row-crop geography where the 7.2-million-acre national drone-spray footprint concentrates most heavily, since aerial application economics favor large contiguous fields planted in high-value row crops. A farm or custom operator evaluating drone services in central Illinois is operating in one of the higher-density regions for this equipment class, though county-level adoption data is not centrally published — the state-level aggregates from USDA NASS QuickStats are the finest public geographic resolution currently available.
For crop scouting that complements ground- or air-based spraying decisions, Farmonaut’s Iowa-specific corn and soybean scouting guide lays out a pest-management calendar built around Midwest row-crop timing.
Drone and satellite imagery both belong to a wider toolkit, and our guide to remote sensing on farms covers it along with the satellites used.
Drone Manufacturers and Reliability: What’s Actually Published
Buyers researching “which company makes the most reliable drones for precision crop spraying” won’t find an independent, publicly available reliability ranking by manufacturer — no USDA, FAA, or market-research source in this brief publishes failure rates, warranty-claim data, or head-to-head durability testing across DJI, Yamaha, Freefly, XAG, or other agricultural drone makers. What is published is pricing: the DJI Agras T40 at $19,999 (cited above) represents one data point in the widely-deployed spray drone category, and typical fully-equipped ownership cost across the category sits at $30,000–$40,000.
Absent an independent reliability study, the practical way to evaluate manufacturer reliability is through FAA Part 107 service records and state agricultural extension demonstration days, where operators fly competing models under the same field conditions. Your state’s Department of Agriculture and land-grant extension service are the most useful starting points for that kind of side-by-side comparison, since neither this brief nor any source in it contains manufacturer-level reliability data.
Guidance Systems for Farming: The Largest Market Segment
Guidance systems using GPS/GNSS technology to steer tractors, combines, planters, and sprayers remain the single largest segment inside the US precision farming market, ahead of spraying drones, variable rate technology, and weather analytics on adoption and dollar value alike. By eliminating pass-to-pass overlap and reducing input waste, these systems cut input costs directly and are the entry point most large farms use before adding other precision technologies — consistent with the USDA ERS finding that 68% of large-scale crop farms have adopted some precision practice, with guidance and autosteer typically first.
Why Guidance Technology Leads Adoption
- Real-time decision-making: Auto-steering combined with variable rate application lets farmers act on field data without manual correction.
- Direct input savings: Eliminating overlap in seeding, fertilizing, and spraying passes reduces input costs pass by pass.
- Lower dependence on skilled labor: Automated steering reduces the precision-driving skill required of every equipment operator.
- Reduced environmental impact: Less overlap means less excess fertilizer and chemical reaching soil and water.
Major equipment manufacturers including Deere & Company, AGCO Corporation, and Ag Leader Technology continue to develop guidance and autosteer products that set the pace for this segment.

Weather Tracking and Forecasting in Agriculture
Volatile weather is a persistent operational risk for US row-crop and specialty growers, and the weather tracking and forecasting segment is one of the faster-growing categories inside the broader precision farming market described above. Farmers and agribusinesses increasingly combine field-level weather stations, soil sensors, and satellite imagery with predictive analytics to track temperature swings, precipitation forecasts, soil moisture, and solar radiation at the field scale rather than the county scale.
These field-specific weather inputs feed directly into planting-window decisions, irrigation scheduling, pest-pressure modeling, and risk mitigation — all of which affect yield and cost outcomes independent of drone or guidance-system investment. Farmonaut’s crop advisory platform layers satellite imagery, weather analysis, and AI-driven recommendations for US farmers evaluating these tools without adding dedicated on-field weather hardware. Explore Farmonaut’s advisory features for planting and risk management.
Key Technologies Enabling Precision Farm Management
The technology categories below make up the bulk of the $10.54 billion US precision farming market described above, each with a distinct adoption pattern and cost structure.
Agricultural Sensor Technologies
- Soil sensors: Track moisture, pH, salinity, and temperature for irrigation and fertilization decisions.
- Crop sensors: Detect nutrient deficiency or pest stress signals before visible symptoms appear.
- Weather sensors: Provide localized rainfall, temperature, and wind data for field-level management.
Remote Sensing and Satellite Imagery
- Satellite imagery: Supports real-time monitoring and yield estimation without on-field hardware.
- Multispectral and hyperspectral imaging: Adds detail on crop vigor, disease pressure, and soil variation.
- Platforms including Farmonaut use satellite-based NDVI, soil moisture, and custom indices to convert raw imagery into field-level recommendations.
Farmonaut’s satellite-based monitoring, available on Android, iOS, and web, lets a US farm access these same NDVI and soil-moisture inputs without the upfront hardware cost of on-field sensor networks. Explore Farmonaut’s large-scale farm management tools for multi-field dashboards and analytics: Farmonaut’s Large-Scale Farm Management.
Advanced Farm Equipment Technologies
- Autonomous tractors and robots: Reduce dependence on operator labor for repetitive field passes.
- Variable rate technology (VRT): Applies seed, fertilizer, or chemical at a rate that varies by zone within a single field, cutting input costs where a zone doesn’t need the full rate.
- Drones and UAVs: Used for crop scouting, spraying (detailed above), and high-resolution field mapping.
AI and Data-Driven Software Platforms
- Farm management software: Combines geospatial, weather, and equipment data into a single operational view.
- AI-powered recommendations: Tailors planting, pest management, and rotation guidance to individual field conditions.
- Blockchain-based traceability: Supports supply-chain verification. See how Farmonaut applies this for US agriculture: Farmonaut’s Crop Traceability Solution.
Fleet and Resource Management
- Scheduling and routing for tractors, trucks, and sprayers cuts idle time and fuel cost across multi-field operations.
- Remote monitoring supports oversight of equipment spread across multiple locations.
- Farmonaut’s fleet tools support operational cost reduction in logistics: Farmonaut Fleet Management.
Carbon Footprinting and Sustainability Tracking
- Emissions tracking supports both regulatory reporting and voluntary sustainability commitments.
- Farmonaut’s carbon footprinting tool is built for both large and small US farm operations: Farmonaut’s sustainability tracking.
Crop Loan and Insurance Verification
- Satellite-based field verification speeds loan approval and reduces insurance fraud exposure for lenders and farmers alike.
- See Farmonaut’s approach for US agriculture: Farmonaut Verification Platform.

Technology Segment Summary
| Technology/Segment | Market or Cost Figure | Adoption or Growth Data | Source |
|---|---|---|---|
| US precision farming market (overall) | $10.54 billion | 12.5% CAGR | Mordor Intelligence / MarketsandMarkets |
| Crop spraying drones (global) | $4.48 billion | 32.7% CAGR, 2026–2030 | Research and Markets |
| Precision ag adoption, all US farms | — | 27% of farms | USDA ERS Technology Use Survey, 2023 |
| Precision ag adoption, large-scale crop farms | — | 68% of farms >$1M income | USDA ERS, 2023 |
| Drone adoption, large-scale crop farms | — | 12% of farms >$1M income | USDA ERS, 2023 |
| Spray drone hardware (DJI Agras T40) | $19,999 | — | Drone Launch Academy, 2026 |
| Full spray drone ownership cost | $30,000–$40,000 | ROI in 1–3 years | Farmonaut / Agrinofy, 2026 |
| Hired UAS pilot rate | $162/hour | — | Drone Launch Academy, 2026 |
Spray Drone ROI Calculator
Estimate your payback period for buying a spray drone versus hiring a certified UAS pilot, using your own acreage and rate — plug in your numbers below.
Run your own numbers
Assumes a single drone, one hired pilot rate applied uniformly across all passes, and no allowance for financing costs, maintenance, or downtime. It excludes the 5–10% yield gain from avoided soil compaction (University of Nebraska-Lincoln, cited above), which would shorten the effective payback further. Use your own quoted hire rate and drone throughput for an accurate estimate.
Farmonaut: Satellite-Based Precision Farm Management in the US
Farmonaut works alongside the equipment and drone categories described above by supplying the satellite data layer — NDVI, soil moisture, and weather context — that informs where and when to deploy guidance systems, VRT, or a spray drone in the first place.
- Satellite-Based Real-Time Crop Monitoring: NDVI, soil moisture, and related field data delivered to smartphone or desktop.
- Jeevn AI Advisory System: Tailored advisory, weather forecasts, and recommendations for farm workflow decisions.
- Blockchain Traceability: Origin tracking and product authenticity solutions for supply chain participants.
- Resource and Fleet Management: Smart fleet operation for large farm operations. Farmonaut Fleet Management.
- Carbon Footprint Monitoring: Environmental impact tracking via carbon footprinting platform.
Farmonaut’s applications are available on Android, iOS, Web, and via API. For enterprise developers and integrators: See Farmonaut’s API and developer documentation for integration with existing agri-IT platforms.
Farmonaut also supports financial institutions with satellite-based crop loan and insurance verification: satellite verification for crop loan and insurance claims.
Who Benefits from Farmonaut’s Technologies?
- Individual farmers — real-time crop monitoring and actionable insight without dedicated on-field hardware.
- Agribusinesses — plantation management, fleet optimization, sustainability tracking across multiple sites.
- Government and NGOs — field-scale monitoring in support of policy and sustainable-practice programs.
- Financial sector — satellite-backed loan and insurance verification.
- Corporate clients — origin and journey traceability for supply chain transparency.
Major Companies in US Precision Farming
The guidance-systems and equipment side of the market is dominated by a small group of large manufacturers, while sensor, remote-sensing, and software categories include a broader mix of specialists.
- Deere & Company — guidance technologies, precision equipment, and integrated software platforms.
- Trimble Inc. — GPS-based field management and auto-guidance systems.
- AGCO Corporation — farm machinery and integrated management systems.
- Raven Industries, AgJunction, and Ag Leader Technology — variable rate technology and data management platforms.
- AgEagle Aerial Systems, Topcon, TeeJet Technologies, and Climate LLC — sensor technology, remote sensing, and climate-focused agri-solutions.
Farmonaut operates alongside these equipment manufacturers as the satellite data and advisory layer, rather than competing on hardware. Foundational research support from ASA and ASABE, along with market analysis from firms like MarketsandMarkets and Mordor Intelligence, continues to shape how this sector is measured and where new standards emerge.

How to Verify These Numbers Yourself
Every figure in this article carries a source and a vintage, and each one is checkable on a fixed schedule rather than taken on faith:
- USDA adoption rates: Query USDA NASS QuickStats for “Farms with Precision Agriculture” by state. The underlying survey runs each December–January; results typically publish roughly six months later — the next cycle covering the current survey year is expected around June 2027.
- Market size and CAGR: Mordor Intelligence, IMARC Group, and Research and Markets update sizing quarterly, with most annual forecasts finalized in the first quarter of each year. Check their published reports directly for the current figure before relying on a cited number more than a year old.
- FAA and pesticide licensing requirements: University of Florida IFAS’s guide to FAA and EPA agricultural drone requirements summarizes Part 107 certification and spray-specific rules; FAA registration details are at faa.gov/uas, and applicator licensing requirements and fees vary by state — check your state Department of Agriculture directly.
Two figures in this space are not currently published anywhere in accessible form: independent manufacturer-level drone reliability data, and county-level (versus state-level) drone adoption rates. If you need either for a specific purchasing decision or regional analysis, the closest available substitutes are state extension demonstration events for reliability comparisons, and state-level USDA NASS QuickStats aggregates for geographic adoption patterns.
Frequently Asked Questions
How big is the US precision farming market?
$10.54 billion, according to Mordor Intelligence’s North America precision agriculture market analysis, growing at a 12.5% compound annual rate per MarketsandMarkets’ consensus figures.
What percentage of US farms use precision agriculture?
27% of all US farms, per the USDA Economic Research Service’s 2023 Technology Use Survey. Among large-scale crop farms with more than $1 million in annual income, adoption is 68%.
How many US farms use spraying drones?
12% of large-scale crop farms had adopted drones as of the USDA ERS 2023 survey — far below the 68% overall precision-ag adoption rate for that same group. An estimated 38,000 spray drones are active across roughly 7.2 million acres of US farmland, per Agricultural Drone Directory’s 2026 market consensus.
How much does a precision spraying drone cost?
A DJI Agras T40 lists at $19,999. A fully equipped ownership setup — batteries, charging, training, insurance — runs $30,000 to $40,000. Hiring a certified UAS pilot instead costs an average $162 per hour.
What is the fastest-growing precision agriculture segment?
Crop spraying drones, at a projected 32.7% compound annual growth rate from 2026 to 2030 per Research and Markets — well above the 12.5% CAGR of the broader precision farming market.
How does Farmonaut help US farmers?
Farmonaut provides satellite-based crop health monitoring, weather insight, AI advisory, fleet and resource management, carbon footprint tracking, and blockchain traceability via Android, iOS, web, and API.
How do I get started with Farmonaut?
Download the Farmonaut app or use the web platform. Developers can integrate via the API. Try Farmonaut Now.
Further reading:
- arable land
Conclusion
The US precision farming market’s $10.54 billion size and 12.5% growth rate mask a wide gap between adoption on large farms (68%) and the national average (27%), and an even wider one between overall precision-ag adoption and drone-specific adoption (12% on the same large farms). Spraying drones are growing faster than any other segment tracked here — 32.7% annually versus 12.5% for the market overall — but remain the least-adopted category, which is exactly the combination that makes this a segment worth tracking rather than assuming. Whatever the current figures are, check USDA NASS QuickStats and the market research sources linked above before acting on last year’s numbers.
Farmonaut’s satellite monitoring, advisory, fleet, carbon, and traceability tools sit underneath these decisions, whether the equipment on the other end is a guidance-equipped tractor or a spray drone.
Get started today — empower your farm’s digital transformation with Farmonaut.
Discussion
Questions, corrections or field experience? Share them below. First-time comments are reviewed before they appear, and your email is never published.
No comments yet. Be the first to add a question or your experience.

 Liquify Digital
 Ascentya
 CU Foods
 BeyondTech Global
 Rouge VC
 Yutz Automation
 AgroGreen Dynamics
 AgroRisk
 Oath Inc
 Reddane Farming
 Esri North East Africa
 Cresol
 Atur Kuliner
 MDCV UK
 Zerella Group
 Etech Consulting Madagascar
 Vestlandsforsking
 Delicio
 WB Dev
 Sama Premium
 Prochecker
 Tres Valles
 LACOS Geoinformation
 Magrifly
 Exploration consultancy · South Africa · Gold
 Licence holder · Niger · Gold










