

Reviewed August 2026 against USDA NASS, USDA Census of Agriculture data cited via DTN Progressive Farmer, and the Agricultural Drone Directory.
Try it: Run your own numbers →
Agricultural drone mapping uses unmanned aircraft carrying multispectral, thermal, or LiDAR sensors to photograph fields and turn the imagery into maps of crop stress, soil variability, and elevation. In the United States, 1,710 operators held FAA Part 137 certification for agricultural unmanned aircraft as of September 2025, and drone-treated acreage reached 16.4 million acres in 2025 — up 58.7% from the year before, according to the Agricultural Drone Directory’s 2026 statistics guide. This article covers what the technology actually costs, who is using it, how it compares to satellite monitoring, and how to estimate a mapping budget for your own acreage.



Understanding Drone Agriculture Mapping
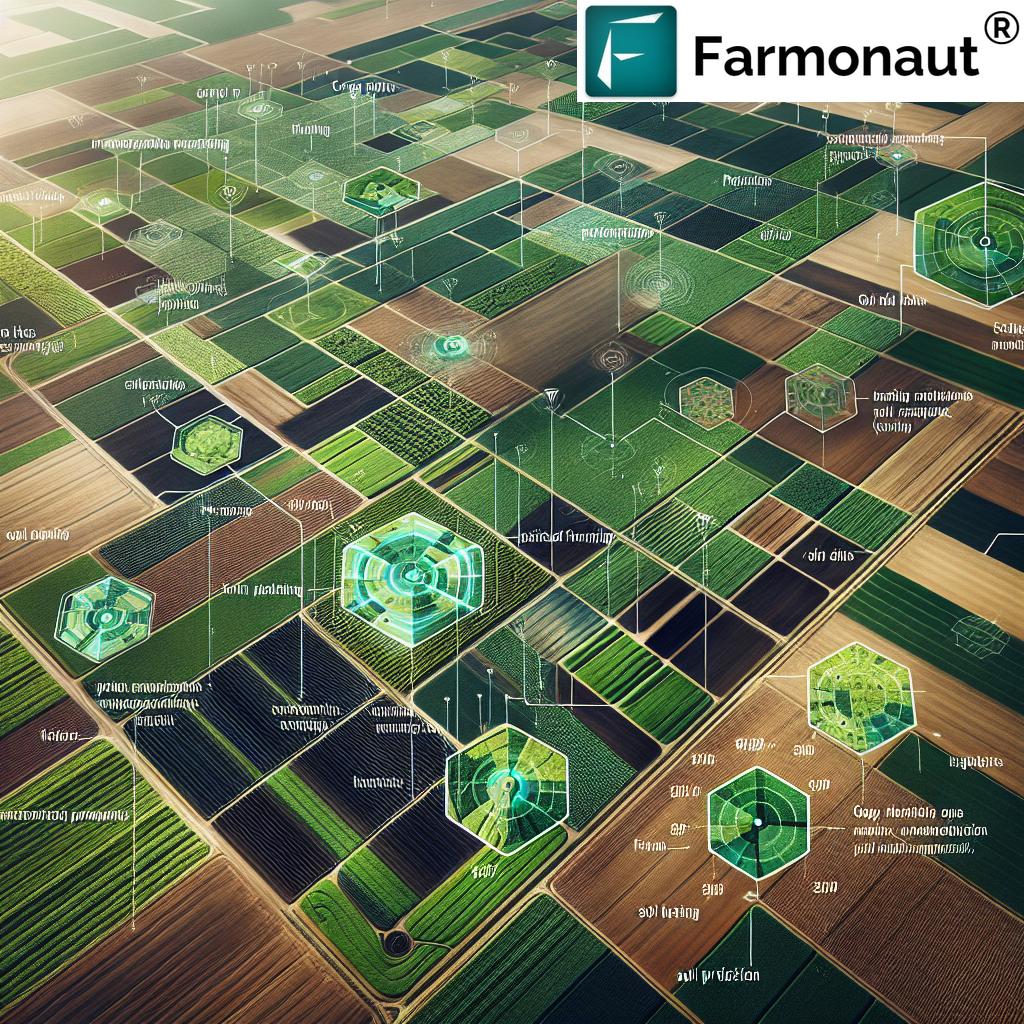
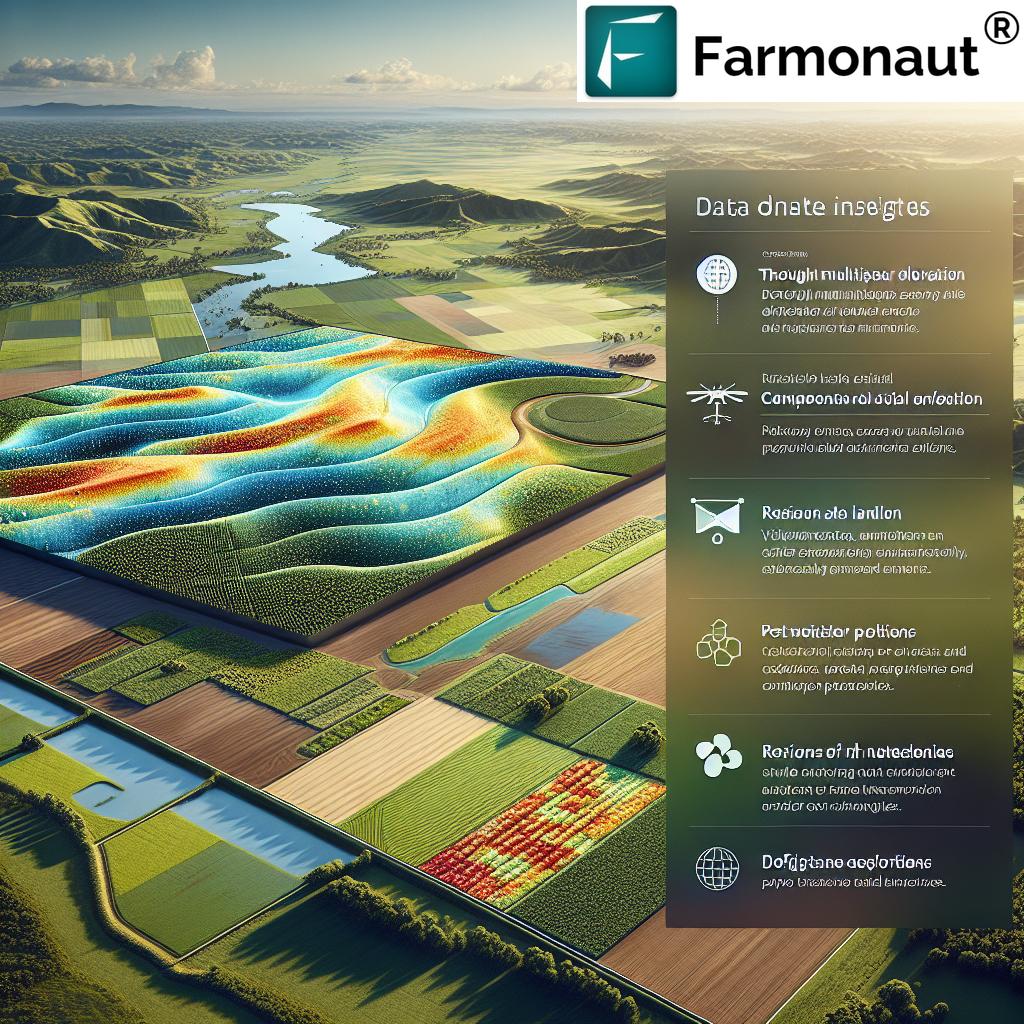
Drone agriculture mapping is the structured use of unmanned aerial vehicles to capture high-resolution imagery and sensor data across a field, then process that imagery into maps a farm manager can act on. A typical flight collects RGB, multispectral, or thermal imagery; software stitches the individual frames into a single orthomosaic; and analysis layers — NDVI, elevation, thermal stress — get exported as maps or prescription files.
The point of the exercise is not the map itself but the decision it enables: where to vary a fertilizer rate, which zone needs an irrigation check, or which block should be scouted first for pests. Farm mapping drones deliver that at a field-wide scale that ground scouting cannot match in the same time window.
- Data Collection: Drones fly a pre-programmed grid pattern, capturing overlapping images and sensor readings across the designated acreage.
- Data Processing: Images are stitched into orthomosaics and analyzed for crop health, soil moisture signatures, topography, and pest-pressure zones.
- Decision Output: Maps and reports drive irrigation scheduling, fertilizer rate changes, pest-control timing, and harvest sequencing.
The Role of Drone Mapping in Modern Field Operations
Agricultural drone technology extends precision farming below the resolution most satellites can offer. A drone flying at 200–400 feet resolves individual plant rows; it can flag a leak in a center-pivot span or a nutrient-deficient patch a few meters across — detail that supports site-specific, rather than field-average, management decisions.
Drone mapping in agriculture lets farm owners, managers, and agronomists replace field-average guesswork with zone-specific evidence. That shift is measurable: USDA’s Agricultural Resource Management Survey found aerial imagery was used on 7.0% of corn acres in 2016 and 9.8% of soybean acres in 2018, per the USDA Economic Research Service. Those figures cover all aerial imagery sources, not drones alone.
Key Technologies in Drone Mapping for Agriculture
Drone mapping for agriculture relies on a small set of sensor types, each suited to a different question. Here is what each one actually measures and where it earns its cost.
1. Multispectral Imaging
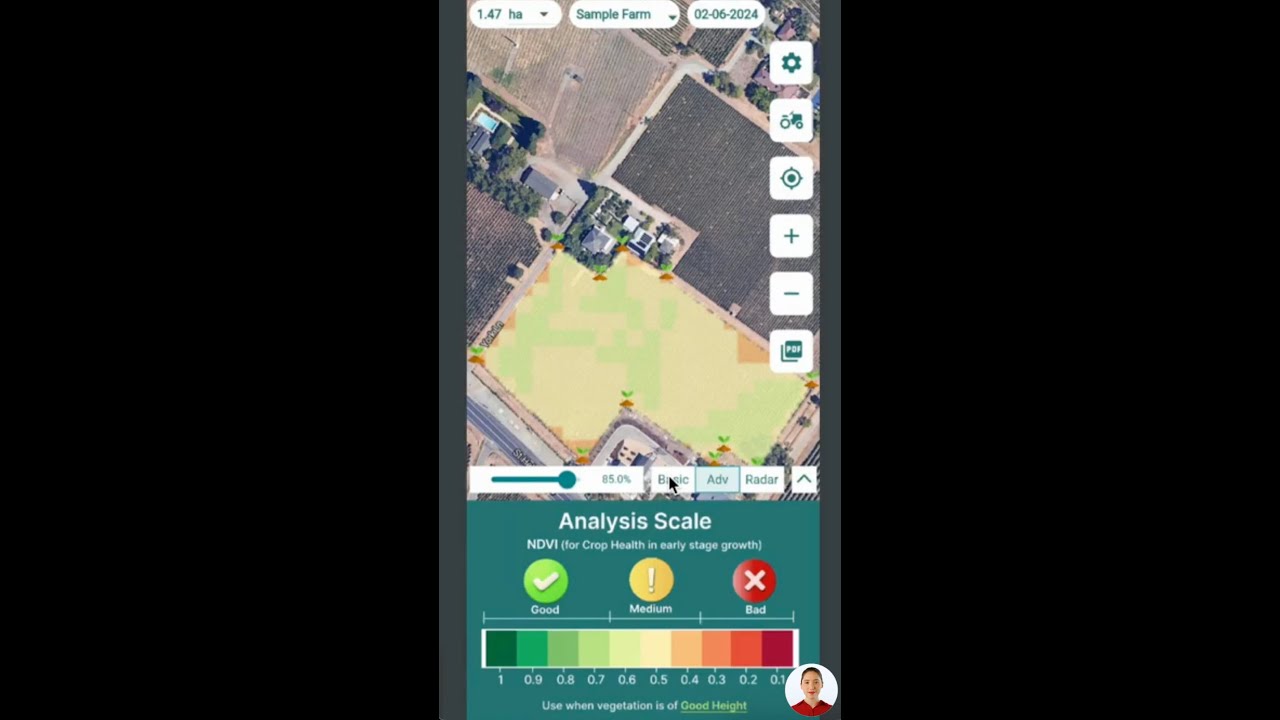
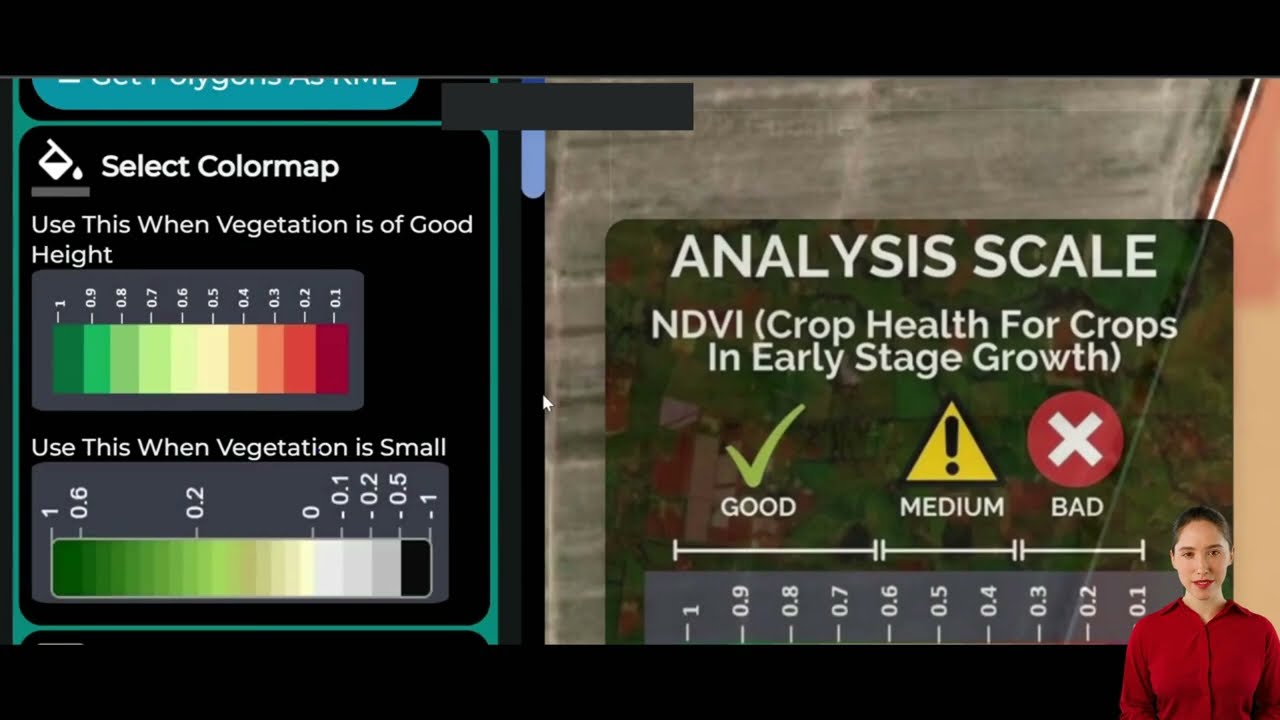
Multispectral sensors capture reflectance across visible, red-edge, and near-infrared wavelengths. Vegetation reflects near-infrared light differently depending on chlorophyll content and cell structure, so multispectral imagery reveals crop stress before it is visible to the eye.
- Output: NDVI (Normalized Difference Vegetation Index) and related vegetation-index maps that highlight vigor and weakness across a field.
- Use case: Early flagging of nutrient deficiency, water stress, or early-stage disease before yield impact is locked in.
2. LiDAR Mapping for Farms
LiDAR sensors emit laser pulses and time their return to build a 3D point cloud of the field surface. The result is a topography and canopy-height model accurate enough for drainage and land-leveling work.
- Output: Elevation models, drainage-flow paths, canopy height layers for orchards and tree crops.
- Use case: Grading and drainage planning on row-crop ground; canopy volume estimation in orchards and vineyards.
3. Thermal Imaging
Thermal cameras detect surface temperature. Plants under water stress close their stomata and warm up measurably before visible wilting appears, which makes thermal imagery an early-warning layer for irrigation problems.
- Output: Canopy-temperature maps that isolate water-stressed zones and malfunctioning irrigation equipment.
- Use case: Center-pivot and drip-line troubleshooting; irrigation scheduling by zone rather than whole-field.
4. AI-Based Data Processing
Raw imagery is only useful once it is processed. Machine-learning models trained on labeled imagery can flag pest damage, classify weed pressure, and forecast yield from multi-date flight series faster than manual GIS review.
- Output: Automated anomaly flags, yield-forecast layers, pest and weed classification maps.
- Use case: Turning a season’s worth of flights into a single trend line instead of a stack of separate images.
5. Integration with Farm Management Platforms
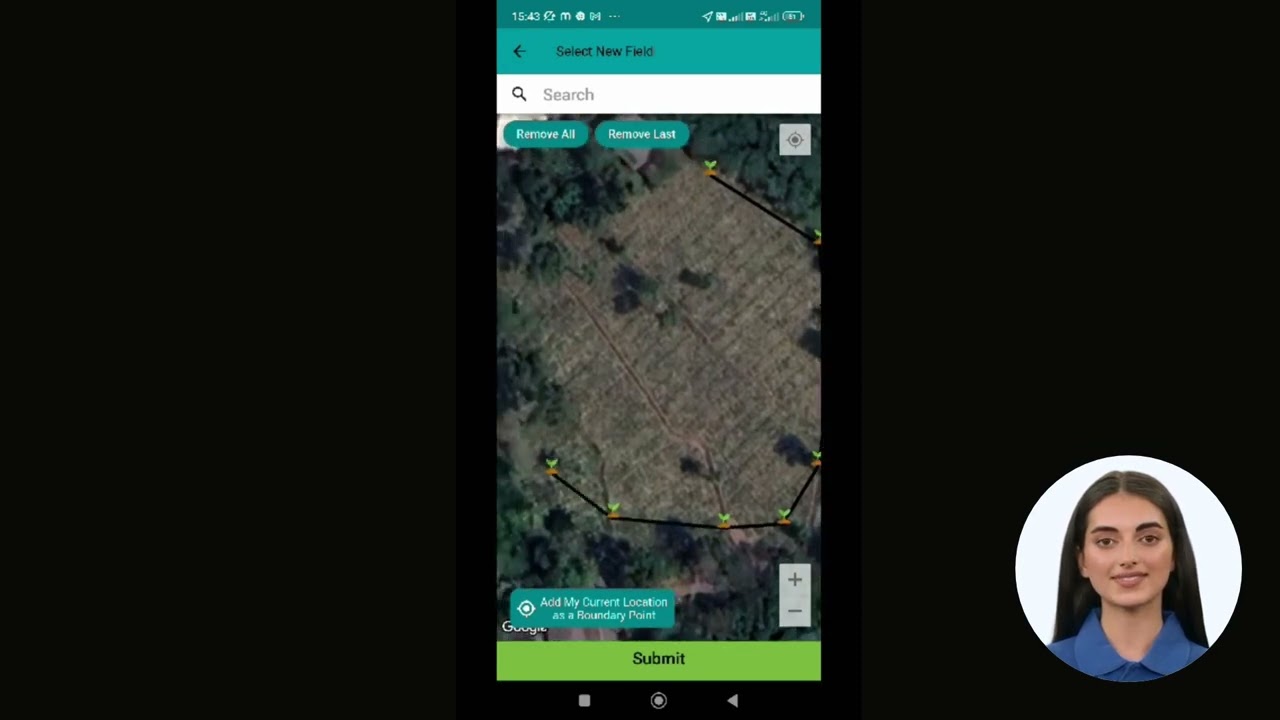
Drone-collected data becomes actionable once it sits alongside other field records inside a management platform such as Farmonaut, where it can be layered against satellite history, weather, and input logs.
To see how satellite and weather data feed the same kind of workflow, review Farmonaut’s Satellite and Weather Data API and the API Developer Docs.
How to Plan a Drone Mapping Flight Over a Field
A usable farm map depends more on the flight plan than on the drone. These are the steps most operators follow.
- Decide what the map is for. An RGB camera is enough for stand counts, drainage and field boundaries. Crop stress and NDVI maps need a multispectral sensor. The DJI Mavic 3 Multispectral, a common farm model, pairs a 20 MP RGB camera with four 5 MP cameras for green, red, red-edge and near-infrared bands (DJI).
- Check the rules. In the US, commercial mapping flights fall under FAA Part 107: the pilot needs a remote pilot certificate, and the drone normally stays below 400 feet and within visual line of sight (FAA).
- Set the overlap. Crop canopy looks the same from frame to frame, so stitching needs more overlap than a building survey. Pix4D recommends at least 80% front and side overlap over flat farm fields (Pix4D), and 85% front with 70–80% side overlap for its PIX4Dfields software (Pix4D).
- Fly in steady light. Clouds passing over the field change reflectance between images. Calibrate multispectral sensors with a reflectance panel or the drone’s sunlight sensor before each flight.
- Process and check. Stitch the images into an orthomosaic, build the index map, then walk the flagged zones. A map tells you where to look; a field visit tells you why.
Repeat the flight at the same height and overlap through the season so maps from different dates can be compared.
Adoption Numbers: Who Is Actually Using This
Adoption figures for drone agriculture mapping are scattered across a few sources that measure different things, so it is worth being precise about what each one covers.
- 1,710 FAA-certificated Part 137 unmanned aircraft operators were active as of September 2025, per the Agricultural Drone Directory, citing FAA data and the American Spray Drone Coalition‘s 2025 survey. Part 137 certification covers agricultural aircraft operations, including spraying and, in many operations, mapping flights flown by the same aircraft.
- 16.4 million acres were treated by agricultural spray drones in the US in 2025, up 58.7% from 2024, according to the same source. This measures spraying, the most common commercial drone application in US row-crop agriculture — it is not a direct count of mapping-only acreage, since federal agencies do not publish that figure separately.
- 22% of Iowa farmers surveyed in the 2025 Iowa Farm and Rural Life Poll used a drone or a drone service provider, per Iowa State University Extension. That is a state-level figure, not a national one.
- 27% of US farms or ranches used some form of precision agriculture practice in 2023, according to USDA data reported by DTN Progressive Farmer. This is a broad precision-ag figure covering GPS guidance, variable-rate application, and yield mapping generally, not drones specifically.
- Aerial imagery (drone, manned aircraft or satellite) was used on 7.0% of US corn acres in 2016 and 9.8% of soybean acres in 2018, per USDA ERS survey data.
The gap between these numbers is itself informative: broad precision-ag adoption (27%) is well ahead of aerial-imagery-specific adoption (7–10% by crop in the last full Census window), which suggests most precision-ag adopters are using GPS guidance and variable-rate equipment rather than aerial mapping. The ERS figures come from the Agricultural Resource Management Survey, which covers different crops in different years, so check USDA ERS for newer crop-level releases.
7 Ways Drone Mapping in Agriculture Improves Farm Outcomes
These are the seven applications where drone-collected data most directly changes a farm decision, each with the technology behind it and where it fits.
1. Crop Health Monitoring
- What it is: Routine flights capturing multispectral and RGB imagery to assess crop vigor across a field.
- Technology: Multispectral imaging combined with AI-based analytics.
- Value: Earlier identification of nutrient deficiency, pest pressure, and disease than ground scouting alone typically catches, enabling targeted rather than blanket intervention.
- Example: NDVI maps flag stress zones — usually rendered as yellow or red patches — for follow-up scouting.
2. Irrigation Management
- What it is: Thermal mapping flights identify water-stressed zones by canopy temperature.
- Technology: Thermal cameras, often paired with ground soil-moisture sensors.
- Value: Zone-specific irrigation scheduling instead of whole-field timing, reducing both water waste and drought stress.
3. Field Mapping & Planning
- What it is: High-resolution orthomosaic maps of field boundaries, soil variability, and elevation.
- Technology: LiDAR, RGB photography, and photogrammetry software.
- Value: Accurate acreage figures, drainage planning, and a base layer for variable-rate input maps.
- Cost reference: Agricultural drone mapping services that include prescription maps run $5–$15 per acre as of 2026, per multiple service-provider pricing pages tracked by the Agricultural Drone Directory mapping services page.
4. Yield Forecasting
- What it is: Multiple flights across a season, compared over time, to project yield ahead of harvest.
- Technology: Multi-temporal imagery combined with machine-learning trend analysis.
- Value: Better-informed harvest sequencing, grain-marketing timing, and storage planning.
5. Pest and Disease Detection
- What it is: Aerial imagery flags localized pest and disease outbreaks before they spread field-wide.
- Technology: Multispectral and thermal imaging with pattern-recognition software.
- Value: Spot-treatment instead of blanket pesticide application, cutting chemical input volume.
6. Soil Analysis and Input Planning
- What it is: Multispectral, thermal, or LiDAR sensors reveal soil moisture and structural variability across a field.
- Technology: Combined sensor data feeding soil-zone classification algorithms.
- Value: Supports variable-rate fertilizer application keyed to zone-level soil conditions rather than a single field average.
7. Environmental and Carbon Tracking
- What it is: Drone-derived biomass and vegetation-index data feeds into broader sustainability reporting.
- Technology: Aerial imagery and thermal data combined with AI-based analysis.
- Value: Supports carbon footprinting and sustainability reporting and resource stewardship programs that increasingly require documented, field-level evidence.

Comparative Table: 7 Drone Mapping Applications
| Application | Primary Sensor | Typical Output | Best-Suited Crop Types | Flight Frequency |
|---|---|---|---|---|
| Crop Health Monitoring | Multispectral | NDVI stress map | Row crops, orchards | Every 1–2 weeks in-season |
| Irrigation Management | Thermal | Canopy-temperature map | Corn, soybeans, orchards | Weekly during peak water demand |
| Field Mapping & Planning | LiDAR / RGB | Orthomosaic, elevation model | Large farms, plantations | Once per season or on land change |
| Yield Forecasting | Multispectral (multi-date) | Yield-trend layer | All field crops | Monthly through the growing season |
| Pest & Disease Detection | Multispectral / thermal | Anomaly flag map | Vegetables, fruit, cereals | Weekly during risk windows |
| Soil Analysis | LiDAR / multispectral | Soil-zone classification | All soils and climates | Pre-season and post-harvest |
| Environmental Tracking | Aerial imagery + thermal | Biomass and emissions layer | Export crops, corporate farms | Seasonal reporting cycles |
Drone Mapping Cost Calculator
Estimate a season’s drone mapping budget using the $5–$15-per-acre pricing range reported for services that include prescription maps, then compare it against a flat monthly satellite-monitoring subscription.
Run your own numbers
Assumptions: uses the $5–$15-per-acre service pricing range reported by the Agricultural Drone Directory for 2026 mapping services that include prescription maps; excludes hardware ownership costs, data-storage fees, and any per-flight travel charges a service provider may add. Enter your own quoted price and flight count for an accurate estimate.
Explore more precision agriculture solutions:
- Carbon Footprinting: Track and reduce your farm's environmental impact in real time, strengthening sustainability credentials and compliance.
- Product Traceability: Use blockchain-backed tools to give transparency and trust to your supply chain – trace every product's journey from field to consumer.
- Crop Loan & Insurance: Satellite-based verification improves access to agricultural financing and makes claims faster and more reliable for farmers.
- Fleet Management: Optimize your agricultural vehicle usage for greater efficiency and lower operational costs.
- Large-Scale Farm Management: Tools for plantations and cooperatives to manage large land holdings, monitor operations, and control costs.
Economic and Environmental Benefits of Drone Mapping in Agriculture
Drone agriculture mapping pays back through three channels: better input targeting, faster problem detection, and documentation that supports financing and compliance.
- Input targeting: Zone-specific fertilizer, water, and pesticide application reduces the volume applied to already-healthy zones, cutting direct input cost without cutting yield in the zones that need the input.
- Faster detection: A field-wide flight surfaces stress patterns in a single pass, versus a ground walk that samples a fraction of the acreage — meaning problems get caught while they are still small enough to fix cheaply.
- Documentation: Sustained flight and satellite records support carbon and sustainability reporting where buyers or regulators require field-level evidence rather than self-reported estimates.
- Scale: A single operator can cover far more acreage per day by drone than on foot, which is part of why acreage under drone treatment grew 58.7% between 2024 and 2025 even as certified operator counts (1,710 as of September 2025) remain a small fraction of the roughly two million farms in the US.
Challenges & Considerations in Drone Mapping Adoption
The gap between broad precision-ag adoption (27% of US farms in 2023) and aerial-imagery-specific adoption (7.0% of corn acres in 2016 and 9.8% of soybean acres in 2018, per USDA ERS) points to real adoption barriers, not just awareness gaps.
- Upfront and per-acre cost: Owning a mapping-grade drone requires hardware and processing-software investment; contracting a service instead runs $5–$15 per acre for mapping with prescription outputs, per 2026 provider pricing tracked by the Agricultural Drone Directory. Either path is a real line-item, not a rounding error, for smaller operations.
- Training and interpretation: An NDVI map is only useful if someone on the farm can translate a red patch into a specific action. Many operations need either in-house GIS skill or a service provider that includes interpretation in the contract.
- Regulatory compliance: Commercial agricultural drone operation in the US requires FAA certification — Part 137 for application work, Part 107 for most mapping-only flights — plus adherence to local airspace restrictions.
- Privacy considerations: Aerial imagery over adjoining properties can raise privacy questions in rural communities; informing neighbors before flights cross property lines avoids most disputes.
For operations that want field-level insight without owning or contracting drone hardware, satellite-based crop monitoring through services like Farmonaut is a lower-barrier starting point.
Drone Mapping vs. Satellite Monitoring: Choosing a Method
Drones and satellites answer different questions, and the right choice depends on resolution needs and budget, not on which technology is newer.
| Factor | Drone Mapping | Satellite Monitoring |
|---|---|---|
| Ground resolution | Centimeter-level; resolves individual plants | Meter-level; resolves field zones, not individual plants |
| Cost structure | $5–$15 per acre per flight (mapping with prescription maps, 2026 provider pricing) | Flat subscription regardless of flight frequency |
| Weather dependency | Grounded by high wind, rain, or restricted airspace | Optical imagery blocked by cloud cover; unaffected by wind |
| Hardware requirement | Own or contract a drone and FAA-certificated pilot | None — imagery is already collected by orbiting satellites |
| Best fit | High-value crops, small-area precision, irrigation troubleshooting | Whole-farm monitoring across many fields at lower per-field cost |
Many operations use both: satellite monitoring for routine whole-farm surveillance, with a drone flight dispatched to a flagged zone for closer inspection. That combination is the direction the market has been heading in — precision agriculture adoption sits at 27% of US farms overall, per USDA data cited by DTN Progressive Farmer, while drone-specific adoption remains a smaller subset layered on top.
Where This Is Headed
The trajectory in the data is toward faster growth in application-focused drone use than in mapping-only adoption. Spray-drone acreage grew 58.7% year-over-year to 16.4 million acres in 2025, a pace that outstrips the slower climb in aerial-imagery adoption tracked by USDA surveys. Three shifts are visible in the numbers already gathered:
- Consolidation of spraying and mapping in one flight: Many Part 137 operators now offer mapping as a companion service to spraying, since the same aircraft and sensor package can do both.
- State-level adoption outpacing national averages: Iowa's 22% drone use in the 2025 state poll is close to the 27% national figure for all precision practices combined, which suggests drone uptake is uneven by region, crop type and farm size.
- The next data point that matters: USDA ERS updates crop-level technology adoption from its Agricultural Resource Management Survey as each crop comes up in the survey rotation. Readers tracking adoption trends should check USDA ERS for newer releases.
For platform-side developments — sensor packages, software integrations, and mapping-specific product trends — see Farmonaut's UAV agriculture technology overview.
Why Choose Farmonaut for Precision Agriculture?
For operations weighing drone hardware costs against a lower-barrier alternative, Farmonaut offers satellite-based, AI-driven field monitoring accessible via web, Android, and iOS apps, plus a developer API. It does not replace drone mapping's centimeter-level resolution, but it removes the hardware and FAA-certification requirements for routine, whole-farm surveillance.
- Satellite Crop Monitoring: Regular updates on crop health, soil moisture, vegetation indices, and weather conditions across every field in a portfolio.
- AI Advisory (Jeevn AI): Field-specific management recommendations built from the same satellite and weather data streams.
- Blockchain-Enabled Traceability: Supply-chain transparency tools — see Product Traceability.
- Fleet and Resource Management: Vehicle and input-logistics tracking alongside field data.
- Carbon Footprint Tracking: Documentation for sustainability reporting and certification requirements.
- Financing Support: Satellite-verified field data for crop loan and insurance applications.
Get Started with Farmonaut Now!
Drone Agriculture Mapping: Frequently Asked Questions
How does drone mapping differ from traditional crop scouting?
Traditional crop scouting covers a sample of a field on foot. A drone mapping flight covers the entire field in a single pass and produces a georeferenced map, which is why aerial methods surface stress patterns that a ground walk can miss entirely between sample points.
What does agricultural drone mapping cost per acre?
Mapping services that include prescription maps run $5 to $15 per acre as of 2026, according to pricing tracked across multiple service providers by the Agricultural Drone Directory. The exact rate depends on flight frequency, sensor type (multispectral and thermal cost more than RGB-only), and whether prescription-map generation is included or billed separately. Owning a mapping-grade drone instead of contracting a service shifts the cost to a larger upfront hardware and software purchase.
Can small farms benefit from drone or satellite-based mapping?
Yes. Per-acre service pricing means smaller fields can access drone mapping without hardware ownership, and satellite subscription platforms like Farmonaut price by area and update frequency, making routine monitoring accessible below the acreage where owning a drone pays for itself.
Do I need an FAA certification to fly a mapping drone?
Commercial drone operation in the US generally requires FAA Part 107 certification for mapping-only flights, or Part 137 certification for agricultural application work such as spraying. As of September 2025, 1,710 operators held Part 137 certification, per the Agricultural Drone Directory. Check current FAA requirements directly before operating commercially, since certification rules are periodically updated.
Can drone and satellite data be used for crop insurance or loan applications?
Yes. Platforms like Farmonaut provide satellite-based field verification that lenders and insurers can use as supporting documentation, which can speed up claims processing and loan approval compared to unverified self-reported field data.
Conclusion
Drone agriculture mapping has moved from a novelty to a measurable line item in US farm operations: 1,710 certified operators, 16.4 million treated acres in 2025, and $5–$15-per-acre mapping service pricing are concrete enough numbers to budget against, not just marketing claims. The adoption gap between broad precision agriculture (27% of farms) and aerial-imagery-specific use (7–10% of acres by crop in USDA ERS survey data) suggests plenty of room for growth as costs continue to fall and more operators enter the Part 137 pipeline.
Whichever path fits your operation — owning a drone, contracting a mapping service, or starting with satellite-based monitoring — the underlying method stays the same: identify the zones that differ from the field average, verify with a closer look, and act before the difference shows up at harvest. Platforms like Farmonaut offer a lower-barrier entry point into that workflow for operations not ready to invest in drone hardware.

 Agricultural Credit Policy Council
 BayWa
BayWa Azure Clouds
 MCSOD
MCSOD Marei Nursery
 eKGIS
eKGIS Mostas Tech
 Native Seeds
 Andex
Andex FCF India
 Unifrutti Gulf
 Deluxe Conseil
 TVS Electronics
 WICO
WICO Chimera Innovation
 SkyHarvest
