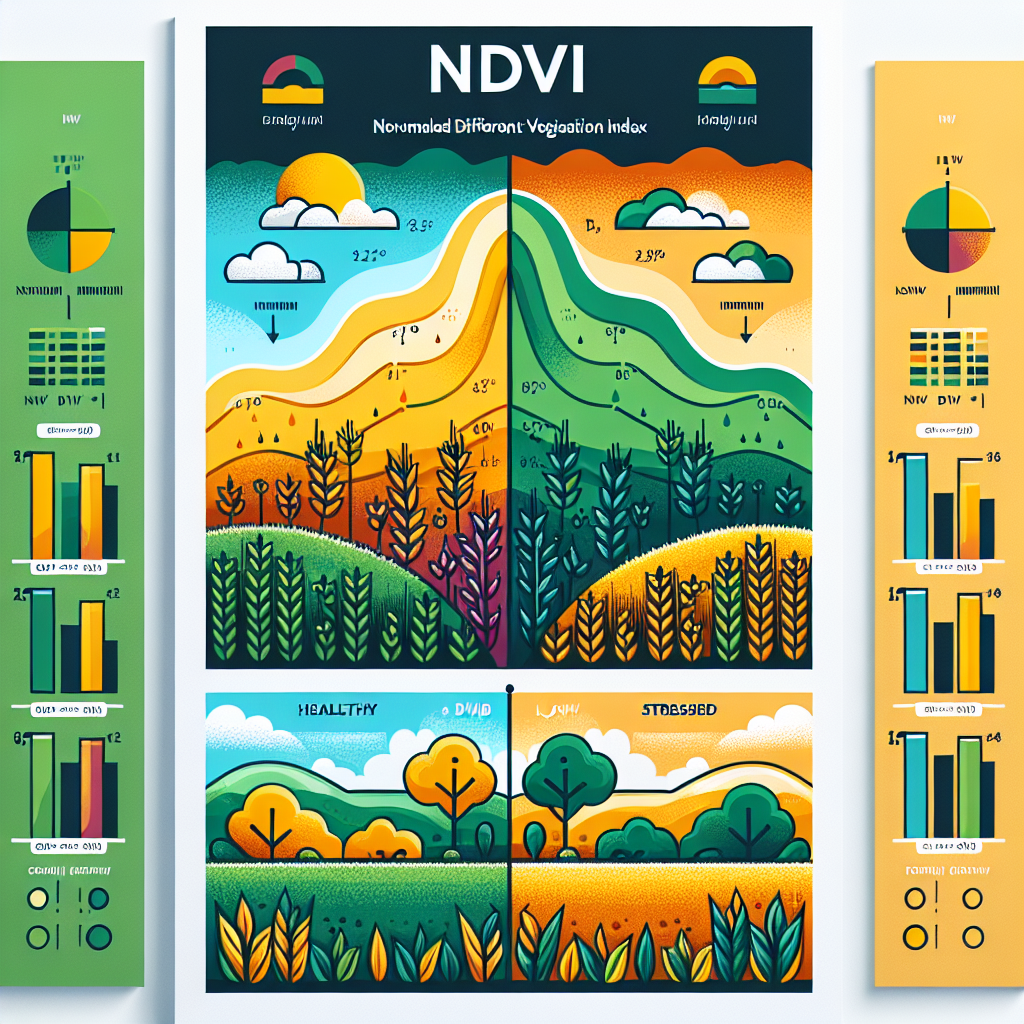
Revolutionizing Crop Health Assessment: Farmonaut Introduces New Vegetation Indices
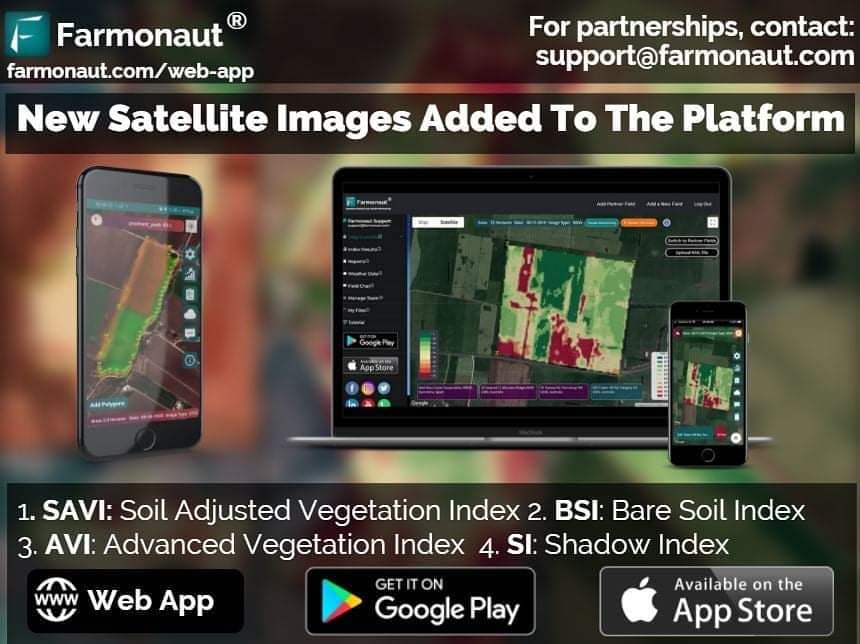
At Farmonaut, we’re constantly striving to improve our satellite-based farm management solutions to empower farmers worldwide. Today, we’re thrilled to announce a significant enhancement to our platform with the introduction of four new vegetation indices: Soil Adjusted Vegetation Index (SAVI), Advanced Vegetation Index (AVI), Bare Soil Index (BSI), and Shadow Index (SI). These powerful tools are now available through our web application and API, marking a major leap forward in precision agriculture technology.
Understanding the Importance of Vegetation Indices
Before we delve into the specifics of our new indices, let’s explore why vegetation indices are crucial for modern agriculture:
- Accurate crop health assessment
- Early detection of stress factors
- Optimization of resource allocation
- Enhanced yield prediction
- Informed decision-making for farmers
Vegetation indices provide valuable insights into plant health, growth, and productivity by analyzing the reflectance of different wavelengths of light from vegetation. However, traditional indices like the Normalized Difference Vegetation Index (NDVI) can sometimes be influenced by soil background, especially in areas with sparse vegetation cover. This is where our new indices come into play, offering more robust and accurate assessments across various agricultural scenarios.
Introducing Farmonaut’s New Vegetation Indices
Let’s take a closer look at each of the new indices we’ve introduced:
1. Soil Adjusted Vegetation Index (SAVI)
SAVI is an enhancement of the widely-used NDVI, designed to minimize soil brightness influences in areas where vegetation cover is low. This makes it particularly useful for:
- Regions with arid or semi-arid climates
- Early growth stages of crops
- Areas with significant soil exposure
The SAVI formula incorporates a soil brightness correction factor, allowing for more accurate vegetation assessment in challenging conditions. This index is especially valuable for farmers dealing with varying soil types or managing crops in their initial growth phases.
2. Advanced Vegetation Index (AVI)
The Advanced Vegetation Index is a sophisticated metric that builds upon the foundations of NDVI and Enhanced Vegetation Index (EVI). AVI offers:
- Improved sensitivity to changes in dense vegetation
- Better performance in areas with high biomass
- Reduced saturation effects commonly seen in NDVI
By incorporating additional spectral bands and atmospheric correction factors, AVI provides a more nuanced view of crop health, especially in regions with lush vegetation or during peak growing seasons.
3. Bare Soil Index (BSI)
The Bare Soil Index is a powerful tool for assessing soil exposure and characteristics. It’s particularly useful for:
- Monitoring soil degradation
- Assessing land use changes
- Planning crop rotation strategies
- Identifying areas prone to erosion
The bare soil index formula combines multiple spectral bands to highlight areas of exposed soil, providing valuable information about field conditions before planting or after harvest. This index helps farmers make informed decisions about soil management and conservation practices.
4. Shadow Index (SI)
The Shadow Index is a unique addition to our suite of tools, offering insights into canopy structure and density. SI is valuable for:
- Assessing crop maturity and growth stage
- Detecting changes in plant architecture
- Estimating biomass in forested areas
- Identifying potential shading issues in orchards or vineyards
By analyzing shadow patterns within vegetation, SI provides a different perspective on crop development and can help in fine-tuning management practices for optimal plant growth.
How These New Indices Enhance Crop Health Assessment
The introduction of these four indices significantly improves our ability to assess crop health accurately across diverse agricultural landscapes. Here’s how:
- Improved Accuracy in Varied Conditions: By accounting for soil influences and atmospheric effects, these indices provide more reliable data in challenging environments.
- Comprehensive Vegetation Analysis: The combination of these indices offers a multi-faceted view of plant health, from soil exposure to canopy structure.
- Enhanced Decision Support: Farmers can make more informed choices about irrigation, fertilization, and pest management based on these detailed insights.
- Better Resource Management: With a clearer understanding of field conditions, farmers can optimize resource allocation, reducing waste and improving sustainability.
- Early Problem Detection: These indices can help identify issues like nutrient deficiencies or pest infestations earlier, allowing for timely interventions.
Integrating New Indices into Farmonaut’s Platform
We’ve seamlessly integrated these new indices into our existing platform, ensuring that our users can easily access and utilize this valuable data. Here’s how you can leverage these new tools:
Web Application
Our web application now includes dedicated sections for each new index. Users can:
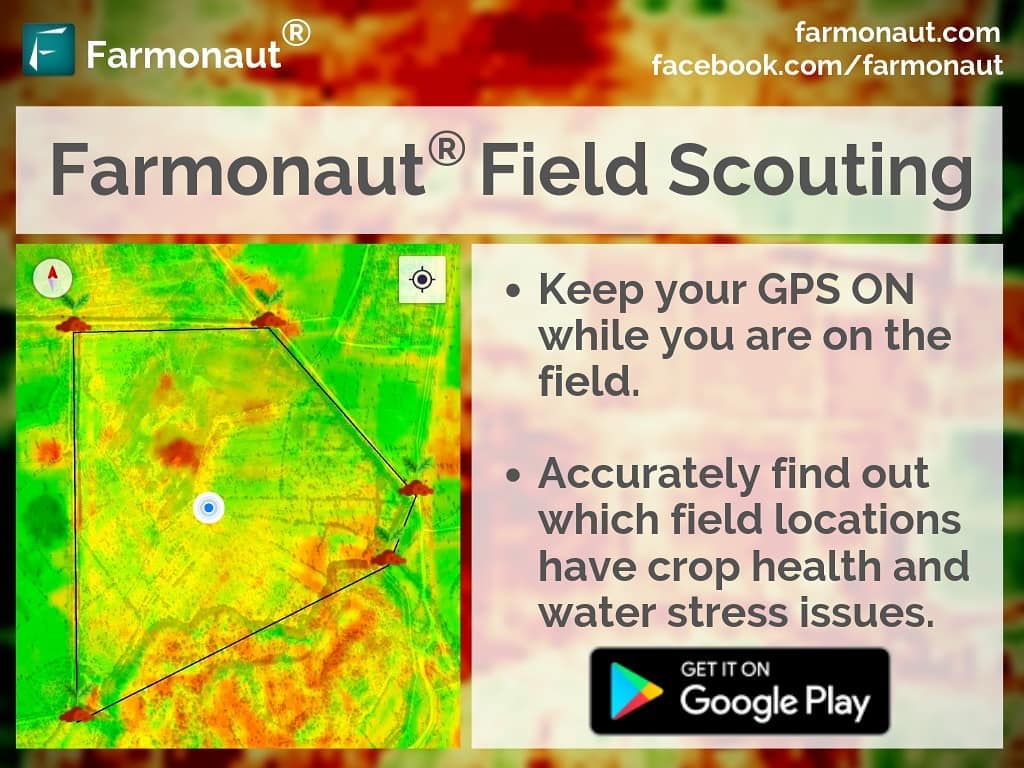
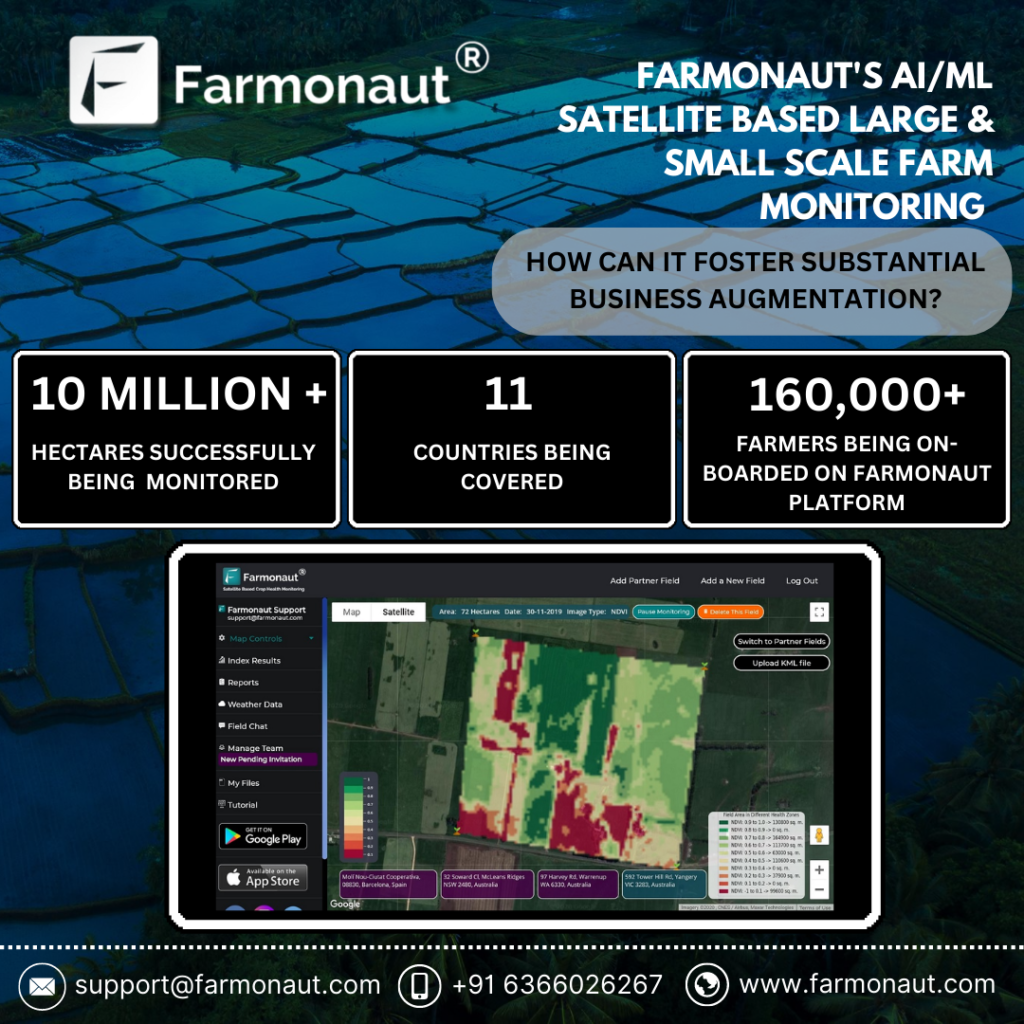
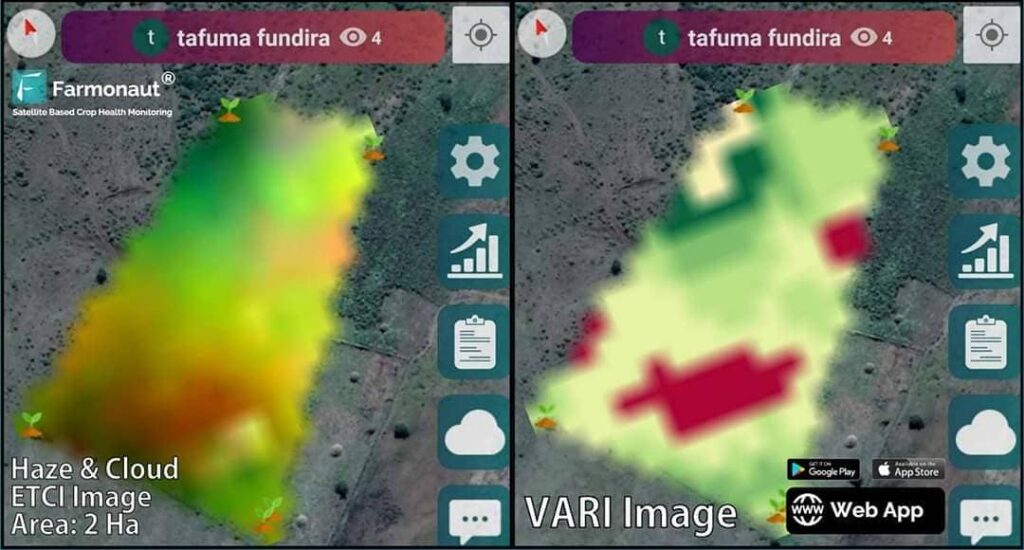
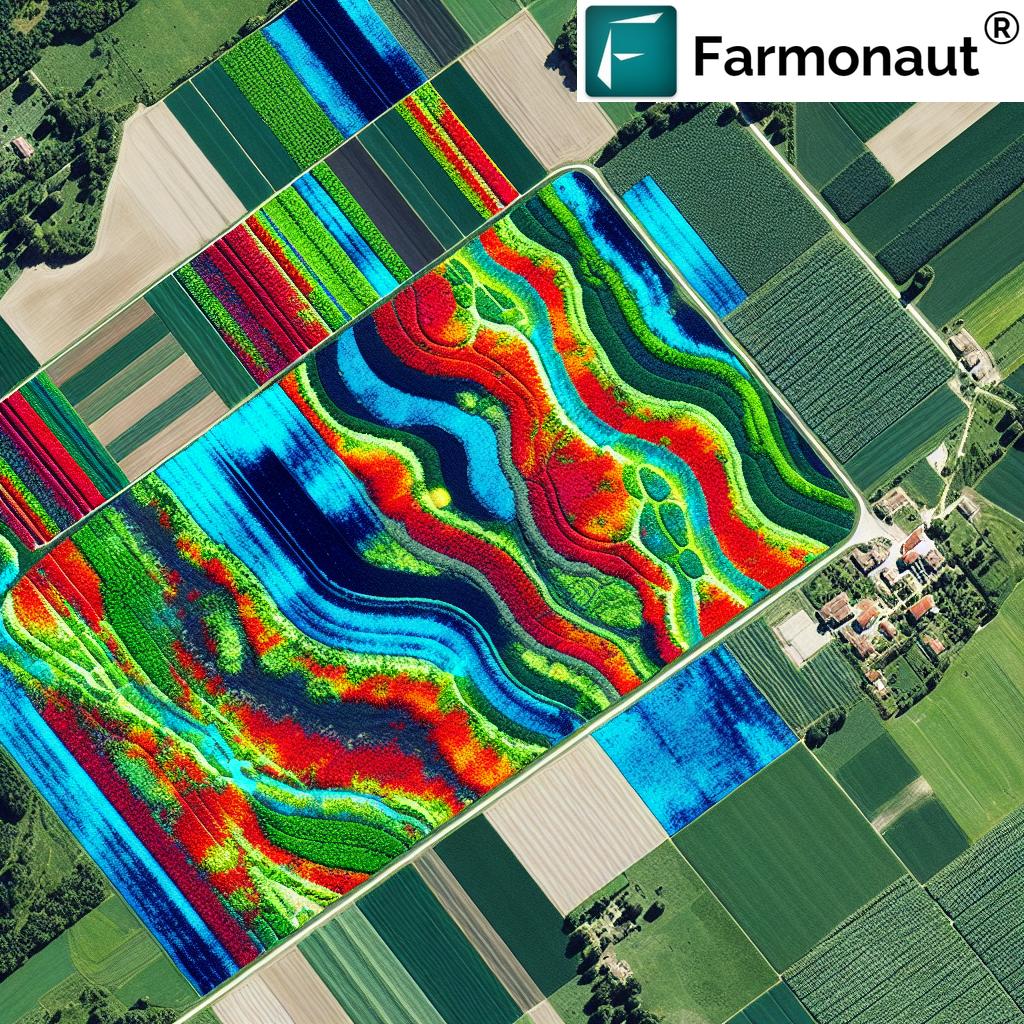
- View color-coded maps highlighting index values across their fields
- Compare different indices side-by-side for comprehensive analysis
- Track index changes over time to monitor crop development
- Generate reports and insights based on index data
To access these features, simply log in to your Farmonaut account at https://farmonaut.com/app_redirect and navigate to the “Vegetation Indices” section.
API Integration
For developers and businesses looking to integrate these new indices into their own applications, we’ve updated our API to include endpoints for SAVI, AVI, BSI, and SI. This allows for seamless incorporation of advanced vegetation analysis into custom agricultural solutions.
Detailed documentation on how to access and utilize these new indices through our API can be found at https://farmonaut.com/farmonaut-satellite-weather-api-developer-docs/.
Real-World Applications and Benefits
The introduction of these new indices opens up a world of possibilities for farmers and agricultural professionals. Let’s explore some real-world applications and benefits:
1. Precision Irrigation Management
By combining SAVI and BSI data, farmers can:
- Identify areas of water stress more accurately
- Optimize irrigation schedules based on soil moisture and vegetation health
- Reduce water waste and improve water use efficiency
2. Tailored Fertilizer Application
Using AVI and SAVI insights, farmers can:
- Detect nutrient deficiencies early
- Apply fertilizers more precisely based on plant needs
- Minimize over-application, reducing costs and environmental impact
3. Crop Yield Estimation
Combining multiple indices allows for:
- More accurate yield predictions
- Better planning for harvest and storage
- Improved financial forecasting for farm operations
4. Soil Health Monitoring
BSI and SAVI provide valuable data for:
- Tracking changes in soil organic matter
- Identifying areas prone to erosion
- Planning targeted soil conservation measures
5. Crop-Specific Management
Different crops benefit from specific index combinations:
- Cereal crops: SAVI and AVI for growth stage monitoring
- Orchards: SI for canopy management and pruning decisions
- Row crops: BSI for inter-row cultivation planning
Farmonaut’s Comprehensive Approach to Farm Management
While these new indices significantly enhance our crop health assessment capabilities, they are just one part of Farmonaut’s holistic approach to farm management. Our platform integrates various technologies to provide a comprehensive solution:
- Satellite Imagery: Regular, high-resolution imagery for consistent monitoring
- Artificial Intelligence: Advanced algorithms for data analysis and insights generation
- Weather Forecasting: Localized weather predictions for informed decision-making
- Crop Advisory: Personalized recommendations based on crop type and local conditions
- Mobile App: On-the-go access to critical farm data and alerts
Our mobile app is available for both Android and iOS devices:
- Android: Download from Google Play Store
- iOS: Download from App Store
Farmonaut vs. Traditional Monitoring Methods
To illustrate the advantages of Farmonaut’s satellite-based system over traditional monitoring methods, let’s compare it with drone and IoT-based solutions:
| Feature | Farmonaut Satellite System | Drone-based Monitoring | IoT-based Monitoring |
|---|---|---|---|
| Coverage Area | Large scale (100s to 1000s of hectares) | Limited (10s of hectares per flight) | Limited to sensor placement |
| Frequency of Data Collection | Regular (every 3-5 days) | As needed, weather-dependent | Continuous |
| Initial Setup Cost | Low | High (equipment purchase) | Medium to High (sensors and network) |
| Operational Complexity | Low (automated) | High (requires skilled operator) | Medium (maintenance required) |
| Data Analysis | Advanced AI-powered insights | Varies based on software | Limited to sensor capabilities |
| Scalability | Highly scalable | Limited by equipment and personnel | Requires additional sensor deployment |
Future Developments and Research
At Farmonaut, we’re committed to continuous innovation. The introduction of these new indices is just the beginning. Our research and development team is working on:
- Integration of hyperspectral data for even more detailed crop analysis
- Machine learning models for crop-specific index optimization
- Fusion of satellite data with ground-based sensors for enhanced accuracy
- Development of new indices for specialized crops and unique environmental conditions
We’re also collaborating with agricultural research institutions to validate and refine our indices, ensuring that we provide the most accurate and valuable insights to our users.
Getting Started with Farmonaut’s New Indices
Ready to experience the power of our new vegetation indices? Here’s how you can get started:
- If you’re an existing user, simply log in to your account and explore the new features.
- New users can sign up for a free trial at https://farmonaut.com/app_redirect.
- For API access, visit our developer documentation at https://sat.farmonaut.com/api.
- Download our mobile app for on-the-go access to these powerful tools.
Conclusion
The introduction of SAVI, AVI, BSI, and SI marks a significant milestone in Farmonaut’s mission to democratize precision agriculture. By providing farmers with these advanced tools, we’re enabling more accurate crop health assessments, better resource management, and ultimately, improved agricultural productivity and sustainability.
As we continue to innovate and expand our capabilities, we remain committed to our core values of accessibility, affordability, and empowerment for farmers worldwide. The future of agriculture is data-driven, and with Farmonaut’s comprehensive suite of tools, farmers are well-equipped to face the challenges of modern farming while maximizing their yields and profitability.
Join us in revolutionizing agriculture, one field at a time. Together, we can build a more sustainable and productive future for farming.
Frequently Asked Questions (FAQ)
- Q: What is the difference between NDVI and SAVI?
A: While both are vegetation indices, SAVI (Soil Adjusted Vegetation Index) is designed to minimize soil brightness influences, making it more accurate in areas with low vegetation cover or exposed soil. - Q: How often is satellite data updated in Farmonaut’s system?
A: Our satellite data is typically updated every 3-5 days, depending on the specific location and satellite coverage. - Q: Can Farmonaut’s new indices be used for all types of crops?
A: Yes, these indices are applicable to a wide range of crops. However, their effectiveness may vary depending on the crop type and growth stage. - Q: Is special equipment required to use Farmonaut’s vegetation indices?
A: No, our satellite-based system doesn’t require any special on-farm equipment. All you need is access to our web platform or mobile app. - Q: How accurate are these new indices compared to ground-based measurements?
A: Our indices show high correlation with ground-based measurements. However, for maximum accuracy, we recommend combining satellite data with periodic ground truthing. - Q: Can Farmonaut’s system detect specific diseases or pests?
A: While our system can detect anomalies in crop health that may indicate disease or pest presence, specific identification often requires on-ground verification. - Q: How does weather affect the accuracy of these indices?
A: Cloud cover can impact satellite image quality. However, our system uses advanced algorithms to minimize these effects and provide consistent data. - Q: Is training required to interpret the new indices?
A: While our platform provides user-friendly visualizations, we offer training resources and support to help users maximize the value of these new tools. - Q: Can these indices be used for precision agriculture applications like variable rate fertilization?
A: Absolutely! Our indices provide valuable data for creating prescription maps for variable rate applications of fertilizers, pesticides, and irrigation. - Q: How does Farmonaut ensure data privacy and security?
A: We employ industry-standard encryption and security protocols to protect all user data. Your farm information is kept strictly confidential and is never shared without your explicit permission.
Have more questions? Don’t hesitate to reach out to our support team. We’re here to help you make the most of Farmonaut’s powerful farm management tools!


