

Michigan · Farm jobs and crop data
Agricultural Employment Share in Michigan: 1% to 17%
Farm jobs were about 1% of Michigan jobs around 2023 (BEA), while MDARD puts the whole food and agriculture system at about 17% of state employment. This page explains the gap, compares nearby states and ranks Michigan’s top products.
Key takeaways
- BEA counted 61,897 Michigan farm jobs in 2022, about 1.1% of all jobs that year.
- MDARD says the food and agriculture system accounts for about 805,000 jobs, or about 17% of state employment.
- Michigan’s farm job share in 2022 was below Iowa, Wisconsin, Minnesota and Indiana, and above Illinois, Pennsylvania and New York.
- USDA’s bulletin lists 27 products where Michigan ranked in the national top 10 in 2023, with five first places including tart cherries, asparagus and squash.
- Dairy, corn and soybeans led the $11.29 billion in 2023 farm cash receipts (USDA ERS).
In this article
- Agricultural employment share in Michigan: the short answer
- Why 1% and 17% are both correct
- Michigan farm jobs compared with other states
- How Michigan farm jobs have changed
- Work out the agricultural employment share for your county
- Michigan agriculture statistics at a glance
- Top crops in Michigan: a closer look
- Michigan agricultural commodities beyond the top three
- Michigan fruit and vegetable production
- Michigan maple syrup
- Crop monitoring technology on Michigan farms
- Sustainability in Michigan agriculture
- The economic impact of Michigan agriculture
- Challenges and opportunities for Michigan agriculture
The agricultural employment share in Michigan for 2023 depends on what you count. Farm jobs alone were about 1% of the state’s jobs, while the wider food and agriculture system accounts for about 17% of state employment, according to the Michigan Department of Agriculture and Rural Development (MDARD). Both numbers are right. They measure different things.
This page shows where each figure comes from, how Michigan compares with nearby states and how farm jobs have moved since 2001. It also has a calculator for your own county, and a ranked table of the 27 products that put Michigan in the national top 10.
Agricultural employment share in Michigan: the short answer
Three measures answer the question. Each one suits a different purpose, so check which one a report is using before you quote it.
| Measure | Jobs | Share | Source and year |
|---|---|---|---|
| Farm jobs | 61,897 | About 1.1% | BEA, 2022 |
| Farm, forestry, fishing | 80,126 | About 1.4% | BEA, 2022 |
| Food and agriculture system | About 805,000 | About 17% | MDARD, undated on its page |
The narrow figures come from the Bureau of Economic Analysis county and state employment table. That file shows 61,897 farm jobs and 5,864,009 total jobs in Michigan in 2022. It also shows 18,229 jobs in forestry, fishing and related activities. Farm jobs here include 38,801 farm proprietors, so owner-operators count as well as hired staff.
For 2023 itself, BEA’s state income tables put total Michigan employment at 5,877,978 jobs. The employment-by-industry file used here ends at 2022. If farm jobs held near the 2022 level, the 2023 farm share is still about 1.05%. The two BEA files are different vintages (the newer one revises 2022 total jobs to 5,810,773). That is our arithmetic, so treat it as an estimate and not a published BEA figure.
Why 1% and 17% are both correct
The gap comes from what each source counts. BEA counts jobs on farms. MDARD says the 805,000 figure is total employment resulting from the food and agriculture system, which is a much wider group than people who work on farms.
Chart
Three ways to measure Michigan’s agricultural jobs
Share of state employment, percent; each source uses its own scope
The denominators may differ as well. MDARD’s page does not state its base. Dividing 805,000 by 17% implies a base of about 4.7 million jobs. Set against BEA’s 5.88 million jobs for 2023, the same 805,000 would be about 13.7%. That second number is our calculation, and it mixes two sources, so use it only as a rough check.
A simple rule helps:
- Writing about farm labor or farm households: use the BEA farm job share of about 1%.
- Writing about the food economy as a whole: use MDARD’s figure of about 17%, and name MDARD.
- Comparing states: use BEA, since every state is counted the same way.
Earnings tell a similar story to farm jobs. The BEA state earnings table shows Michigan farm earnings of about $2.70 billion in 2023, against about $400.5 billion in nonfarm earnings. That puts farms at about 0.7% of earnings. Farm earnings swing widely: they were about $1.63 billion in 2024 and about $3.17 billion in 2025.
Michigan farm jobs compared with other states
Using the same BEA table for 2022, Michigan’s farm job share sits above Illinois, Pennsylvania and New York, close to Ohio, and below Indiana, Minnesota, Wisconsin and Iowa. Michigan has more farm jobs than Indiana (61,897 against 57,327) but a much larger total workforce, which pulls its share down.
Chart
Farm jobs as a share of all jobs, selected states
Percent of total employment, 2022
How Michigan farm jobs have changed
BEA counted 73,091 farm jobs in Michigan in 2001 and 61,897 in 2022, a fall of about 15%. The path was not smooth. It topped 70,000 in 2007 and 2011, stood at 69,267 in 2015, and fell to 60,119 in 2021.
Chart
Michigan farm jobs, selected years
Number of jobs including proprietors, 2001 to 2022; years are not evenly spaced
The national picture gives some context. USDA’s Economic Research Service reports that self-employed and family farmworkers fell from 7.60 million in 1950 to 2.06 million in 2000, and hired farmworkers fell from 2.33 million to 1.13 million. It says employment levels have stabilized since 1990.
Farm numbers point the same way. MDARD cites roughly 47,600 farms in Michigan, in line with the 47,641 counted in the 2017 census, while USDA’s 2025 state overview lists 43,800 operations on 9.4 million acres, an average of 215 acres. Across the US, USDA counted 1.88 million farms in 2024, down 8% from the 2017 census.
Work out the agricultural employment share for your county
State averages hide a lot. A rural county in the Thumb will look very different from Wayne County. To get a local share, pull farm jobs and total jobs for your county from the BEA file linked above, add any related jobs you want to count, and enter them below.
Try the numbers for your own farm below.
Michigan agriculture statistics at a glance
The Michigan Annual Statistical Bulletin 2023-2024, from USDA’s National Agricultural Statistics Service, is the source for the rankings below. Its ranking table lists 27 products where Michigan placed in the national top 10 in 2023, not counting floriculture, which has its own table.
| Rank in 2023 | Products |
|---|---|
| 1st | Asparagus, tart cherries, squash, black beans, small red beans |
| 2nd | Apples, cucumbers, all dry beans, navy beans, cranberry beans, light red kidney beans |
| 3rd | Alfalfa haylage and greenchop |
| 4th | Blueberries, snap beans, sugarbeets |
| 5th | Bell peppers, maple syrup |
| 6th | Cabbage, milk, peaches, potatoes, pumpkins |
| 7th to 8th | Eggs (7th), honey (8th) |
| 9th to 10th | Corn silage (9th), oats and winter wheat (10th) |
Rankings do not show where the money is. USDA’s state fact sheet puts Michigan’s 2023 cash receipts at about $11.29 billion, led by dairy, corn and soybeans. The crops with first-place ranks are small by comparison. For a full ranking by receipts, see our page on Michigan’s top 10 commodities.
Chart
Top five commodities by cash receipts
US$ billion, Michigan, 2023
Top crops in Michigan: a closer look
Note the wording on cherries. Michigan ranks first for tart cherries, not all cherries. Three of the crops below moved noticeably between 2023 and 2025.
Tart and sweet cherries
Michigan produced 133 million pounds of tart cherries in 2023, the most of any state. The 2025 crop was 110 million pounds, from 25,000 acres at 4,390 pounds an acre, and growers received about 51.7 cents a pound. Sweet cherries added 12,450 tons in 2025. Cherry crops can change a lot from year to year, so check the year on any figure you see.
Asparagus
Michigan led the nation with 296,000 hundredweight (cwt) in 2023. USDA’s 2025 vegetable summary shows 273,000 cwt from 7,800 harvested acres, worth about $32.6 million. Asparagus earns a high price per unit, at $119 per cwt in 2025, against $13.10 for cucumbers.
Cucumbers
Michigan ranked second in 2023 with 4.28 million cwt. Output reached 5.19 million cwt in 2025, worth about $67.6 million. Processing took the larger share of value, at about $56.9 million against $10.7 million for the fresh market.
Squash
Michigan ranked first in 2023 with 1.5 million cwt, and 2025 output was almost the same at 1.51 million cwt. Value in 2025 was about $42.5 million, and about $38.2 million of that came from the fresh market.
Chart
Michigan vegetable output, 2023 and 2025
Thousand cwt, selected crops
Michigan agricultural commodities beyond the top three
The state’s range goes well past the headline crops. Here are other key products, with figures from the same USDA sources.
Potatoes
Michigan ranked sixth in 2023 with 21.56 million cwt. The 2025 crop was 20.37 million cwt from 48,500 harvested acres, worth about $291 million.
Sugarbeets
Michigan ranked fourth in 2023 with 4.48 million tons. The 2025 crop was 3.81 million tons, from 133,300 harvested acres at 28.6 tons an acre.
Snap beans and bell peppers
Michigan ranked fourth for snap beans and fifth for bell peppers in 2023. In 2025, snap beans were worth about $13.1 million and bell peppers about $15.5 million.
Dry beans
Michigan ranked first for black beans and small red beans in 2023, and second for all dry beans, with 5.07 million cwt. Dry beans rarely get the attention that fruit does, but this is one of the state’s strongest national positions.
Dairy, eggs and honey
Milk is the state’s largest source of farm cash. Michigan ranked sixth in 2023, and the 2025 milk output was 12.5 billion pounds, valued at about $2.68 billion. The state ranked seventh for eggs and eighth for honey in 2023.

▶ A guide to growing potatoes, from planting to pest control, with satellite monitoring. · 13:10
Michigan fruit and vegetable production
The fruit sector goes well beyond cherries. These are the 2025 figures from USDA’s state overview, plus the Noncitrus Fruits and Nuts summary for apples.
- Apples: second in 2023. About 1.06 billion utilized pounds in 2025, worth about $322 million.
- Blueberries: fourth in 2023. 77.2 million pounds in 2025, worth about $130 million in utilized value.
- Peaches: sixth in 2023. 12,200 tons in 2025, worth about $24 million in utilized value.
- Pumpkins: sixth in 2023. 1.15 million cwt in 2025, worth about $22.5 million.
- Cabbage: sixth in 2023. 2.04 million cwt in 2025, worth about $32.7 million.
MDARD says the state produces more than 200 commodities on a commercial basis. This spread gives growers more than one market to sell into, though each crop carries its own price and weather risk.
Michigan maple syrup
Michigan ranked fifth for maple syrup in 2023 with 205,000 gallons. The 2025 output was 197,000 gallons at $42 a gallon, worth about $8.3 million, with a yield of 0.298 gallons per tap. Vermont was the leading state in the 2023 ranking table.
Crop monitoring technology on Michigan farms
Tools such as GPS guidance, drones, soil sensors and satellite imagery help growers see variation across a field and decide where to walk first. Satellite images show changes in vegetation, not the cause. Someone still has to visit the field to find out whether a weak patch is a pest, a nutrient problem or a drainage issue.
For growers with scattered fields, the Farmonaut Satellite + AI Farm Monitoring System shows vegetation maps by field through the season, so you can compare blocks without driving to each one.
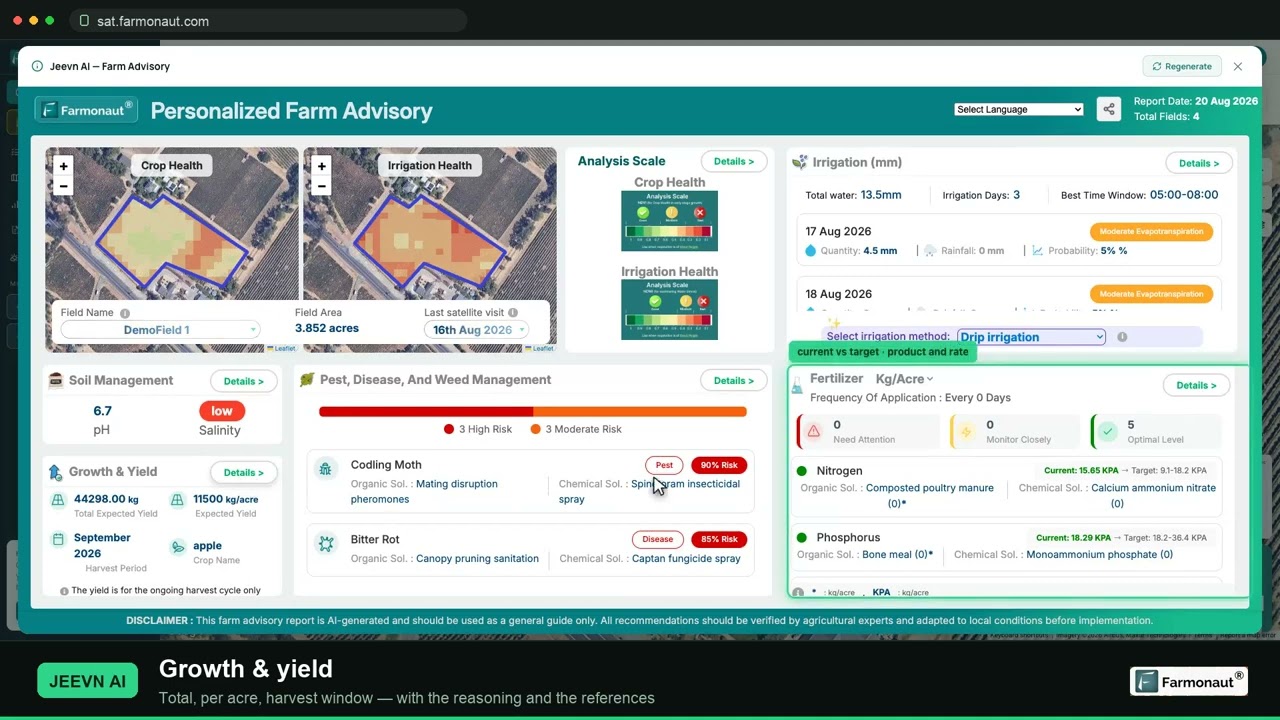
▶ A walkthrough of satellite crop monitoring: reading NDVI and pulling a report for a field. · 19:36
Sustainability in Michigan agriculture
Common conservation practices include cover crops to protect soil, integrated pest management, careful irrigation scheduling and on-farm renewable energy. The results depend on soil, crop and season, so test a change on a few fields first. Any pesticide or fertilizer decision should follow the product label and local rules, and you can ask your local MSU Extension office for advice. We cover the wider topic in our guides to sustainable farming practices and sustainable forest management.

▶ Why soil organic carbon matters for soil structure and long-term farming. · 12:28
The economic impact of Michigan agriculture
MDARD says the food and agriculture industry contributes $125.8 billion a year to the state’s economy, undated on its page. That is a system-wide number, like the 805,000 jobs. It is not farm income.
Farm-level numbers are much smaller. USDA’s fact sheet shows net farm income of about $3.45 billion in 2023, up from about $2.93 billion in 2022. Hired labor and non-cash employee pay cost farms about $864 million in 2023.
Export figures also vary by source. MDARD reports $2.9 billion in food, agricultural and forest products for 2024, and the USDA bulletin shows about $2.83 billion in 2023. USDA’s fact sheet estimates $4.31 billion for 2022, ranking Michigan 16th among states, using a different method based on farm production. Do not compare these directly.
Challenges and opportunities for Michigan agriculture
The numbers above suggest a few pressures for Michigan growers:
- Labor: the state’s farm job count has shrunk since 2001, and hired labor cost farms about $864 million in 2023.
- Crop swings: USDA shows the tart cherry crop at 178 million pounds in 2024 and 110 million pounds in 2025.
- Income: farm earnings in the BEA data fell by more than a third between 2022 and 2024, then rebounded in 2025.
- Trade: MDARD names Canada, Mexico, Japan, South Korea and China as top export markets, so changes in trade terms matter.
Possible responses include spreading risk across crops, adding value through processing or direct sales, and agritourism. MDARD lists more than 300 farmers markets in the state. Weigh each option with your own costs, and get professional advice before large investments.
Top Michigan crops comparison table
This table uses USDA’s rank for 2023 and output for 2023 and 2025. Units follow USDA.
| Crop | 2023 rank | 2023 output | 2025 output |
|---|---|---|---|
| Tart cherries | 1 | 133 million lb | 110 million lb |
| Asparagus | 1 | 296,000 cwt | 273,000 cwt |
| Squash | 1 | 1.50 million cwt | 1.51 million cwt |
| Cucumbers | 2 | 4.28 million cwt | 5.19 million cwt |
| Maple syrup | 5 | 205,000 gal | 197,000 gal |
| Potatoes | 6 | 21.56 million cwt | 20.37 million cwt |
Related pages on our site: affiliate program, web and mobile app, satellite data API, API developer docs.
FAQ
What was the agricultural employment share in Michigan?
Farm jobs were about 1% of Michigan jobs, based on BEA’s 61,897 farm jobs in 2022 and 5,877,978 total jobs in 2023. MDARD puts the wider food and agriculture system at about 17% of state employment, or about 805,000 jobs.
How many people work in agriculture in Michigan?
BEA counted 61,897 farm jobs in 2022, including 38,801 proprietors. MDARD’s figure of about 805,000 covers the whole food and agriculture system. Jobs are not the same as people, as one person can hold more than one job.
What are Michigan’s top agricultural products?
By cash receipts in 2023, the top five were dairy, corn, soybeans, miscellaneous crops, and cattle and calves. By national rank, Michigan was first in 2023 for tart cherries, asparagus, squash, black beans and small red beans.
Does Michigan really rank in the top 10 for 27 products?
Yes, for 2023. USDA’s Michigan bulletin lists 27 commodities ranked 10th or higher, excluding floriculture. Some are subgroups, such as individual dry bean classes.
How much does agriculture contribute to Michigan’s economy?
MDARD says $125.8 billion a year for the food and agriculture industry. Farm cash receipts were about $11.29 billion in 2023, according to USDA, and net farm income was about $3.45 billion.
Farmonaut crop monitoring
See your own fields from space
Draw your fields once and Farmonaut shows satellite vegetation maps for them through the season, on web, Android or iOS.




Keep reading

Sources
- MDARD, Michigan Agriculture Resources (facts on economy, employment, exports): michigan.gov
- MDARD, About MDARD: michigan.gov
- US Bureau of Economic Analysis, CAEMP25N employment by NAICS industry, 2001-2022: apps.bea.gov
- US Bureau of Economic Analysis, SAINC state personal income and employment, to 2025: apps.bea.gov
- USDA NASS, Michigan Annual Statistical Bulletin 2023-2024: nass.usda.gov
- USDA NASS, 2025 State Agriculture Overview: Michigan: nass.usda.gov
- USDA ERS, State Fact Sheets: Michigan (updated 2025): data.ers.usda.gov
- USDA ERS, Farm Labor: ers.usda.gov
- USDA ERS, Ag and Food Statistics: Farming and Farm Income: ers.usda.gov
- USDA NASS, Noncitrus Fruits and Nuts Summary (May 2026): release.nass.usda.gov
- USDA NASS, Vegetables Annual Summary (2026): esmis.nal.usda.gov
Discussion
Questions, corrections or field experience? Share them below. First-time comments are reviewed before they appear, and your email is never published.
No comments yet. Be the first to add a question or your experience.

 Coromandel International
 Hayleys Agriculture
 Linx Agritech
 Adinet
 Save Your Soils
 GalaxEye Space
 Grandstream Algérie
 XOS Realty
 Geospatial Lab Africa
 Agro La Gándara
 HIPSAC
 ZOL Zimbabwe
 Juligerm
 AdBio
 MISE Maroc
 NWNS
 Red August Group
 Farm Inc
 WeMe Global

 Licence holder · Niger · Gold
 Client · Somalia · Gold
 Client & affiliate partner · Ghana · Gold










