

Agriculture Capital: Yuma AZ’s USDA Office & Lettuce Supply
Reviewed September 2026 against the University of Arizona Cooperative Extension economic impact study, USDA NASS Arizona, and the Arizona Farm Bureau.
Try it: Enter values above to estimate crop value. →
Yuma, Arizona is the agriculture capital most people mean when they search that phrase in a winter context: from November through March, roughly 90% of the leafy vegetables eaten in the United States are grown in the Yuma area, according to the Arizona Farm Bureau and University of Arizona research. The USDA Yuma AZ office — the local USDA Rural Development and Farm Service Agency presence that supports this farm economy — was slated for closure in 2025 as part of a nationwide round of USDA office closures, then reversed in June 2025 after local and congressional pushback. This article covers what the office does, what closing (or reopening) it actually changes, and the hard numbers behind why Yuma carries outsized weight in the national food supply.
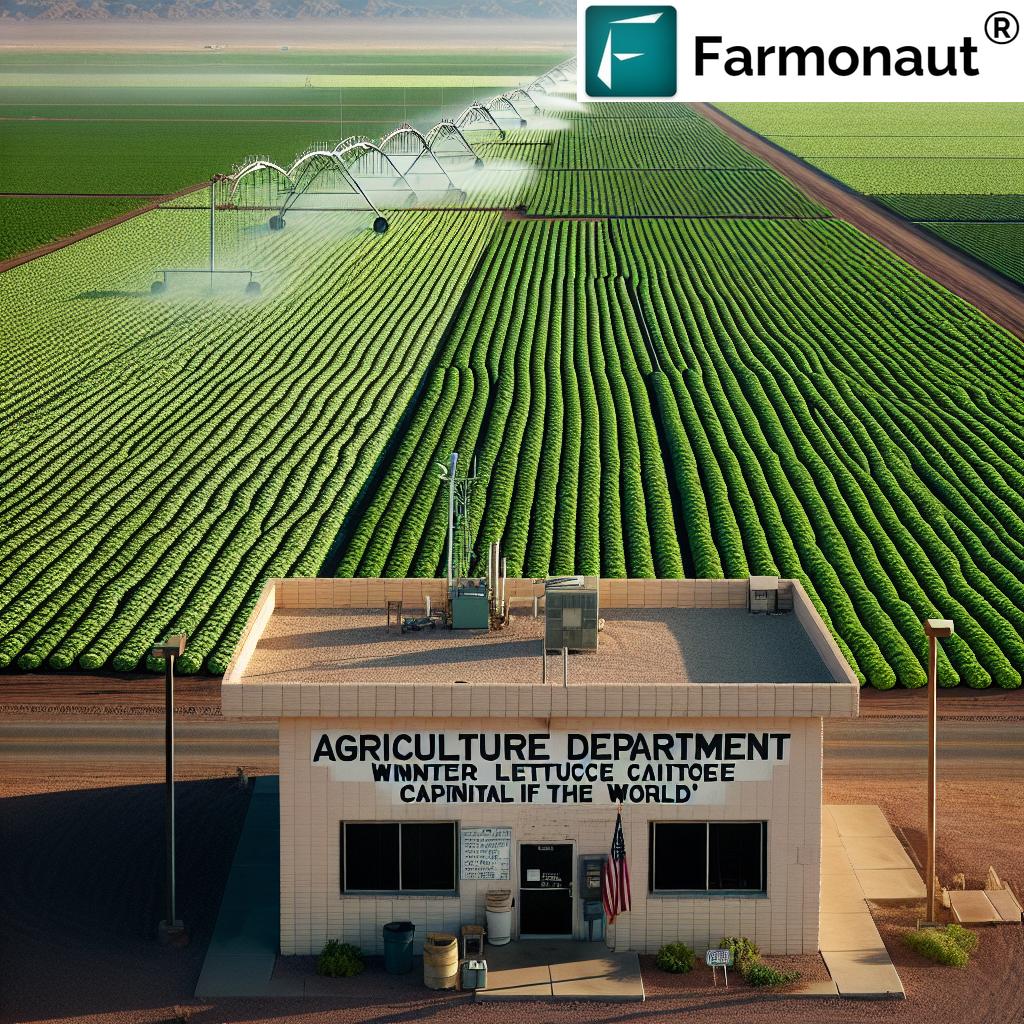
Table of Contents
- Why Yuma Is Called the Lettuce Capital of the World
- USDA Yuma AZ: What the Office Does and Its Current Status
- USDA Office Closures: The National Picture
- Yuma Agriculture by the Numbers
- Services at Risk: A Comparison
- Voices From the Community
- Where Technology Fills the Gaps
- Calculator: Yuma Water-Efficiency Value Estimator
- FAQ
- Try it: Enter values above to estimate crop value.
Why Yuma Is Called the Lettuce Capital of the World
“Lettuce capital of the world” is not a marketing phrase — it is a description of a genuine production bottleneck. The Arizona Farm Bureau, citing University of Arizona research, puts the number at 90% of US leafy vegetable consumption between November and March sourced from the Yuma growing region. USDA NASS’s Arizona Vegetables news release recorded 68,500 acres of lettuce harvested in Arizona in 2023, the bulk of it in Yuma County’s low desert, where mild winters and Colorado River water allow continuous harvest cycles that most of the country cannot run from December through February.
The concentration is extreme by national standards. The University of Arizona’s 2022 economic impact study found Yuma’s vegetable farming sector operates at 58 times the concentration ratio of the US national average, and Yuma County ranked 3rd nationally among counties for combined vegetable, melon, potato, and sweet potato sales that year. That ranking is why a disruption in Yuma — whether a freeze, a water cutback, or a USDA office closure — shows up on lettuce shelves in Boston and Seattle within weeks, not months.
Getting a current acreage figure for your own planning cycle is straightforward: USDA NASS publishes the Vegetables Summary every February, and the underlying state-level series is queryable year-round through NASS QuickStats by selecting Arizona, Lettuce, Area Harvested, Annual. The 2023 figure above will be superseded by newer releases; QuickStats always carries the latest one NASS has published.
USDA Yuma AZ: What the Office Does and Its Current Status
The USDA presence in Yuma is not one office but a cluster of overlapping services — Rural Development, the Farm Service Agency, and the Natural Resources Conservation Service (NRCS) all operate out of local facilities that farmers use interchangeably when they say “the USDA office.” Between them, the office has historically handled:
- Information Hub: Local updates on agricultural policy, market conditions, and program deadlines that farmers would otherwise have to track through regional or national USDA channels.
- Grant Programs: Applications for farm improvement, research, and rural development grants administered through USDA Rural Development.
- Low-Interest Loans: FSA farm ownership and operating loans, which are often the difference between a small or mid-sized operation being able to finance equipment or expansion and not.
- Natural Resources Conservation Service: Technical assistance on soil conservation, irrigation efficiency, and other environmental issues tied to land and water use.
The closure threat was real and specific: the Department of Government Efficiency’s published list put the projected savings from closing the Yuma office at nearly $400,000, as part of a plan that touched hundreds of USDA offices nationwide, including roughly a dozen in Arizona. Former USDA rural Arizona director Charlene Fernandez argued against it directly:
“It’s very disappointing just thinking about who Yuma, Arizona is; we have to think about how critical we are. All the leafy greens we grow right here are critical to the rest of the country.”
Senator Ruben Gallego pressed the case in writing, citing the office’s role funding affordable housing and water infrastructure improvements in low-income communities alongside its support for the agriculture industry. The pressure worked: per KAWC’s June 2025 report, the Yuma Rural Development office was confirmed to remain open, with the same reporting noting the office had provided $623 million in loans and grants to rural communities over the prior 10 years. That figure is a decade total as of June 2025 — it is not an annual number, and a new decade total would need to be sourced from USDA Rural Development or a subsequent press release rather than assumed to still read $623 million.
The durable lesson here is not the dollar figure — it’s the process. USDA office closures and reversals move through the same channel every time: a listing appears on the Department of Government Efficiency’s public closure list, congressional delegations respond in writing, and USDA Rural Development issues the final call. If you need the current status of the Yuma office rather than the 2025 episode described here, check USDA Rural Development’s Arizona office directory directly, since a reversal is a decision that can be revisited in a future budget cycle.
USDA Office Closures: The National Picture
Yuma’s closure listing was one line in a much longer plan. The same 2025 round of federal cost-cutting that targeted Yuma also proposed closing roughly a dozen USDA offices elsewhere in Arizona and hundreds nationwide, alongside broader USDA workforce reductions — the same period saw about 6,000 USDA employees affected by federal mass layoffs nationally, some of whom had been rehired shortly before the Yuma closure was announced. For those employees, a reversal decision made in Washington determines whether they have a job in Yuma at all, not just whether a building stays open.
What makes an office closure list worth checking rather than reading about secondhand is that it changes: offices come off it after local advocacy, and offices can be added in later budget cycles. The Department of Government Efficiency’s site is the primary source for what is currently listed; a news article from any single month, including this one, is a snapshot of that list on the day it was reported.
Yuma Agriculture by the Numbers
The University of Arizona’s 2022 economic impact study is the most complete accounting of what Yuma’s farm economy is actually worth, and it is worth walking through in full because the headline figure undersells the structure underneath it.
- $4.4 billion — total economic activity generated by Yuma agriculture and agribusiness in Arizona (2022).
- $3.9 billion — direct contribution from Yuma County agriculture sales (2022).
- $3.2 billion — retail value of Yuma-grown produce (2022).
- $1.3 billion — direct contribution from crop production alone (2022).
The water-efficiency figure is the one most often missed in coverage of Yuma, and it directly answers the “how is this sustainable in a desert” question that usually follows any mention of Yuma agriculture. The University of Arizona study measured water use per $1,000 of crop value at 0.63 acre-feet in Yuma, against 1.44 acre-feet per $1,000 of crop value for the rest of the Colorado River Basin — Yuma farmers are producing more than double the economic value per acre-foot of water than the basin average.
These are 2022 figures from a study built on the Census of Agriculture cycle, and the University of Arizona Cooperative Extension has historically refreshed this analysis on a roughly 5-year cadence tied to that census — the next comprehensive update is anticipated around 2027. Until then, the 2022 study linked below is the authoritative source, and checking it directly is safer than relying on any secondhand restatement of the numbers, including this one.
Services at Risk: A Comparison
An AI summary of “USDA office closures” will tell you offices provide loans, grants, and conservation support. It will not tell you what changes on the ground when one closes versus when it stays open with reduced staff versus when it’s fully funded. Here is that comparison, built from the specific services documented for the Yuma office:
| Service/Resource | Fully Staffed Office | Office Closed / Consolidated |
|---|---|---|
| Agricultural Information | Local staff answer questions same-day | Routed to regional office or national call center; response time increases |
| Grant Programs (Rural Development) | In-person application support; local knowledge of which programs fit a given farm | Online-only applications; farmers without reliable broadband face a real barrier |
| FSA Low-Interest Loans | Local loan officers process applications in-region | Applications reviewed by a consolidated office, often out of state; longer turnaround |
| NRCS Conservation Support | On-site technical visits for irrigation and soil practices | Remote consultation only, or a multi-week wait for a traveling technician |
| Rural infrastructure funding (housing, water) | Local office tracks and administers active grants ($623M in loans/grants over the 10 years to June 2025) | Administration shifts to a regional office with no local Yuma-specific caseload |
The Yuma office’s actual pre-closure staffing count and exact service menu were not published in the reporting available for this article — if you need that level of detail for a specific program, USDA Rural Development’s Arizona state office can confirm current staffing and which services are handled locally versus regionally.

Voices From the Community
Beyond Fernandez’s comments above, the reversal effort was framed by advocates as protecting a specific, quantifiable flow of federal investment rather than an abstract office. Fernandez put the ask directly to the people most affected:
“Send a letter to this administration, to the USDA secretary. Let them know how important Yuma is and how critical the work that we do here is.”
That’s a durable playbook for any rural community facing a similar listing: document the local dollar figures (loans issued, grants administered, farms served), route them to the congressional delegation in writing, and expect the Department of Government Efficiency’s list to be the fastest-moving part of the process — faster than any follow-up news coverage.

Where Technology Fills the Gaps
None of the tools below replace a USDA loan officer or an NRCS conservation planner. What they do is give a farm operation continuity on the things a local office visit used to cover, regardless of whether that office is open this quarter.
Farmonaut’s carbon footprinting tools track field-level emissions data that would otherwise require an NRCS conservation planning visit to assemble, useful for farms applying to conservation programs without a local technician available. Farmonaut’s crop loan and insurance services give farmers a financing channel that does not depend on FSA loan-office staffing levels or processing backlogs. For larger operations, fleet management tools cut the labor overhead that becomes more expensive when a farm has fewer outside resources to lean on, and product traceability tools help meet buyer and regulatory documentation requirements that used to be easier to satisfy with a local USDA contact walking through the paperwork.
These tools matter more, not less, in a region like Yuma precisely because the concentration numbers above mean a service gap here has an outsized national effect. A farm operation that can document its own conservation practices, financing, and supply chain independently of local USDA office hours is less exposed to the closure-and-reversal cycle described in this article.

Calculator: Yuma Water-Efficiency Value Estimator
Use the water-use-per-dollar figures above to see what a given water allocation is worth in Yuma-style desert vegetable production versus the Colorado River Basin average — enter your own acre-feet and crop value assumptions below.
Enter values above to estimate crop value.
Assumptions: based on the University of Arizona’s 2022 study finding 0.63 acre-feet of water per $1,000 of crop value in Yuma versus 1.44 acre-feet per $1,000 elsewhere in the Colorado River Basin. This is a regional average across Yuma’s crop mix, not a per-crop or per-field figure — actual water requirements vary by crop, soil, and irrigation method, and this tool does not account for water rights allocation, delivery costs, or a specific farm’s infrastructure.
USDA Closures and Yuma Agriculture: A Side-by-Side Comparison
| Metric | Figure | Period / Source |
|---|---|---|
| US winter leafy greens from Yuma | 90% | Nov-Mar; Arizona Farm Bureau |
| Arizona lettuce acreage harvested | 68,500 acres | 2023; USDA NASS |
| Yuma agriculture economic activity | $4.4 billion | 2022; University of Arizona |
| USDA Yuma office loans/grants issued | $623 million | 10 years to June 2025; USDA / Sen. Gallego |
| Projected closure savings (DOGE estimate) | ~$400,000 | 2025 closure proposal |
| National USDA employees affected by layoffs | ~6,000 | 2025 federal workforce reduction |
Put next to each other, the closure math is stark: a projected $400,000 in savings against an office that had moved $623 million into the local economy over the preceding decade, in a county that generates $4.4 billion in agricultural economic activity annually. That comparison, more than any single quote, is why the closure decision was reversed within months of being listed.
FAQ Section
- Q: Is the USDA office in Yuma, AZ still open?
A: Yes — per KAWC’s June 2025 reporting, the Yuma Rural Development office was confirmed to remain open after a 2025 closure proposal was reversed following congressional pressure. Confirm current status directly with USDA Rural Development’s Arizona office, since closure lists are revisited in future budget cycles. - Q: Why is Yuma, Arizona called the lettuce capital of the world?
A: Because roughly 90% of the leafy vegetables consumed in the US between November and March are grown in the Yuma area, according to the Arizona Farm Bureau and University of Arizona research, thanks to a mild winter climate and Colorado River irrigation that supports continuous harvest cycles other US regions cannot run in winter. - Q: How big is Yuma’s agriculture economy?
A: The University of Arizona’s 2022 study measured $4.4 billion in total economic activity from Yuma agriculture and agribusiness, with $3.9 billion in direct county agricultural sales and $1.3 billion from crop production alone. - Q: What services does a USDA office like Yuma’s provide to farmers?
A: Agricultural information, USDA Rural Development grant programs, FSA low-interest loans, and Natural Resources Conservation Service technical support for soil and water conservation practices. - Q: Were other USDA offices closed alongside Yuma’s?
A: The 2025 closure plan that listed Yuma also proposed closing roughly a dozen other Arizona offices and hundreds nationwide, part of a broader federal cost-cutting round that also affected about 6,000 USDA employees nationally through layoffs. - Q: Where can I find current Arizona lettuce acreage data?
A: USDA NASS QuickStats (publicly queryable) carries the latest Arizona lettuce area-harvested figures, updated with each annual Vegetables Summary released every February.
Conclusion
Yuma’s position as the United States’ winter agriculture capital is not a claim — it is measurable: 90% of the country’s winter leafy greens, 68,500 acres of lettuce, $4.4 billion in annual economic activity, and water-use efficiency more than double the Colorado River Basin average. The USDA Yuma office closure episode showed how thin the margin can be between a routine federal cost-cutting line item and a nationally significant supply chain, and how quickly that changes when the numbers are put in front of decision-makers. The current state is that the office remains open as of the June 2025 reversal — the way to verify it is still open, and to catch any future listing before it becomes news, is to check the Department of Government Efficiency’s public closure list and USDA Rural Development’s Arizona office page directly rather than relying on any single article, including this one.
Earn With Farmonaut: Affiliate Program
Earn 20% recurring commission with Farmonaut’s affiliate program by sharing your promo code and helping farmers save 10%. Onboard 10 Elite farmers monthly to earn a minimum of $148,000 annually—start now and grow your income!
Further reading:
Farmonaut Subscriptions




 SatSure
 Geno
Geno Hayleys Agriculture
 Linx Agritech
 Adinet
 Save Your Soils
 Grandstream Algérie
 XOS Realty
 Geospatial Lab Africa
 Agro La Gándara
 HIPSAC
 ZOL Zimbabwe
 Juligerm
 AdBio
AdBio MISE Maroc
 NWNS
NWNS Red August Group
