
NDWI Index Formula: 5 Powerful Ways to Monitor Water Content
Focus Keyword: NDWI Index Formula
“NDWI can detect water bodies with over 90% accuracy using satellite remote sensing data.”
Table of Contents
- Understanding NDWI: What Is the Normalized Difference Water Index?
- NDWI Index Formula: How Is It Calculated?
- The Science Behind NDWI: NIR and SWIR Spectral Bands
- 5 Powerful Ways to Monitor Water Content with NDWI
- Advantages of Using NDWI in Agriculture & Forestry
- Limitations and Key Considerations of NDWI
- Comparison Table: NDWI Use Cases in Agriculture and Environment
- Farmonaut’s Technological Innovations for Water Content Monitoring & Management
- Frequently Asked Questions: NDWI, Remote Sensing and Farmonaut
- Conclusion: Empowering Precision Agriculture with NDWI


Understanding NDWI: What Is the Normalized Difference Water Index?
The Normalized Difference Water Index (NDWI) is a powerful remote sensing metric specially designed to detect and monitor the water content present in vegetation and identify water bodies across diverse landscapes. From crop fields and forests to wetlands and urban environments, NDWI offers a swift, non-destructive way to obtain insights into local and regional hydrological dynamics.
Using satellite imagery and multispectral sensors, NDWI enables researchers, farmers, foresters, and environmental managers to:
- Assess and monitor vegetation water content over time
- Detect and map surface water bodies, even in mixed land cover zones
- Monitor crop water stress and health for timely interventions
- Manage irrigation practices with spatial precision
- Carry out forest moisture assessment to evaluate wildfire risk
With advances in remote sensing technology, NDWI has revolutionized water management in agricultural and forestry sectors, enabling data-driven decision-making at unprecedented scales.
Focus Keyword: NDWI index formula

NDWI Index Formula: How Is It Calculated?
At its core, the NDWI index formula leverages the spectral reflectance properties of water, vegetation, and soil in the near-infrared (NIR) and short-wave infrared (SWIR) bands. The mathematical equation for NDWI is:
NDWI = (NIR – SWIR) / (NIR + SWIR)
- NIR (Near-Infrared): Represents reflectance values typically at ~850 nm, highly sensitive to healthy plant cell structure and water.
- SWIR (Short-Wave Infrared): Reflects values around ~1600 nm, strongly absorbed by water in plant leaves and soil, making it a key spectral band for vegetation monitoring.
This normalized difference computation accentuates areas with significant water content and suppresses non-water, resulting in an easy-to-interpret index.
- Values close to +1: Indicate surfaces with high water content, such as healthy plants or open water bodies.
- Values near 0: Represent moderate water content or mixed surfaces.
- Values toward -1: Suggest very low water content—stress or bare soil conditions.
By comparing these two spectral bands (NIR & SWIR), the NDWI equation offers a practical way to monitor, detect, and map water content over time and space.
“NDWI values above 0.5 typically indicate high water content in vegetation or soil.”
The Science Behind NDWI: NIR and SWIR Spectral Bands in Remote Sensing
Modern satellite remote sensing systems are built around the ability to collect reflectance measurements at multiple wavelengths. The NDWI index specifically uses these two bands because:
- NIR: Healthy vegetation reflects strongly in the near-infrared region due to leaf structure and internal water. Plants lacking water reflect less in this band.
- SWIR: Water—whether in leaves, soil, or open water bodies—absorbs SWIR energy, creating a signature dip in reflectance for water-logged or hydrated surfaces.
By analyzing the difference (NIR – SWIR) and their sum (NIR + SWIR), NDWI isolates areas with higher water content. This technique provides actionable insights into vegetation water content monitoring, crop water stress detection, forest fuel condition, and more.
Example: In a satellite image of a wheat farm in Punjab, healthy crops show a high NDWI value (≥0.5), while patches facing water scarcity display lower values (~0.1 or less). Open lakes or rivers often reach NDWI close to 1.0, while dry soil can drop toward -0.3.

5 Powerful Ways to Monitor Water Content with NDWI
Let’s explore the essential applications of the NDWI index in agriculture, forestry, and environmental monitoring, revealing how this powerful remote sensing metric has reshaped water content analysis around the globe.
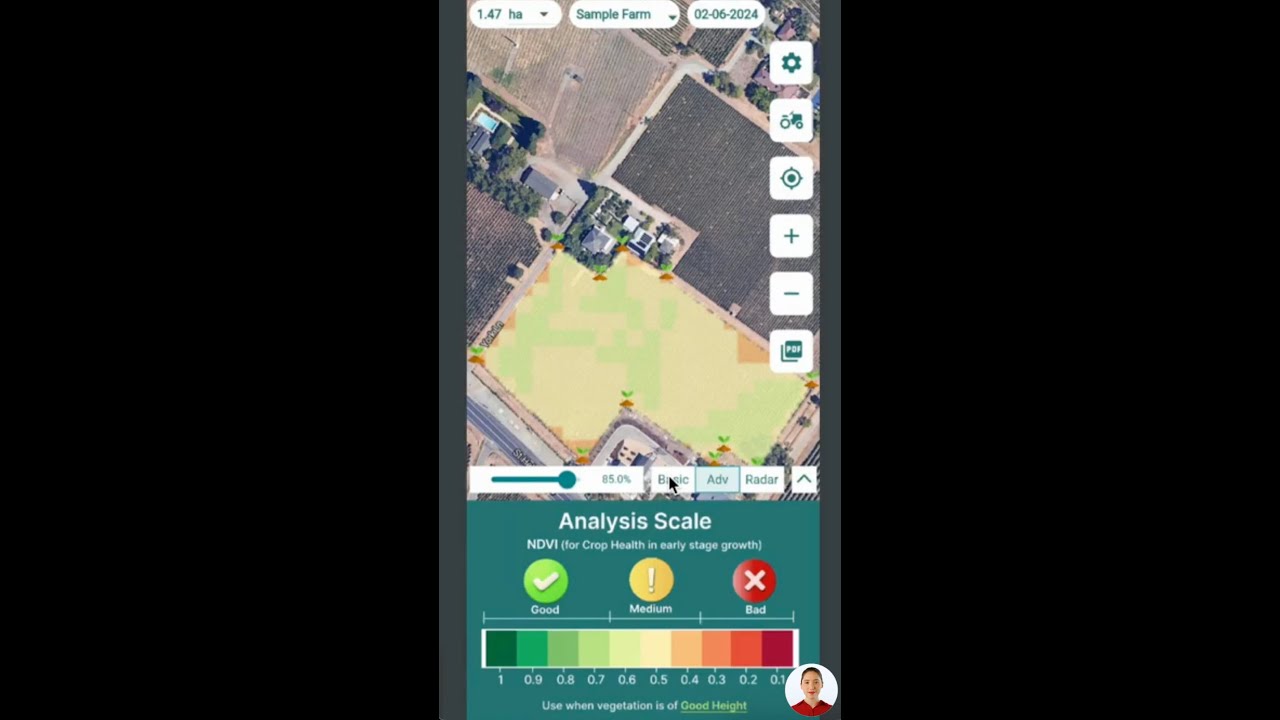
1. Crop Health Monitoring & Crop Water Stress Detection
One of the most impactful uses of NDWI in remote sensing is as a crop water stress detection tool. Healthy, irrigated crops have leaves and stems rich in water, yielding higher NDWI values. By contrast, stressed, drought-affected, or diseased plants show lower NDWI, alerting farmers to potential crop damage at an early stage.
- Early Detection: Regular NDWI-based vegetation water content monitoring allows farmers to identify water stress before visible signs of wilting or yellowing appear.
- Actionable Measures: Farmers can implement corrective measures (like irrigation, nutrient application, or shade nets) promptly, reducing the risk of yield loss or crop degradation.
NDWI’s sensitivity to subtle changes in moisture makes it superior to conventional NDVI when it comes to crop water stress detection, especially during dry spells or in arid regions.
Explore our AI-based crop advisory tools and real-time crop health monitoring on the Farmonaut App.
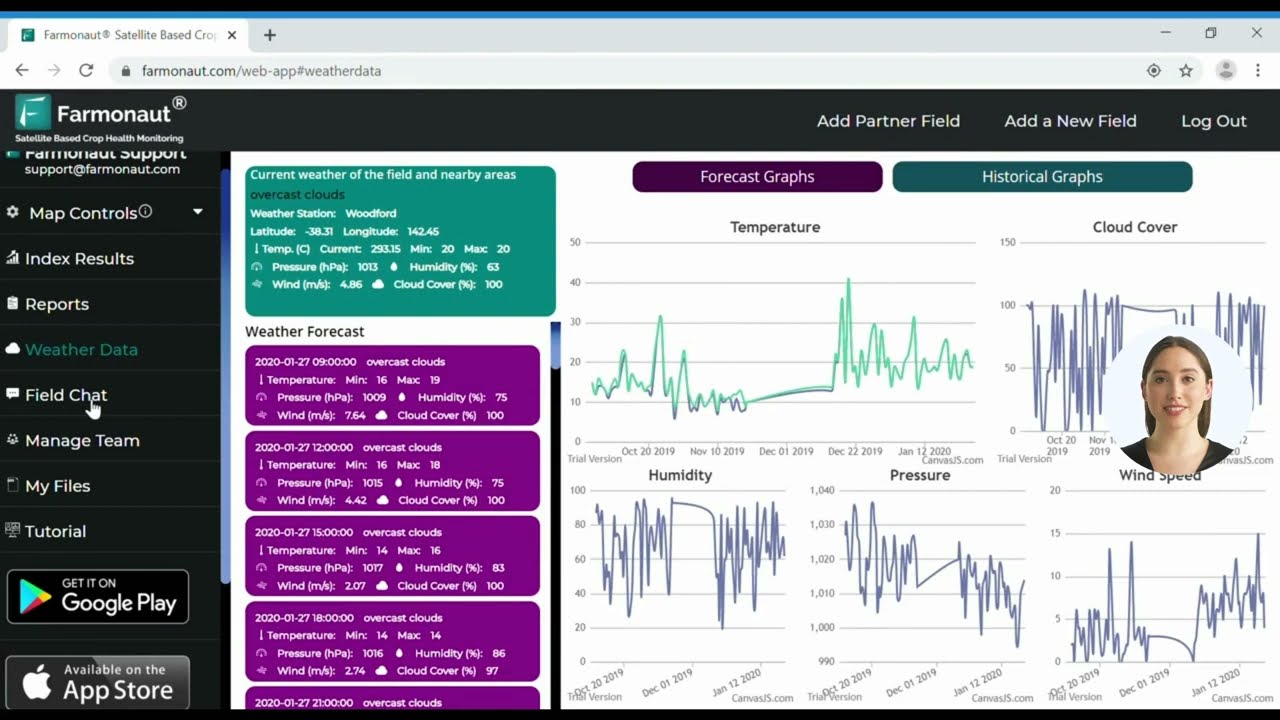
2. Satellite Imagery for Irrigation Management
Water is one of the most limited and expensive resources in agriculture. NDWI enables precision irrigation management by mapping soil and vegetation moisture across entire fields.
- Field-Level Insights: With satellite imagery for irrigation management, farmers can identify areas with high or low NDWI, signaling over-irrigation, under-irrigation, or water logging.
- Optimized Practices: Optimize irrigation schedules, reduce water wastage, and prevent crop damage from either drought or excessive water.
- Resource Savings: In regions such as Rajasthan, precision irrigation using NDWI decreases water and energy consumption, supporting sustainable agricultural water management.
For advanced field analytics, Farmonaut provides irrigation planning features that integrate NDWI with soil moisture, weather forecasts, and advisory recommendations.
Try our Large-Scale Farm Management tools for robust irrigation optimization.

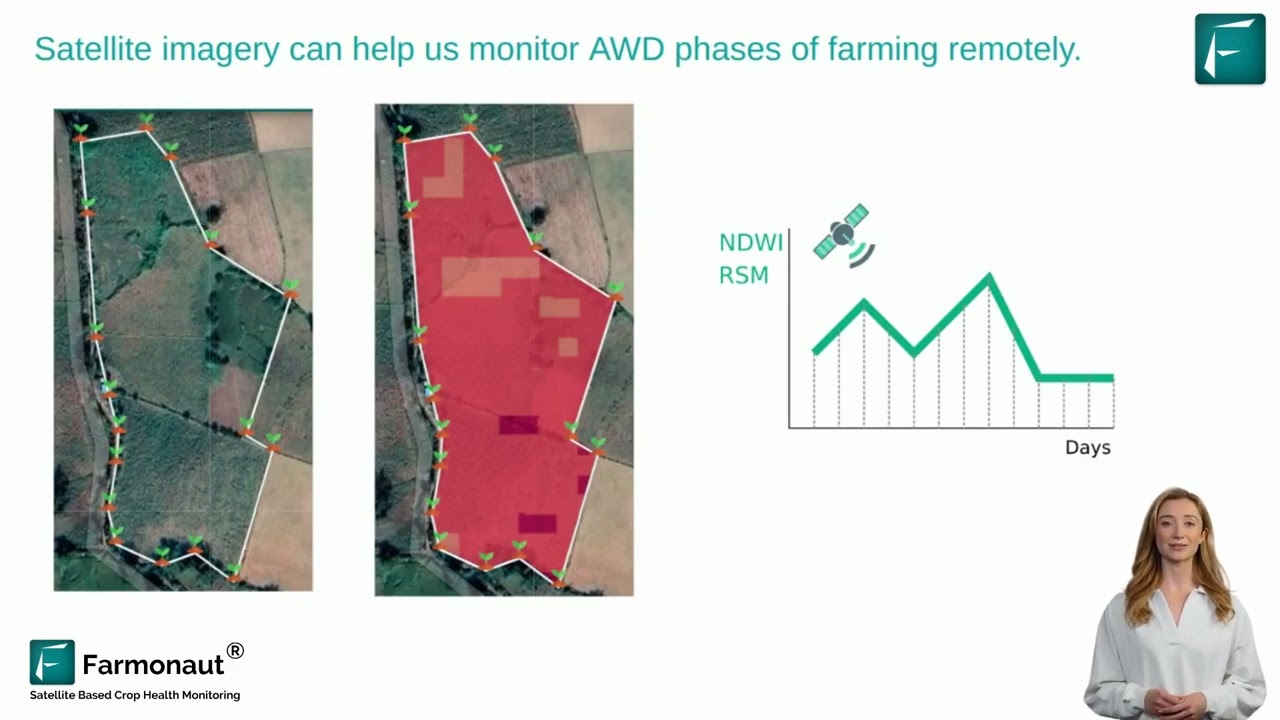
3. Forest Moisture Assessment & Forest Fire Risk Reduction
NDWI stands at the forefront of forest moisture assessment—a critical operation in forestry management and wildfire prevention, especially in sensitive zones like the Western Ghats and Sundarbans.
- Hydration Mapping: By monitoring forest canopy NDWI, managers can gauge the hydration status of entire stands and identify drought-prone regions.
- Fire Risk Prediction: Forests with lower NDWI are flagged as drier, more combustible, and at higher risk—enabling early intervention and firefighting resource allocation.
- Forest Health Monitoring: Ongoing NDWI analysis aids in detecting disease outbreaks or defoliation that also change canopy water content.
For government and conservation science, NDWI unlocks spatially comprehensive fire-risk, drought, and degradation monitoring with repeatability and scientific rigor.
Learn about Farmonaut’s Plantation & Forest Advisory solutions for forest management and environmental monitoring.
4. Identify Water Bodies with NDWI
NDWI’s unique sensitivity enables environmental scientists and planners to identify water bodies with NDWI even when visible spectrum mapping is challenging. This is of utmost importance in:
- Wetland Mapping: Accurately delineate seasonal and permanent water bodies, such as lakes, rivers, and ponds, in regions like Kerala, Assam, and the Indo-Gangetic Plains.
- Disaster Response: Map the extent of flooding, river overflows, or water recession during drought for rapid response and insurance validation.
- Urban Hydrology: Track reservoirs and water tanks in urban or peri-urban landscapes, supporting city water management.
By utilizing NDWI’s near real-time updates, satellite-based analytics keep public agencies and utility managers informed about changing water scenarios.
Integrate NDWI into your analytics—use our Satellite Data API or consult our API Developer Docs for advanced use cases.
5. Soil Moisture and Vegetation Water Content Monitoring
Besides surface water and plant hydration, NDWI also provides clues on soil moisture dynamics. This is especially valuable during the sowing period or pre-germination stage, where even small variations in water availability affect crop establishment.
- Planting Decisions: Timely soil moisture assessment helps determine optimal sowing dates, particularly in rainfed areas typical of Maharashtra or Madhya Pradesh.
- Integration with Other Indices: Coupling NDWI with indices such as SAVI (Soil-Adjusted Vegetation Index) or NDVI improves accuracy in separating bare soil wetness from vegetation hydration.
Farmers and agronomists can monitor soil moisture levels at a landscape scale with repeatable, satellite-based NDWI time series, boosting both farm productivity and resource sustainability.
Did you know? Our Blockchain-Based Traceability guarantees transparent tracking from farm to consumer, and our Carbon Footprinting tools empower sustainable farming by monitoring and reducing GHG emissions in agri-operations. Both features complement NDWI-powered water management for holistic resource optimization.
Advantages of Using NDWI in Agriculture & Forestry
- Non-Destructive & Real-Time Monitoring: NDWI enables frequent, non-invasive water content and vegetation health assessments across extensive agricultural fields and remote forest areas, with no need for physical sampling.
- Wide Spatial Coverage with Satellite Imagery: Leverage satellite data for macro- and micro-level monitoring, covering thousands of hectares in one shot.
- Early Detection of Crop Damage & Degradation: Identify hotspots of water stress, disease, or emerging drought, and intervene before irreversible crop loss or forest degradation.
- Resource Efficiency and Sustainable Management: By optimizing irrigation, fertilizer, and resource use, NDWI-driven analytics reduce both costs and environmental footprint.
- Accessible Through Multiple Platforms: Farmonaut offers NDWI analytics via web, mobile apps, and API integrations, making advanced vegetation monitoring universally available.
These advantages transform NDWI into a core component of modern agricultural water management indices and forestry remote sensing operations.
Limitations and Key Considerations of NDWI in Remote Sensing
While NDWI is a powerful metric, users must consider the following when applying it to real-world scenarios:
- Sensitivity to Built Structures: Urban areas with artificial water features can lead to overestimation, as NDWI may not distinguish between natural and artificial surfaces (source).
- Cloud Cover and Shadows: Clouds and their shadows can distort reflectance in both NIR and SWIR bands. It’s essential to use cloud-masking or spatial-temporal averaging for robust insights (source).
- Soil Moisture Confounding: Wet soils may cause elevated NDWI readings even without vegetation, so combining with indices like SAVI or advanced interpretation is advised (source).
- Sensor Calibration: Ensure your satellite or drone platform provides accurately calibrated NIR and SWIR bands for comparability.
Combining NDWI insights with additional indices and field validation ensures actionable, reliable water content monitoring.
Comparison Table: NDWI Use Cases in Agriculture and Environment
| Application Area | Purpose | Remote Sensing Technology Used | Typical NDWI Value Range | Key Benefits |
|---|---|---|---|---|
| Crop Health Assessment | Detect crop water stress and take early action | Satellite Imagery, Multispectral Sensors | Healthy: 0.4–0.7 Stressed: 0.1–0.3 |
Early detection of drought, optimize water use, prevent crop loss |
| Forest Moisture Analysis | Assess and manage forest fire risk | Satellite Imagery, Drones (est.) | Hydrated: 0.5–0.9 Dry/Fire-prone: 0.0–0.4 |
Wildfire risk assessment, fuel load management, drought monitoring |
| Irrigation Management | Optimize application of water across fields | Satellite Imagery, Farmonaut App | Overwatered: ≥0.7 Optimal: ~0.4–0.7 Underwatered: ≤0.3 |
Water savings, yield maximization, cost reduction |
| Water Body Detection & Mapping | Map and monitor natural & artificial water features | Satellite Imagery, Remote Platforms | Water: 0.5–1.0 Non-water: <0.0 |
Quick mapping, flood monitoring, urban hydrology |
| Soil Moisture & Vegetation Content | Monitor pre-sowing soil and general vegetation water | Satellite Imagery, Farmonaut Web | Moist: 0.3–0.6 Dry: <0.2 |
Informed sowing, resilience building, efficient land use |
Farmonaut’s Technological Innovations for Water Content Monitoring & Management
At Farmonaut, we are committed to making precision agriculture affordable and accessible for farmers, agribusinesses, and policy-makers worldwide. Our platform integrates NDWI-based analytics with the latest advances in AI, blockchain, and remote sensing to streamline crop health monitoring, agricultural water management, and forest moisture assessment.
How Farmonaut Empowers Users:
- Satellite-Based Crop Health Monitoring: Continuously monitor NDWI values, soil moisture, and vegetation health on any scale—from small farms to entire plantations.
- Automated Advisory & Alerts: Our Jeevn AI delivers customized guidance, leveraging NDWI trends to recommend irrigation, fertilization, and crop management strategies.
- Blockchain-Based Traceability: Secure, end-to-end product tracking builds consumer trust while ensuring compliance with food and sustainability standards.
- Fleet and Resource Management: Track and optimize agricultural logistics, from field operations to produce delivery, maximizing resource use and safety.
- Carbon Footprinting: Monitor GHG emissions alongside water and land resource use, enabling actionable sustainability planning.
- API Integration: Developers and agri-businesses can push the envelope by embedding NDWI algorithms and satellite data into custom applications using our API (docs).
Value Proposition: By fusing affordable satellite imagery with machine learning, actionable insights, and a farmer-friendly app approach, Farmonaut enables users to detect changes, optimize management practices, improve productivity, and achieve sustainability goals—all without complex hardware or prohibitive costs.
Ready to maximize your land’s potential?
Frequently Asked Questions: NDWI, Remote Sensing and Farmonaut
1. What does NDWI stand for, and what is its primary application?
NDWI stands for Normalized Difference Water Index. It’s a remote sensing metric used to monitor water content in vegetation and to detect/ delineate open water bodies. NDWI helps assess crop and forest health, manage irrigation, and detect water-related changes at landscape scales.
2. How is NDWI calculated?
The NDWI index is calculated as: (NIR – SWIR) / (NIR + SWIR), where NIR represents near-infrared reflectance and SWIR is short-wave infrared reflectance from satellite or multispectral sensor imagery.
3. What NDWI value indicates healthy crops or forests?
NDWI values above 0.4–0.5 usually indicate high water content (healthy crops/trees), while values below 0.3 may signal water stress or dry conditions.
4. Can NDWI mapping be automated for large scale use?
Yes, using satellite imagery and platforms like Farmonaut, NDWI-based analytics can be performed automatically and at high frequency, covering thousands of hectares efficiently.
5. What are the main limitations of NDWI?
False positives in built-up/urban areas, potential confusion from wet soil vs. vegetation water, and cloud contamination are notable limitations. Combining NDWI with other indices or using cloud-masking techniques helps mitigate these issues.
6. What devices or platforms support Farmonaut’s NDWI monitoring?
Farmonaut offers NDWI analytics via Android, iOS, Web/Browser App, and API integrations for enterprise or developer use.
Conclusion: Empowering Precision Agriculture with NDWI
The NDWI index formula is redefining how we monitor, manage, and sustain water resources in agriculture and forestry. By quantifying vegetation water content, soil moisture, and surface water bodies with unprecedented scale and frequency, NDWI empowers us to detect water stress early, optimize irrigation, assess fire risk, and enable sustainable outcomes in every landscape.
At Farmonaut, we believe technology and data-driven insights should be within reach for every farmer, forester, and environmental steward. Our advanced platform leverages NDWI-driven analytics, remote sensing science, and actionable advisory tools to bring precision, sustainability, and transparency to global land management—making the future of farming and forestry both resilient and prosperous.
Start your journey with NDWI-powered precision environmental monitoring today on Farmonaut.


