

Reviewed August 2026 against USDA Economic Research Service, FAA Part 137 records, and Research and Markets industry data.
Try it: Run your own numbers →
The US crop monitoring market was valued at $3.82 billion in 2025 and is projected to reach $4.44 billion in 2026, a 16.3% annual growth rate, according to Research and Markets (TheInsightPartners). That growth is not driven by novelty adoption—it’s driven by measurable field results: USDA Economic Research Service data shows 70% of large-scale US crop farms already run guidance autosteering, and variable rate irrigation studies show 25% water savings against uniform irrigation. This article covers what the technology actually costs, who’s using it, and how to check whether it pays off on your acreage.
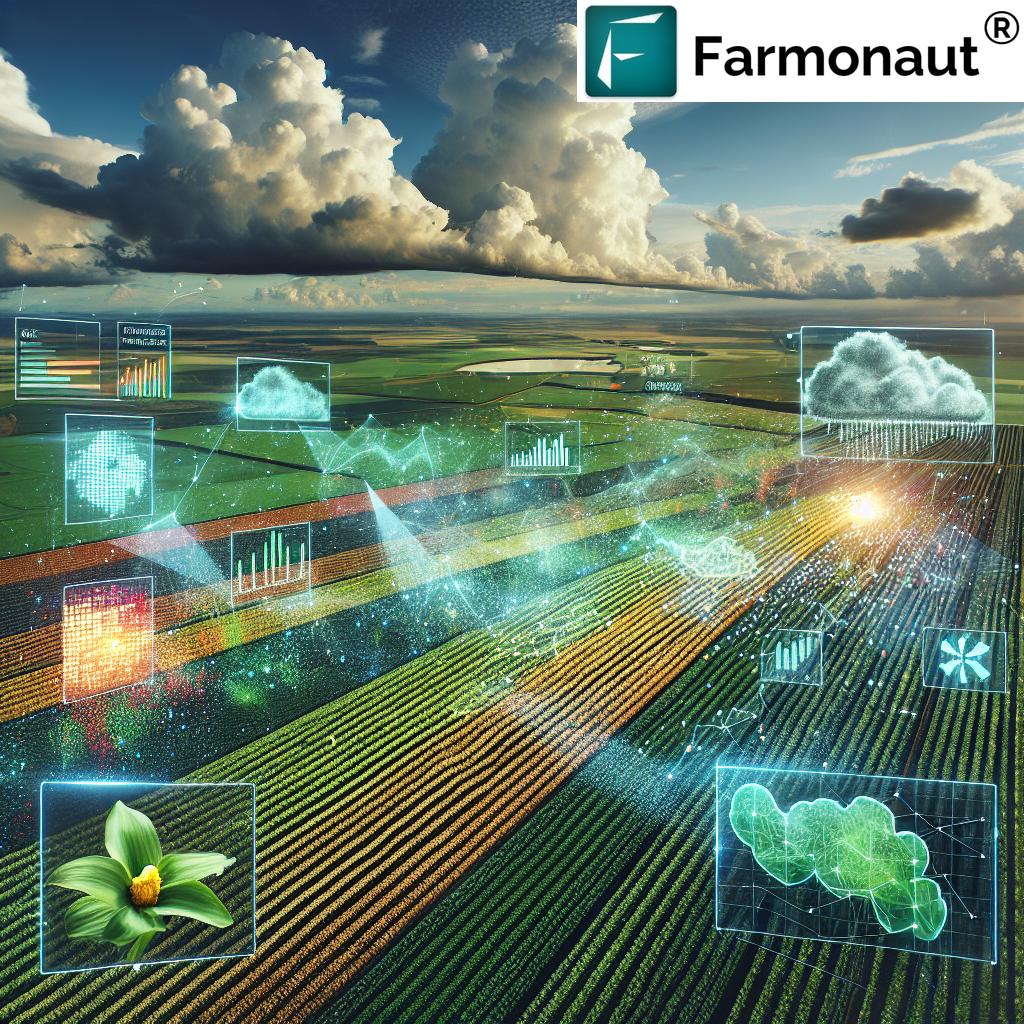



Market Overview: Size, Growth & What’s Driving It
The US crop monitoring market size stood at $3.82 billion in 2025, moving to a projected $4.44 billion in 2026, per Research and Markets / TheInsightPartners. That 16.3% year-over-year growth rate is published for the 2025–2026 period specifically; it is not a long-run CAGR, and it should be re-checked against the publisher’s next update rather than assumed to hold for later years.
On the broader smart crop monitoring category, Straits Research and IMARC Group track global sizing and segment breakdowns, while BIS Research covers a longer-horizon global forecast. A separate report from SNS Insider via GlobeNewswire sizes the global crop monitoring market toward $10.71 billion by 2032. These three cover different scopes (US vs. global, “crop monitoring” vs. “smart crop monitoring”), so don’t average them—check each report’s methodology section before quoting a single blended number.
What’s behind that growth isn’t abstract “digital transformation” language—it’s specific adoption numbers from working farms. USDA’s Economic Research Service found that in 2023, 70% of large-scale US crop farms had adopted guidance autosteering, versus 52% of midsize farms. The same ERS data shows 68% of large-scale farms using yield monitors, yield maps, and soil maps together. Those are the mechanisms that turn crop monitoring from a concept into daily field practice.
Market Composition by Segment
The crop monitoring ecosystem breaks into three functional layers:
- Hardware — sensors, drones, GPS receivers, weather stations, yield monitors
- Software — analytics platforms, AI-driven decision tools, farm management dashboards
- Services — integration, consulting, managed support, and technician labor
On the services side, farmdoc daily estimates that roughly 60% of US corn and soybean farms now use variable rate fertilizer technology, based on USDA ERS figures—which has created enough field-service demand that technician staffing is becoming its own constraint on adoption speed, not the hardware cost.

Key Technologies in Crop Monitoring
Three technology families underpin modern crop monitoring systems, and each has a distinct role rather than being interchangeable options.
Hardware: Sensors, Drones, GPS & Weather Stations
- Sensors—continuous readings of soil moisture, pH, and temperature for precise irrigation and fertilization scheduling.
- Drones & UAVs—aerial multispectral and hyperspectral imagery for crop health, pest infestations, and growth-pattern detection. US agricultural drones treated 16.4 million acres in 2025, up 58.7% year-over-year from 2024, per AgDroneDirectory, using AUVSI and FAA Part 137 operator data.
- GPS & weather stations—field mapping, yield tracking, and weather-pattern data for planting, harvesting, and risk timing.
Software: Analytics Platforms & Decision Support
- Cloud and offline platforms that collate field data from connected devices.
- AI-driven analytics that surface yield trends and disease alerts in near real time.
- Dashboards and mobile apps that turn raw data into an action a field crew can execute the same day.
Services: Implementation & Ongoing Support
- Consulting to match technology choice to farm scale and crop mix.
- Managed services—ongoing data analysis and advisory to protect the return on the initial investment.

Technology Adoption Table: What’s Actually Being Used
Rather than repeat unsourced global “market share” percentages, here is what’s directly measured on US farms, by practice and farm size, from USDA ERS’s 2023 survey:
| Practice | Large-Scale Farm Adoption (2023) | Midsize Farm Adoption (2023) | Primary Use |
|---|---|---|---|
| Guidance autosteering | 70% | 52% | Reduces overlap/skips in field passes, cuts fuel and input waste |
| Yield monitors, yield maps & soil maps | 68% | Not broken out separately in ERS chart | Field-level yield tracking, informs next-season input planning |
| Variable rate fertilizer technology | ~60% of US corn/soybean farms (farmdoc daily estimate) | Zone-specific nutrient application, reduces overapplication | |
| Agricultural spray drones | 16.4 million acres treated nationally in 2025 | Targeted pesticide/nutrient application, scouting | |
| Variable rate irrigation | 25% water savings vs. uniform irrigation (field study) | Zone-matched water delivery, reduces pumping cost | |
Source: USDA Economic Research Service, 2023 data; AgDroneDirectory, 2025; USDA ARS field study; farmdoc daily estimate.
Technological Advancements Propelling Growth
IoT in Agriculture: Smart Sensors & Real-Time Crop Data
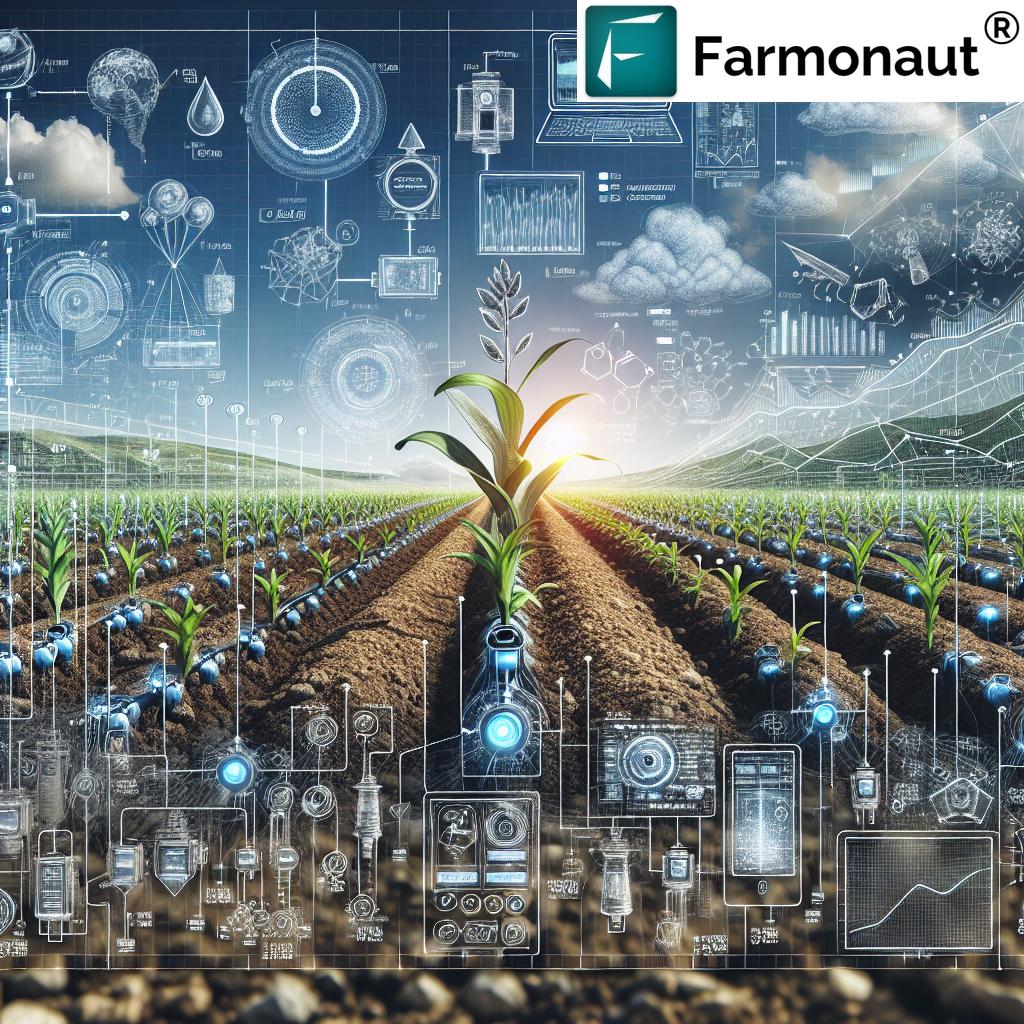
IoT sensors placed in soil, at weather stations, and at irrigation points give farmers continuous readings of moisture, temperature, and soil pH, enabling precise water and nutrient applications that reduce waste. Wireless sensor networks feed this data to farm management platforms automatically, and microclimate detection at the field level helps reduce disease and pest occurrence before it spreads.
Field-level sensor networks get a closer look in IoT crop monitoring adoption, with tool comparisons and return figures.
Access Farmonaut’s Satellite & Weather API for field-scale IoT integration
Drone-Based Crop Monitoring & UAV Imagery
US agricultural drones covered 16.4 million acres in 2025, a 58.7% jump from 2024, and there were 1,710 FAA Part 137 certificated agricultural drone operators as of September 2025, per AgDroneDirectory’s compilation of AUVSI and FAA records. That operator count is the number to re-check periodically: FAA Part 137 certifications are tracked in the FAA Registry and updated as new operators are certified, so a grower evaluating drone service providers in their region should verify current local operator counts directly against the FAA Registry rather than relying on a single point-in-time figure.
- Detecting pest infestations, nutrient deficiencies, and growth anomalies from multispectral and hyperspectral imagery
- Monitoring plant development stages to support variable-rate input application
- Optimizing planting and harvesting windows using canopy and stand data
Satellite Crop Imagery: Scalable, Remote Monitoring
Satellite imagery delivers large-scale monitoring with regular updates on crop vigor using indices like NDVI and EVI, without requiring a drone flight or ground crew for every field. This makes it a practical option for larger acreages and multi-field operations where flying every parcel individually isn’t cost-effective.
How different imagery sources compare at field level is covered in our guide to satellite imagery for agriculture. Satellites, indices and pricing all vary with farm size, as the guide to how remote crop monitoring works explains.
Explore Farmonaut’s Carbon Footprinting: Monitor & reduce environmental impact with real-time data.
Variable Rate Technology & Measured Water Savings
Variable rate irrigation (VRI) delivers water in zone-matched amounts rather than uniformly across a field. A Nebraska field study published via USDA ARS and cataloged on the National Center for Biotechnology Information found 25% water savings with VRI compared to uniform irrigation—a concrete, citable figure rather than a directional claim. See the full study at NCBI / USDA ARS.
On the fertilizer side, farmdoc daily’s estimate—drawing on USDA ERS data—puts variable rate fertilizer technology adoption at roughly 60% of US corn and soybean farms as of the 2023–2025 period. Read the underlying analysis, including the growing farm-service-technician demand it has created, at farmdoc daily.
See Farmonaut’s guide to variable rate fertilizer technology and its 7 benefits
Artificial Intelligence & Machine Learning in Monitoring
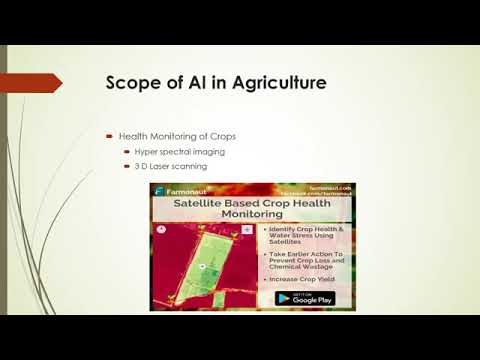
AI and machine learning go beyond raw data collection to deliver disease prediction, yield forecasting, and resource optimization—simulating input scenarios to find cost-efficient, sustainable outcomes before money is spent in the field.
Traceability & Supply Chain Transparency
Product traceability tools track produce origins, farming practices, and shipment journeys, which builds buyer trust and supports compliance with food safety standards.
Learn about Farmonaut Traceability: Make your products transparent from farm to retail shelf.
Market Segmentation: Applications & Technologies
Segmentation by Application
- Crop Protection: Early detection and management of pests, diseases, and weeds using sensor networks, AI-driven analysis, and variable-rate application (IMARC Group).
- Soil Monitoring: Continuous tracking of soil moisture, pH, and nutrient levels to adjust fertilization and irrigation.
- Weather Forecasting & Risk Planning: Weather station and meteorological data to optimize planting and harvesting timing and mitigate weather risk.
- Yield Monitoring: Analytics that measure crop yields at harvest and refine input planning for the next season.
Segmentation by Technology
- Sensing & Imagery: Remote sensing via satellites, drones, and ground sensors, spanning macro field-level views to individual-plant detail.
- Variable-Rate Technology (VRT): Zone-specific application of fertilizer, pesticide, and irrigation—the 25% VRI water savings cited above is a direct result of this category.
- Automation & Robotics: Autonomous or guided planting, weeding, and harvesting machinery that reduces labor hours per acre.
Farmonaut’s Modular Approach
Farmonaut’s platform is built to serve this full range of applications. Large Scale Farm Management serves agribusinesses and government units; Fleet Management & Resource Tracking handles logistics optimization; and crop loan & insurance tools give lenders and insurers satellite-based verification for financing decisions.
The carbon footprinting service adds real-time emissions tracking for operations that need to report on sustainability metrics.
Regional Insights: US Adoption Patterns
North America: Scale Drives Adoption Rate
North America holds a 34.8% share of the global smart crop monitoring market as of 2023, per SNS Insider via GlobeNewswire. Within the US specifically, the ERS adoption gap by farm size—70% vs. 52% for autosteering, large vs. midsize—shows that scale, not geography, is the strongest predictor of adoption. Large-scale operations can spread hardware and software costs over more acres, which is precisely the constraint the ROI calculator below is built to help a specific farm evaluate.
A closer look at how this plays out in practice: Farmonaut’s coverage of South Carolina’s agricultural strategies for next-generation farmers shows regional adoption patterns among small and mid-scale US operations specifically.
Precision Agriculture Robotics: Key Technologies
For readers specifically evaluating precision agriculture robotics, the technology stack overlaps with crop monitoring but adds autonomous or semi-autonomous machinery to the loop. The core components in current deployment are:
- Guidance autosteering systems—the most widely adopted robotics-adjacent technology on US farms, at 70% of large-scale operations and 52% of midsize operations (USDA ERS, 2023).
- Autonomous and assisted spray drones—covering 16.4 million acres in the US in 2025, operated by a growing base of FAA Part 137 certificated pilots (1,710 as of September 2025).
- Variable rate application robotics—hardware that executes VRT fertilizer and irrigation decisions in the field without manual zone-by-zone adjustment.
- Sensor-fused navigation—GPS combined with onboard sensors for row-following and obstacle avoidance in autonomous equipment.
The throughline across all four is that robotics adoption is following the same size-driven curve as monitoring adoption generally: technologies with a clear per-acre payback (autosteering, spray drones) are adopted first and fastest, while machinery requiring larger upfront capital lags on midsize farms.
ROI Calculator: Crop Monitoring & VRT Adoption
Use your own acreage, water cost, and fertilizer spend to see where the published water-savings and adoption-cost figures above translate into dollars for your operation.
Run your own numbers
Assumptions: water savings fixed at 25% (the field-study figure from USDA ARS/NCBI for variable rate irrigation vs. uniform irrigation); fertilizer savings use the percentage you enter, since no single national figure applies to every crop and soil type. This excludes equipment financing costs, labor changes, and yield effects, which are not separately quantified in current public USDA data—consult your local extension office or USDA ERS regional reports for a farm-specific estimate.
Challenges and Opportunities
Crop monitoring adoption faces real friction points, documented alongside the growth figures above:
- Data Security & Privacy: Cloud connectivity and IoT deployment raise concerns about unauthorized access to proprietary farm data (BIS Research).
- Upfront Investment Costs: Hardware and multi-system integration are a real barrier, which is exactly why the adoption gap between large-scale (70%) and midsize (52%) farms exists in the ERS autosteering data.
- Technician & Skills Shortage: farmdoc daily’s analysis frames the constraint on further variable rate technology adoption less as cost and more as a shortage of qualified farm service technicians to install, calibrate, and maintain the systems.
- Data Volume & Analysis: Processing satellite, drone, and sensor datasets requires infrastructure and software that many smaller operations don’t have in-house.
Each of these has a corresponding opening:
- Subscription-based platform models (see the Farmonaut pricing table below) lower the upfront cost barrier that drives the large-vs-midsize adoption gap.
- Mobile app accessibility closes distance between rural operations and the software layer without requiring on-site infrastructure.
- Standardized APIs, such as Farmonaut’s satellite & weather data API developer docs, let third-party tools plug directly into existing farm systems.
Farmonaut & The Future of Crop Monitoring
Farmonaut’s platform is built around the adoption gaps documented above—specifically, the cost barrier that keeps midsize-farm adoption below large-farm adoption in the ERS data:
- Satellite-Based Crop Health Monitoring: Multispectral imagery tracks NDVI, soil moisture, and plant health to guide irrigation, fertilization, and pest management decisions.
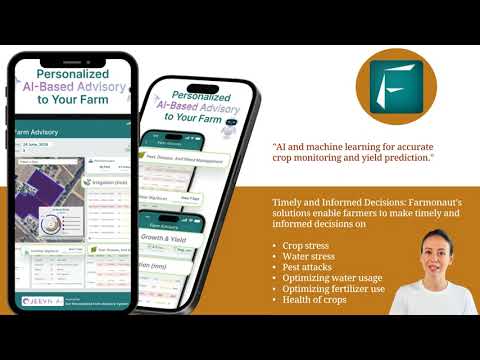
- AI-Driven Personalized Advisory: Jeevn AI delivers field-specific management recommendations and weather-based alerts in real time.
- Traceability Tools: Supply chain transparency from farm to retail, reducing fraud risk and supporting compliance documentation.
- Carbon Footprinting & Resource Tracking: Carbon footprinting tools and fleet/resource management support climate compliance reporting.
- Subscription-Based Access: The pricing table below lets operations of any acreage size choose a plan matched to their fields and crop cycles.
What to Watch: Where the Data Will Change Next
- USDA NASS Technology Use survey: Released annually, with the most recent full dataset (2023) published in early 2024; the next update is expected in early 2026. Check USDA NASS QuickStats directly for the current release, filtering by “farm operations,” “technology,” and your commodity of interest.
- FAA Part 137 operator counts and drone acreage: Updated monthly at the FAA Registry, with acreage figures published quarterly by industry trackers like AgDroneDirectory. The 1,710-operator and 16.4-million-acre figures above are both dated to 2025—re-check both before quoting them in a later year.
- Market sizing reports: Grand View Research, Research and Markets, and IMARC Group publish updated annual figures, with full prior-year data typically available in Q1 of the following year.
Farmonaut’s API for developers is one way to pull current field-level data directly rather than relying on annual survey snapshots.
Further reading:
Frequently Asked Questions
-
What is crop monitoring?
Crop monitoring is the continuous collection, analysis, and interpretation of field data—soil conditions, plant health, yield, pest and disease incidents, and weather—used to optimize yields, reduce resource waste, and support data-driven decisions.
-
How big is the crop monitoring market?
The US crop monitoring market was valued at $3.82 billion in 2025 and is projected to reach $4.44 billion in 2026, a 16.3% growth rate, per Research and Markets/TheInsightPartners. Global smart crop monitoring sizing differs by report scope—see the Straits Research, IMARC Group, and BIS Research figures cited above for global numbers.
-
What technologies matter most for smart crop monitoring?
Satellite imagery, IoT soil sensors, drone-based aerial monitoring, and AI/ML analytics for predictive advisories, plus precision applications like variable-rate fertilization. USDA ERS data shows guidance autosteering at 70% adoption on large US farms and 52% on midsize farms as of 2023.
-
What are the key technologies in precision agriculture robotics?
Guidance autosteering (70% large-farm adoption per USDA ERS 2023), autonomous and assisted spray drones (16.4 million US acres treated in 2025), variable rate application hardware, and sensor-fused autonomous navigation systems.
-
How much water can variable rate irrigation actually save?
A USDA ARS field study found 25% water savings with variable rate irrigation compared to uniform irrigation. See the full study via NCBI, linked above.
-
Is remote and satellite crop monitoring affordable for smaller farms?
Subscription-based platforms reduce the hardware investment that drives the adoption gap between large farms (70% autosteering adoption) and midsize farms (52%) in USDA ERS data. Farmonaut’s tiered subscriptions are one example built specifically to lower that barrier.
-
How do Farmonaut’s solutions support different user groups?
Individual farmers get real-time crop insights and advisory; agribusinesses get large-scale dashboard monitoring and resource planning; governments and lenders get crop area estimation and loan/insurance verification tools; corporates get blockchain-based traceability for supply chains.
-
How can I start using Farmonaut’s crop monitoring platform?
Sign up via the web, Android, or iOS app. Choose a subscription based on acreage and data update needs. Developers can integrate the API for real-time satellite and weather data access.
Conclusion: Where the Numbers Point
The US crop monitoring market’s move from $3.82 billion in 2025 to a projected $4.44 billion in 2026 tracks directly against measured field adoption: 70% of large-scale farms already run autosteering, 60% of corn and soybean acreage runs variable rate fertilizer, and documented field studies show 25% water savings from variable rate irrigation. None of that is speculative—it’s what USDA ERS, FAA records, and peer-reviewed field trials show today, with clear paths to check whether the numbers have moved by the time you’re reading this.
The gap left standing is the midsize-farm adoption lag—52% versus 70% on autosteering alone—and closing it is a cost-access problem more than a technology-availability one. Platforms structured around subscription access, rather than upfront hardware purchase, are the direct response to that specific gap.

 ITC
ITC Dirks Bros Farms
 Red August Group
 Farm Inc
 WeMe Global
 Agrotoken
 Blue BearX
 Insignito
 Croptimum
 DnCubed
 Field Capacity
 Indosistim Teknologi
 Liquify Digital
 CU Foods
 BeyondTech Global
 Rouge VC
 AgroGreen Dynamics
