

Midwest Agriculture: What Biotech Corn Actually Adds
Reviewed August 2026 against USDA ERS, USDA NASS and the National Academies’ review of genetically engineered crops.

Biotech traits are near-universal in Midwest corn — 92% of US corn acres carried a herbicide-tolerant trait and 87% carried an insect-resistant (Bt) trait in 2025, per USDA’s Economic Research Service — but they do not raise a hybrid’s yield ceiling. They protect yield that pests and weeds would otherwise take, and the size of that protection depends entirely on the pressure in your field. That distinction matters more than ever, because the 2025 US crop set a record 186.5 bushels per acre while Purdue’s Indiana budgets put full-cost breakeven between $4.90 and $5.60 per bushel — well above USDA’s $4.15 season-average farm price for 2025/26.
This page covers what the traits do, what the peer-reviewed evidence says about yield and sustainability, what irrigation contributed alongside genetics, and — most importantly — exactly where to pull fresher numbers than the ones printed here.
On this page
- Midwest agriculture by the numbers
- What “biotech corn” actually means, trait by trait
- Does biotechnology increase crop yield? The honest answer
- Corn trait sustainability: what is measured, what is not
- Irrigation technology and corn production gains
- Who regulates biotech products in the US
- The corn future: margins, acres and what would change them
- How to check every figure on this page
Midwest agriculture by the numbers
US farmers plant close to 90 million acres of corn a year, and Iowa and Illinois alone account for roughly a third of the crop, according to USDA’s Feed Grains Sector at a Glance (updated 7 May 2026). Ethanol takes nearly 45% of total corn use and feed about 40%; exports average about 15% of total use. That mix is why a Midwest corn decision is never only an agronomic decision.
For the 2025 crop, the University of Illinois farmdoc team reported the NASS county yield estimates on 12 May 2026: a record national average of 186.5 bushels per acre, Illinois at 214 bushels, and yields above 240 bushels in Stark, McLean and DeKalb counties. USDA’s May 2026 WASDE described the 2026/27 crop as down 6% from “last year’s record,” which puts the 2025 crop near 17.0 billion bushels and implies roughly 91 million harvested acres.
Now the other side of the ledger. Purdue’s Crop Cost and Return Guide (Michael Langemeier, 31 January 2025) projected corn breakeven prices of $5.60 per bushel on low-productivity soil, $5.27 on average soil and $4.90 on high-productivity soil, with a contribution margin of $173 per acre for rotation corn on average soil. Set that against the season-average farm prices from the May 2026 WASDE as summarised by Southern Ag Today (Biram and Stiles, 13 May 2026): $4.15 per bushel for 2025/26 and $4.40 forecast for 2026/27.
Two conclusions follow. First, a record yield and a losing year are entirely compatible — USDA’s Economic Research Service reported (8 April 2025) that corn producers netted about $11.60 per acre in 2023. Second, in that arithmetic, every input has to justify itself in bushels. That includes the trait package. For the wider regional picture, see our overview of Midwest agriculture and sustainable farming.
What “biotech corn” actually means, trait by trait
“Biotech corn” is not one product. It is a set of separately deregulated traits, usually sold stacked into a single hybrid. USDA ERS’s Adoption of Genetically Engineered Crops in the United States data product (updated 12 December 2025) reports that in 2025, 92% of US corn acres were planted with herbicide-tolerant seed, 87% with Bt insect-resistant seed and 84% with stacked seed carrying both. Bt corn went from about 8% of acres in 1997 to 19% in 2000 to 87% in 2025.
Here is the comparison that matters when a seed rep hands you a lineup. Each row separates what the trait does mechanically from what independent evidence says it delivers — and tells you where to get a number newer than this page.
| Trait family | What it does | Best independent evidence on yield | US corn adoption (vintage) | Where to get a fresher figure |
|---|---|---|---|---|
| Bt (insect-resistant) | Plant expresses Bacillus thuringiensis proteins against corn borers and rootworm | Meta-analysis in the National Academies’ 2016 review: Bt maize yielded 0.55 tonne/hectare more than non-Bt. But where European corn borer populations had collapsed, the Bt/non-Bt gap narrowed to 1.9% in 2010–2012 | 87% (2025) | USDA ERS GE adoption data product, revised annually |
| Herbicide-tolerant (HT) | Crop survives a specific herbicide, widening the application window | National Academies 2016: no direct yield advantage; HT contributes yield only “where weed control is improved” | 92% (2025) | Same ERS data product; pair with your own weed escape counts |
| Stacked HT + Bt | Both trait families in one hybrid, often with multiple Bt proteins | Benefit is the sum of the two above, not more; multiple Bt proteins are primarily a resistance-management tool | 84% (2025) | ERS data product; EPA registration documents per product |
| Drought tolerance | Bred or engineered water-stress buffering; sold across dryland and irrigated acres | Kansas field trials (Frontiers in Plant Science, 2016): +5–7% over non-DT hybrids above ~430 mm seasonal evapotranspiration; no significant advantage below 432 mm | 22% nationally; 42% Nebraska, 39% Kansas (2016) | USDA ARMS Crop Production Practices survey; ERS chart notes |
| Plant architecture (short-stature) | Shorter internodes, standability, in-season field access for split nitrogen | Journal of Environmental Quality (published 19 Nov 2025): 13% average cut in carbon intensity, range 3–28%; root volume +39% vs tall comparators; grain yields overlapping at 14.0–15.1 vs 14.5–15.0 t/ha | Not reported in ERS trait series (as of Aug 2026) | Vendor agronomy trial summaries; state extension strip trials |
| Gene-edited (no foreign DNA) | Targeted edits, e.g. CRISPR, that could in principle have arisen by breeding | No peer-reviewed multi-site Midwest corn yield dataset published as of August 2026 | Not tracked as a separate ERS category | USDA APHIS Biotechnology Regulatory Services exemption and confirmation listings |
Note the pattern: the traits with the largest adoption have the weakest claim on raw yield, and the trait with the newest sustainability evidence is not yet in the national adoption series at all. Our deeper treatment of how trait selection interacts with in-season data is in biotech innovation and precision farming.

Does biotechnology increase crop yield? The honest answer
The question “how does biotechnology increase crop yield” contains a hidden assumption worth dismantling, because it is the single most common misreading of the Midwest record.
The National Academies of Sciences, Engineering, and Medicine examined this directly in its 2016 report Genetically Engineered Crops: Experiences and Prospects. Its agronomic chapter compared rates of yield increase for maize, soybean and cotton in the decades before and after GE introduction in 1996 and found no evidence that GE crops had changed the rate of yield increase — no obvious change in the slope of the maize trend line.
That is not the same as saying traits do nothing. The same chapter reports Bt maize yielding 0.55 tonne per hectare more than non-Bt maize in meta-analysis, and a 39% reduction in insecticide quantity from Bt cotton and maize adoption. The resolution is mechanical: Bt and HT traits reduce losses. They do not lift the genetic ceiling. Where the pest is present, the trait pays; where area-wide suppression has already knocked the pest down, the same trait is a fixed cost. The Academies documented exactly that — in regions where European corn borer populations had fallen sharply, the yield difference between Bt and non-Bt hybrids narrowed to 1.9% in 2010–2012.
The yield ceiling itself has been moving for seventy years, and the credit belongs mostly to breeding, plant population and agronomy. Bob Nielsen’s historical corn yield analysis at Purdue (last revised February 2023) divides the record into three eras: open-pollinated varieties from 1866 to 1936 with essentially zero improvement and yields flat around 26 bushels per acre; early hybrid adoption from 1937 to 1955 at about 0.8 bushels per acre per year; and advanced genetics plus management from the mid-1950s onward at about 1.9 bushels per acre per year — a trend line that explains 93% of yield variability since 1956.
Read that chart before you read any trait brochure. The 2025 record of 186.5 bushels sits above the 1.9-bushel trend line, and the honest attribution is a favourable season on a large acreage — not a step change in genetics.
Corn trait sustainability: what is measured, what is not
“Corn trait sustainability” is a real and measurable category, but only for a few traits, and the measurement unit decides the answer. Per acre, a high-input corn system looks intensive. Per bushel, the same system can look efficient. Both are true; the claim you should distrust is one that does not state its denominator.
The strongest quantified case as of August 2026 is not a Bt or HT trait at all — it is plant architecture. A study in the Journal of Environmental Quality published 19 November 2025 (Dohleman, Kosola, Mueller and co-authors; open access via PubMed Central) modelled short-stature maize systems against commercially relevant tall comparators using 199 site-years of Midwest Corn Belt yield data from 2017 to 2022 and 11 site-years of root excavations from 2020 to 2023. It found carbon intensity of grain production reduced by an average of 13%, with a range of 3% to 28%, and greenhouse gas savings averaging 0.35 tonnes CO₂-equivalent per hectare per year across a 0.09–0.78 range. Root volume was 39% greater in short-stature hybrids. Notably, grain yields were comparable — 14.0 to 15.1 t/ha for short-stature versus 14.5 to 15.0 t/ha for tall — so the carbon gain comes from input management and standability, not from out-yielding.
Two other sustainability effects are well documented but poorly understood by growers:
- Insecticide displacement, not elimination. The National Academies’ 39% insecticide-quantity reduction figure covers Bt cotton and maize together. It is a quantity measure, not a toxicity or risk measure, and it does not net out seed treatments.
- Tillage substitution. HT traits made post-emergence weed control possible without cultivation, which is what enabled much of the Corn Belt’s move to reduced tillage. That link runs through the herbicide, not the gene — which is why it unwinds fast when resistance appears. See our field guides to conservation tillage and sustainable soil management.
The resistance clause nobody reads
Trait sustainability has a hard ceiling set by insect and weed evolution. The National Academies’ 2016 chapter is blunt: deploying crops with intermediate Bt toxin levels and small refuges “has sometimes resulted in the evolution of resistance in insect pests.” EPA’s Framework to Delay Corn Rootworm Resistance puts the obligation on both sides. Registrants must investigate reports of unexpected rootworm damage, apply uniform damage-level triggers across the biotech industry and run on-plant assays to confirm resistance; when resistance is confirmed, the mitigation action area is defined as half a mile around the resistant site. Growers are expected to scout, report unexpected damage to the trait supplier, and build a multi-year management plan with the company or an extension entomologist.
Practically: pyramided proteins plus crop rotation plus honest scouting is what keeps a Bt trait working. A stacked hybrid planted continuously into corn-on-corn is the fastest route to paying a trait premium for a protein your rootworm population has already defeated. Weed traits follow the same logic — see weed control strategies for the rotation side of that, and our notes on socially responsible agriculture programmes for the reporting side.
Will this trait package pay on your acres?
Enter your own premium, price and pest-pressure estimate; the calculator returns the bushels of protected yield the premium requires.

Irrigation technology and corn production gains
If you have met the sentence "improvements in irrigation technology throughout the region were followed by ______ gains in corn production" in a textbook or quiz, the word it wants is dramatic — or an equivalent such as substantial, large or significant. The region in question is usually the Great Plains and the High Plains, and the technology is centre-pivot sprinkler irrigation drawing on the High Plains (Ogallala) aquifer, which turned semi-arid rangeland into reliable corn ground from the 1950s onward.
The scale is documented. USDA NASS's 2023 Irrigation and Water Management Survey, released 31 October 2024, counted 212,714 farms irrigating 53.1 million acres and applying 81 million acre-feet of water — an average of 1.5 acre-feet per acre. Sprinkler systems covered 12.6 million more acres than gravity systems. Groundwater from on-farm wells supplied 54% of water applied, at an average well depth of 241 feet. Farms spent $3.3 billion on pumping energy and $3 billion on irrigation equipment, facilities and improvements in that year. Five states — Arkansas, California, Idaho, Nebraska and Texas — accounted for roughly half the irrigated acres and more than half the water applied. Nebraska is the Corn Belt entry on that list, and it is the reason Nebraska corn behaves differently from Iowa corn in a dry August.
That is also where biotech and irrigation trade off directly. USDA ERS's drought-tolerant corn chart (published 4 February 2019, from the ARMS Crop Production Practices survey) found DT corn at 22% of US planted corn acreage in 2016 but 42% in Nebraska and 39% in Kansas — the two states most exposed to declining well capacity. Drought tolerance is what growers buy when the aquifer or the allocation will not stretch further.
The trait has a measurable envelope. Kansas State field trials across four locations and six site-years in 2012–2013, published in Frontiers in Plant Science in 2016 by Adee, Roozeboom, Balboa, Schlegel and Ciampitti, found DT hybrids yielding 5–7% more than non-DT hybrids in high and medium evapotranspiration environments above about 430 mm seasonal ET, with the advantage appearing once yields dropped below 10.8 Mg/ha and averaging 0.6–1 Mg/ha in the low-yield range. Below 432 mm ET there was no significant difference. In plain terms: DT traits earn their premium in a moderately stressed season, not in a catastrophic one and not in a wet one. For the water-management side, see ways to boost water efficiency in agriculture.
Who regulates biotech products in the US
Three agencies split oversight of biotech products under the Coordinated Framework: USDA APHIS for plant-pest risk and movement, EPA for plant-incorporated protectants such as Bt proteins and for the herbicides paired with HT traits, and FDA for food and feed safety. A single stacked corn hybrid can therefore touch all three.
The USDA piece is unsettled. APHIS's 2020 rule at 7 CFR part 340 — widely known as the SECURE rule — was vacated by the US District Court for the Northern District of California on 2 December 2024, and confirmation responses issued before that date remain valid. As of August 2026 APHIS is operating under earlier regulatory provisions while it works through revisions. Because the terms of exemption for gene-edited plants sit inside that rule, this is the one item on this page most likely to have changed by the time you read it. Check the APHIS Biotechnology Regulatory Services pages for regulatory exemptions and confirmations, and search the Federal Register for "Movement of Certain Genetically Engineered Organisms," before relying on any statement about what qualifies as exempt.
The EPA piece is stable and enforceable, and it is the one that reaches your planter. Refuge and resistance-management terms travel with the seed tag and the grower technology agreement, not with general agronomic advice.
The corn future: margins, acres and what would change them
"Corn future" pulls two different searches — the futures contract and the outlook for the crop. On the outlook, USDA's May 2026 WASDE, as summarised by Southern Ag Today on 13 May 2026, forecast 2026/27 US corn at 95.3 million planted acres (down 3.5 million), a yield of 183.0 bushels per acre, production of 16.0 billion bushels (down 6% from the 2025 record) and ending stocks of 1.957 billion bushels, 185 million below the prior year, with a season-average farm price of $4.40 per bushel against $4.15 for 2025/26.
Decomposing that 1.0-billion-bushel step down separates the two levers, and it is worth seeing which one dominates.
Roughly 70% of the forecast decline is acreage, not weather. That is the market reasserting the margin gap from the first chart: at $4.15 realised and a $4.90–$5.60 breakeven band, corn acres move to something else. Three things would change the picture, and they are worth watching in this order:
- The season-average price against your own breakeven. Recalculate your breakeven from your own budget each winter and compare it to the WASDE forecast, not to the futures board.
- Ethanol and export demand. With ethanol near 45% of total corn use and exports about 15%, a policy or trade shift moves the price more than a trait launch moves the yield.
- Whether trait pricing tracks trait value. As Bt proteins lose efficacy in specific rootworm populations, the premium and the protection can drift apart. That is a field-level question, answerable only by scouting.
How to check every figure on this page
Numbers age. The method does not. This is the sequence to run, in order, when you want current values instead of the vintages printed above.
- Trait adoption. USDA ERS's GE crop adoption data product, revised annually — the 2025 figures cited here were posted 12 December 2025. It reports HT, Bt and stacked shares nationally and by state for corn.
- Your county's yield. USDA NASS Quick Stats covers 1870 to the present. Filter by commodity (corn, grain), location (your county) and year. Note that the number of counties receiving published estimates has been declining, so your county may not appear every year.
- Price forecasts. The WASDE report is released monthly by the World Agricultural Outlook Board and carries the season-average farm price forecast for the current and next marketing year.
- Your breakeven. Rebuild it from your own records; use the Purdue guide or your state extension budget as a cross-check, not a substitute. The relevant comparison is always your cost per bushel against the forecast price, at your actual yield.
- Sustainability metrics. Field to Market publishes crop-specific factsheets in its National Indicators Report, including one for corn for grain, with per-bushel and per-acre indicator trends. Download the factsheet rather than quoting a secondhand percentage — the denominator matters.
- Resistance status. Scout for unexpected damage, report it to your trait supplier as EPA's rootworm framework requires, and confirm with your state extension entomologist. There is no national dataset that will tell you whether your rootworm population has defeated your protein.
That six-step loop is the durable part of this article. Run it annually and you will always have a fresher answer than any summary — including this one.
Where satellite monitoring fits
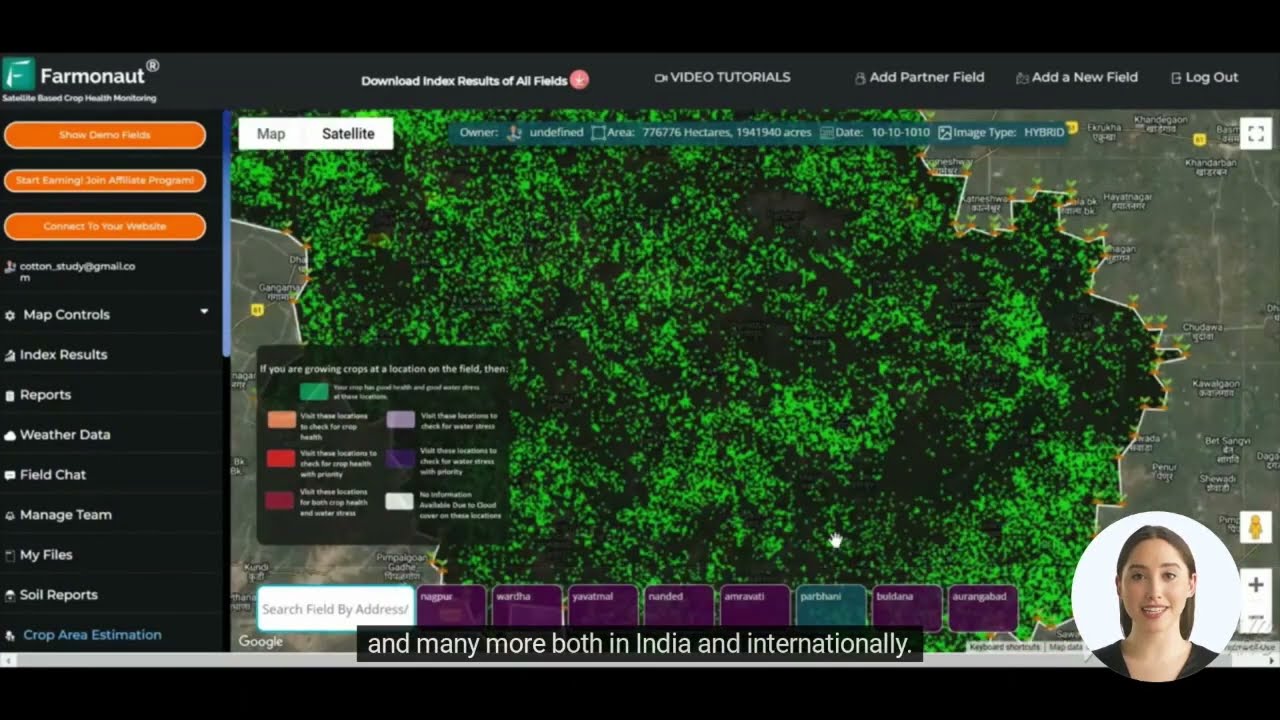
The gap the trait table exposes is informational: adoption is near-universal, so the trait is no longer a differentiator, and the remaining variance sits in field-level management. That is where in-season monitoring earns its keep. Farmonaut's multispectral satellite analysis tracks crop-health and moisture variation across a field between scouting visits, which is what turns "the trait should have handled it" into a located, dated observation you can act on.
Three concrete uses on traited corn acres:
- Verifying trait performance. Compare vigour patterns on a traited block against a lower-trait or refuge block on the same soil type, in the same season.
- Catching resistance early. Persistent, patchy stress inside a Bt block is exactly the "unexpected damage" EPA expects growers to scout for and report.
- Timing split nitrogen. Short-stature architecture only pays if you actually get into the field for in-season applications; zone maps tell you where the return is.
Developers can pull the same layers programmatically — see the Farmonaut satellite and weather API and the API developer documentation. For the longer view on where agro-tech crop science is heading, our piece on advanced agriculture tools covers the sensing side.




Frequently asked questions
What percentage of US corn is biotech corn?
In 2025, 92% of US corn acres carried a herbicide-tolerant trait, 87% an insect-resistant Bt trait and 84% both stacked together, per USDA ERS (data updated 12 December 2025). Because traits overlap, these figures cannot be added.
How does biotechnology increase crop yield?
Mostly by preventing loss rather than raising potential. Bt traits stop insect feeding damage; HT traits allow cleaner weed control. The National Academies' 2016 review found no evidence that GE crops changed the rate of yield increase in maize, while meta-analysis in the same report showed Bt maize yielding 0.55 t/ha more than non-Bt where pest pressure existed. Yield potential itself has advanced at about 1.9 bushels per acre per year since 1956, driven by breeding and agronomy.
Does drought-tolerant corn work?
Within a defined stress window. Kansas trials published in Frontiers in Plant Science (2016) found a 5–7% advantage above roughly 430 mm seasonal evapotranspiration and no significant advantage below 432 mm. Adoption reflects that: 42% of Nebraska and 39% of Kansas corn acres in 2016 versus 22% nationally.
Which Midwest state has the highest corn yield?
It varies by season, so check NASS Quick Stats for the year you care about. For the 2025 crop, farmdoc daily reported Illinois averaging 214 bushels per acre against a US record of 186.5, with Stark, McLean and DeKalb counties above 240.
Is biotech corn more sustainable?
On specific measured axes, yes — the National Academies documented a 39% reduction in insecticide quantity from Bt cotton and maize adoption, and short-stature maize systems cut carbon intensity 13% on average (range 3–28%) in the Journal of Environmental Quality study published 19 November 2025. Claims without a stated denominator and vintage should be treated as marketing.
Are gene-edited corn varieties regulated the same way as GE corn?
Not identically, and the US answer is in flux. The 2020 APHIS rule at 7 CFR part 340 that set out exemptions for certain edited plants was vacated on 2 December 2024, and APHIS has been operating under earlier provisions while it revises. Confirm the position with APHIS Biotechnology Regulatory Services before relying on any exemption claim.
Why did USDA forecast lower corn production for 2026/27?
Chiefly fewer acres. The May 2026 WASDE forecast 95.3 million planted acres, down 3.5 million, with yield easing from 186.5 to 183.0 bushels per acre and production at 16.0 billion bushels. On this article's arithmetic, roughly 70% of the drop is acreage rather than yield — a margin response, given breakevens of $4.90–$5.60 against a $4.15 realised price for 2025/26.

 Hayleys Agriculture
 Linx Agritech
 Adinet
 Save Your Soils
 YelloSkye
 GalaxEye Space
 Grandstream Algérie
 XOS Realty
 Geospatial Lab Africa
 Agro La Gándara
 HIPSAC
 ZOL Zimbabwe
 Juligerm
 AdBio
AdBio MISE Maroc
 NWNS
NWNS Red August Group
 Farm Inc
 WeMe Global
 Agrotoken
