
Normalized Difference Vegetation Index: 7 Shocking NDVI Benefits
“NDVI can detect crop stress up to 10 days before visible symptoms appear, enabling earlier intervention and improved yields.”
Table of Contents
- What is the Normalized Difference Vegetation Index (NDVI)?
- Understanding NDVI: Science, Calculation, and Interpretation
- NDVI Applications in Agriculture
- NDVI Applications in Forestry
- 7 Shocking NDVI Benefits
- Comparative Benefits Table: NDVI in Precision Farming
- How Farmonaut Empowers Precision Agriculture with NDVI
- NDVI Limitations and Complementary Technologies
- Advancements and Future of NDVI in Agriculture
- NDVI – Frequently Asked Questions
- Conclusion & Call to Action
What is the Normalized Difference Vegetation Index (NDVI)?
In today’s era of technology-driven agriculture and forestry, the Normalized Difference Vegetation Index (NDVI) stands as a transformative tool for assessing vegetation health, density, and vigor. By analyzing how plants interact with the red and near-infrared (NIR) portions of sunlight, this index provides actionable insights that empower us to make informed decisions in crop management, forest health assessment, and land monitoring.
As practitioners and advocates of precision farming, we are witnessing a paradigm shift: using satellites and remote sensing for vegetation and crop monitoring not only enables early detection of issues but also optimizes resource allocation for increased sustainability and profitability. In this comprehensive guide, we will explore the science, applications, and 7 shocking NDVI benefits that are revolutionizing farming worldwide.

Understanding NDVI: Science, Calculation, and Interpretation
What is the NDVI Calculation Formula?
At its core, the NDVI calculation formula is elegantly simple and rooted in plant physiology:
\[ \text{NDVI} = \frac{NIR – \text{Red}}{NIR + \text{Red}} \]
- NIR: Reflectance in the near-infrared spectrum
- Red: Reflectance in the red spectrum
This calculation exploits the fact that healthy vegetation absorbs most visible red light for photosynthesis and strongly reflects a portion of NIR light due to its cellular structure. By normalizing the difference between these two spectral bands, we obtain a value that correlates strongly with plant health and biomass.
How Do We Interpret NDVI Values?
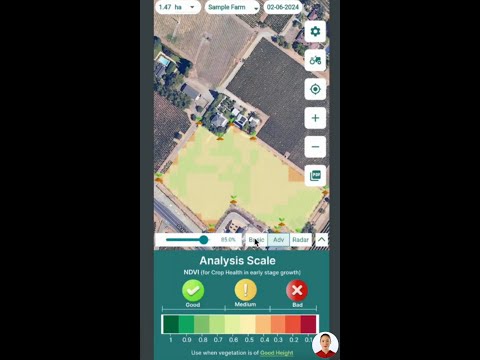
NDVI values range from -1 to +1, with higher values indicating healthier and denser vegetation. Here’s how to break down the meaning:
- -1 to 0: Non-vegetated surfaces—water bodies, bare soil, or artificial structures
- 0 to 0.1: Sparse vegetation or barren areas
- 0.1 to 0.3: Moderate vegetation—shrubs, grasslands
- 0.3 to 0.6: Healthy vegetation, typical of temperate/tropical forests
- 0.6 to 1.0: Dense, vigorous vegetation—often found in tropical rainforests
In agricultural contexts, these NDVI readings serve as early warning systems for us to identify stress, detect nutrient deficiencies, and monitor plant development stages.
NDVI Applications in Agriculture: Transforming Farm Management
“Precision farming using NDVI analysis can increase fertilizer efficiency by up to 30%, reducing costs and environmental impact.”
Leveraging NDVI in agriculture enables us to transition from reactive to proactive management, embracing precision farming with NDVI. Here are some of the critical applications:
1. Crop Growth Monitoring and Development Stages
- NDVI enables continuous monitoring of crop health and vigor, helping us observe growth trends, uniformity, and detect early-stage issues.
- With NDVI satellite data from Farmonaut, we can receive timely updates on vegetation stress and resource needs across large plots—right on Android, iOS, or web.
2. Targeted Nitrogen and Nutrient Management
- NDVI readings at critical crop growth stages correlate strongly with nitrogen uptake, enabling us to adjust fertilization for maximum efficiency and minimal environmental impact ([ACS Publications](https://acsess.onlinelibrary.wiley.com/doi/10.2134/agronj2019.03.0217?utm_source=openai)).
- This targeted approach means less fertilizer waste, healthier crops, and increased profitability.
3. Crop Yield Prediction with NDVI
- By combining historical yield data and early-season NDVI measurement, we can predict crop yields and plan for harvest and market logistics ([Bisolusi](https://www.bisolusi.com/post/use-of-normalized-difference-vegetation-index-ndvi-in-agriculture?utm_source=openai)).
- Farmonaut’s yield prediction tools use AI-driven analytics for even greater accuracy—enabling us to make data-driven decisions.
4. Precision Irrigation Management
- NDVI detects spatial variability in crop water needs; with satellite monitoring, we can precisely adjust irrigation practices to conserve water and ensure optimal crop conditions.
- This prevents over-irrigation or drought stress, directly enhancing resource efficiency.
5. Early Disease, Pest, and Stress Detection
- Lower NDVI readings in crop zones often indicate early stress, pest attacks, or disease outbreaks well before visual symptoms appear.
- By identifying these issues early, we can deploy timely, targeted interventions, minimizing crop loss and reducing input costs.
6. Farm Resource Allocation and Traceability
- High-resolution NDVI maps help us allocate labor, optimize machinery usage, and trace the history of a field for input applications.
- Interested in traceability? Farmonaut’s Blockchain-Based Traceability ensures transparent, verifiable records from sowing to harvest—bolstering supply chain integrity.
7. Enhanced Decision Support and Sustainability
- NDVI’s data-driven insights empower us to adopt best management practices, reduce waste, and support sustainable agriculture.
- Farmonaut offers AI-powered advisories and real-time resource management tools—making sustainability cost-effective for farms of every scale.


NDVI Applications in Forestry: Beyond Farmland
The potential of the Normalized Difference Vegetation Index extends well beyond agricultural lands into the stewardship of forests, grasslands, and protected ecosystems. Here are three vital forestry applications:
-
Forest Health Assessment: Continuous NDVI monitoring enables us to:
- Detect disease and pest outbreaks swiftly
- Assess forest vigor, density, and recovery following disasters or human impact
- Maintain biodiversity and ecosystem services
-
Deforestation & Land Use Change Detection:
- NDVI satellite data helps monitor forest cover loss, fragmentation, and the spread of invasive species
- Data-driven insights inform conservation efforts and policy
-
Estimating Forest Biomass & Carbon Stocks:
- NDVI, paired with ground data, is instrumental for estimating above-ground biomass—crucial for carbon offset and climate change assessments
- Farmonaut’s Carbon Footprinting platform offers real-time carbon tracking for land managers and corporates


7 Shocking NDVI Benefits: Why NDVI is Indispensable in Modern Farming
The advantages of deploying NDVI surpass mere observation—they redefine how we manage land for higher profit, sustainability, and resilience. Here’s how:
- Early Detection of Crop Stress and Issues: Uncover threats like disease, pest, or water stress before they escalate.
- Facilitated Precision Fertilizer and Nitrogen Management: Maximize yield with minimal chemical use.
- Optimized Yield Prediction and Planning: Leverage NDVI trends for accurate, early yield forecasts.
- Efficient Irrigation Management: Conserve water by identifying soil moisture variability and targeting dry spots.
- Forest Conservation and Deforestation Monitoring: Protect forests, manage resources, and track land use changes with satellite-driven consistency.
- Carbon Stock Estimation: Employ NDVI-derived data for ecosystem services and environmental compliance.
- Resource Optimization & Decision Support: Drive profitability and sustainability with AI-backed insights for optimal machinery, labor, and input allocation.
Comparative Benefits Table: NDVI in Precision Farming
| NDVI Benefit | Description | Estimated Impact on Yield (%) | Practical Application Example |
|---|---|---|---|
| Early Crop Stress Detection | NDVI detects vegetation health problems (stress, disease) up to 10 days before visible signs. | 5–15% yield increase | Spot declines in NDVI in wheat, enabling early fungicide application before fungal outbreak spreads. |
| Precision Nitrogen & Nutrient Management | Correlates NDVI readings at development stages with crop nitrogen status, guiding targeted fertilization. | 5–30% cost & input savings | Apply nitrogen only where NDVI reveals deficiency, reducing fertilizer runoff and expenses. |
| Yield Prediction & Planning | Links seasonal NDVI patterns with historic yields for early, accurate crop production forecasts. | 10–25% improvement in planning accuracy | Using vegetative NDVI in rice to estimate total harvest, streamlining supply chain logistics. |
| Efficient Irrigation Management | Identifies within-field variability—directing irrigation to only water-stressed zones. | 10–20% reduction in water usage | Targeted drip irrigation in maize fields; avoid over-watering based on NDVI maps. |
| Forest Health & Deforestation Monitoring | Tracks forest cover loss, recovery, & pest outbreaks for conservation/management planning. | Up to 20% reduction in undetected loss | Monitor recovery in burned tropical forests; detect illegal logging with satellite NDVI. |
| Carbon Stock Estimation | NDVI measures forest/crop biomass, aiding carbon footprint and climate offset programs. | Supports 5–15% improvements in carbon estimation | Calculate carbon sequestration potential of a eucalyptus plantation for market reporting. |
| Resource Optimization & Decision Support | Improves allocation of labor, inputs, and machinery based on spatial NDVI patterns. | 15–30% increase in resource productivity | Farm manager prioritizes pest scouting & scout allocation where NDVI drops are detected. |
For large area monitoring, Farmonaut’s Large-Scale Farm Management App makes tracking multiple fields and teams easier—and with Fleet Management Tools, you can optimize machinery routes for even greater efficiency.
How Farmonaut Empowers Precision Agriculture With NDVI & Remote Sensing
Farmonaut—as a leading agricultural technology platform—delivers real-time crop analysis and vegetation health monitoring through NDVI, accessible for individual farmers as well as large agribusinesses, NGOs, and governments.
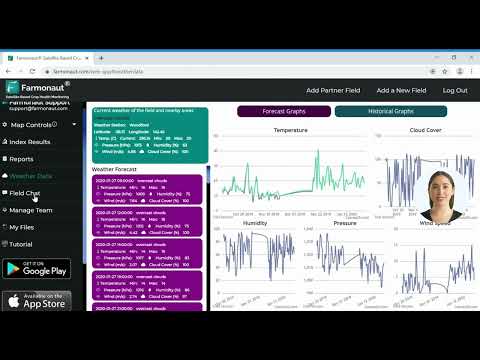
- Satellite-Based NDVI & Crop Monitoring: Multispectral data for NDVI analysis, soil moisture visualization, and crop development trends—accessible via web, Android, and iOS apps.
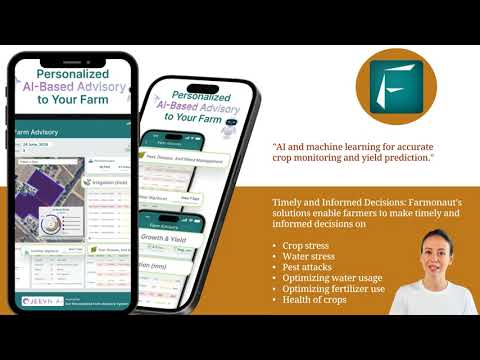
- AI & Machine Learning Insights: Farmonaut’s exclusive Jeevn AI advisory system delivers personalized, actionable crop recommendations based on NDVI and atmospheric data, helping us boost farm productivity and optimize yields.
- Blockchain-Based Traceability: Secure traceability of agricultural produce for food safety, supply chain transparency, and quality assurance with Farmonaut’s traceability modules.
- Carbon Footprint Tracking: Track your farm’s carbon emissions and participate in carbon offset programs with real-time carbon footprint dashboards.
- Resource and Fleet Management: Manage vehicles and field logistics with smart software to maximize machine uptime and reduce operational costs—see more about Fleet Management!
- Loan & Insurance Verification: For financial institutions, satellite-based crop verification reduces fraud, streamlines access to crop loans and insurance.
- API Access: Do you need NDVI or remote sensing for vegetation in your apps? Access Farmonaut’s Satellite & Weather Data API — seamless integration for devs and businesses! (API Docs)
Farmonaut operates a flexible, subscription-based model. Choose your package, scale as needed, and unlock advanced NDVI insights with or without expensive drones or sensors.
NDVI Limitations & Complementary Technologies
While the strengths of the Normalized Difference Vegetation Index are many, it’s vital for us to acknowledge its bounds:
- Saturation in Dense Vegetation: NDVI may lose sensitivity in tropical rainforests or dense crop canopies; subtle differences in health aren’t always apparent.
- Atmospheric Interference: Dust, clouds, and atmospheric conditions can distort NDVI data.
- Soil and Background Effects: Early stage crops, or regions with bare soil, may show misleading NDVI readings due to soil reflectance.
To address this, indices like the Enhanced Vegetation Index (EVI) are sometimes used—they compensate for soil and atmospheric noise and offer more accurate assessment in tricky conditions.
Tip: For the most accurate assessments, combine NDVI with local field checks, alternate indices like EVI, and historical farm knowledge.
Future of NDVI and Remote Sensing for Vegetation Monitoring
The evolution of NDVI continues! Integrating NDVI, LiDAR, and hyperspectral imaging with AI is set to unlock even richer vegetation insights:
- Higher-Resolution Data: Better sensors enable plant-level NDVI assessments at sub-meter scales.
- Machine Learning: Automated interpretation of NDVI data enables precise forecasts, targeted interventions, and historical trend analysis.
- Real-Time AI-Powered Advisories: Combined with real-time weather and satellite feeds, platforms like Farmonaut’s Jeevn AI will expand hyper-local, personalized recommendations for farmers.
- Ultra-Scalable Solutions: APIs, mobile apps, and web dashboards democratize access to precision farming with NDVI—no longer just for large corporations, but for every farmer, globally.
At Farmonaut, our mission is to make these tools affordable and accessible to all—empowering a smarter, more resilient agricultural future.
NDVI: Frequently Asked Questions
What is NDVI and Why is it Important?
The NDVI, or Normalized Difference Vegetation Index, is a satellite-derived measure of vegetation health and density. It is vital for precision farming, crop management, and forest monitoring, as it reveals stress, growth stages, and productivity trends that are otherwise invisible.
How Accurate is NDVI in Predicting Crop Yield?
NDVI is a strong leading indicator of crop yield, especially when measured at key growth stages and paired with historic yield data. It enables early yield planning and targeted interventions that can prevent losses and optimize profits.
How Often Should NDVI Data Be Monitored?
Ideally, NDVI data should be monitored weekly, or as often as satellite updates allow. More frequent monitoring allows us to detect issues early and make timely decisions.
Can NDVI Be Used in All Types of Farming?
Yes! NDVI is applicable across arable crops, orchards, forestry, grasslands, and even urban landscaping. Its adaptability and wide scale make it the backbone of modern vegetation health assessments.
What Tools or Apps Can I Use for NDVI Crop Monitoring?
Farmonaut provides a user-friendly, satellite-based platform for NDVI analysis, available via web, Android, and iOS apps. The Farmonaut platform offers real-time crop health monitoring, resource management, and much more!
Is NDVI Data Available For My Region?
Yes—Farmonaut covers the globe! Whether you’re in India, Africa, Europe, or the Americas, you can access NDVI satellite data through our platform.
How Do I Start with NDVI Monitoring?
Ready to begin? Register on the Farmonaut Web App or download via Android / iOS to set up your fields, receive NDVI reports, and unlock smarter decisions today.
Conclusion: Embrace Precision Farming with NDVI and Farmonaut
The Normalized Difference Vegetation Index is more than just a metric—it’s a strategic tool for modern, data-driven agriculture and forestry. With NDVI and allied technologies, we can assess crop and forest health, predict yield, mitigate risks, and optimize every facet of resource application. This dramatically enhances sustainability and economic returns for farms of every scale, and protects forests from degradation.
Farmonaut bridges the gap between advanced satellite technology and practical, everyday farming—making NDVI-based health monitoring, resource management, and sustainability accessible for all. Whether you’re a smallholder monitoring a single plot or a manager overseeing thousands of hectares, Farmonaut empowers you to make the best possible decision—every day, every season.


