

Plant milks · Supply chain guide
Almond Milk Supply Chain: Is It Bad for the Environment?
Almond milk uses about 371 liters of water per liter, against 628 for dairy and 48 for oat, and it has the lowest emissions of the five milks compared (Our World in Data, using Poore and Nemecek, 2018). The US grows about 73% of the world crop forecast for 2026/27, almost all of it in California (USDA).
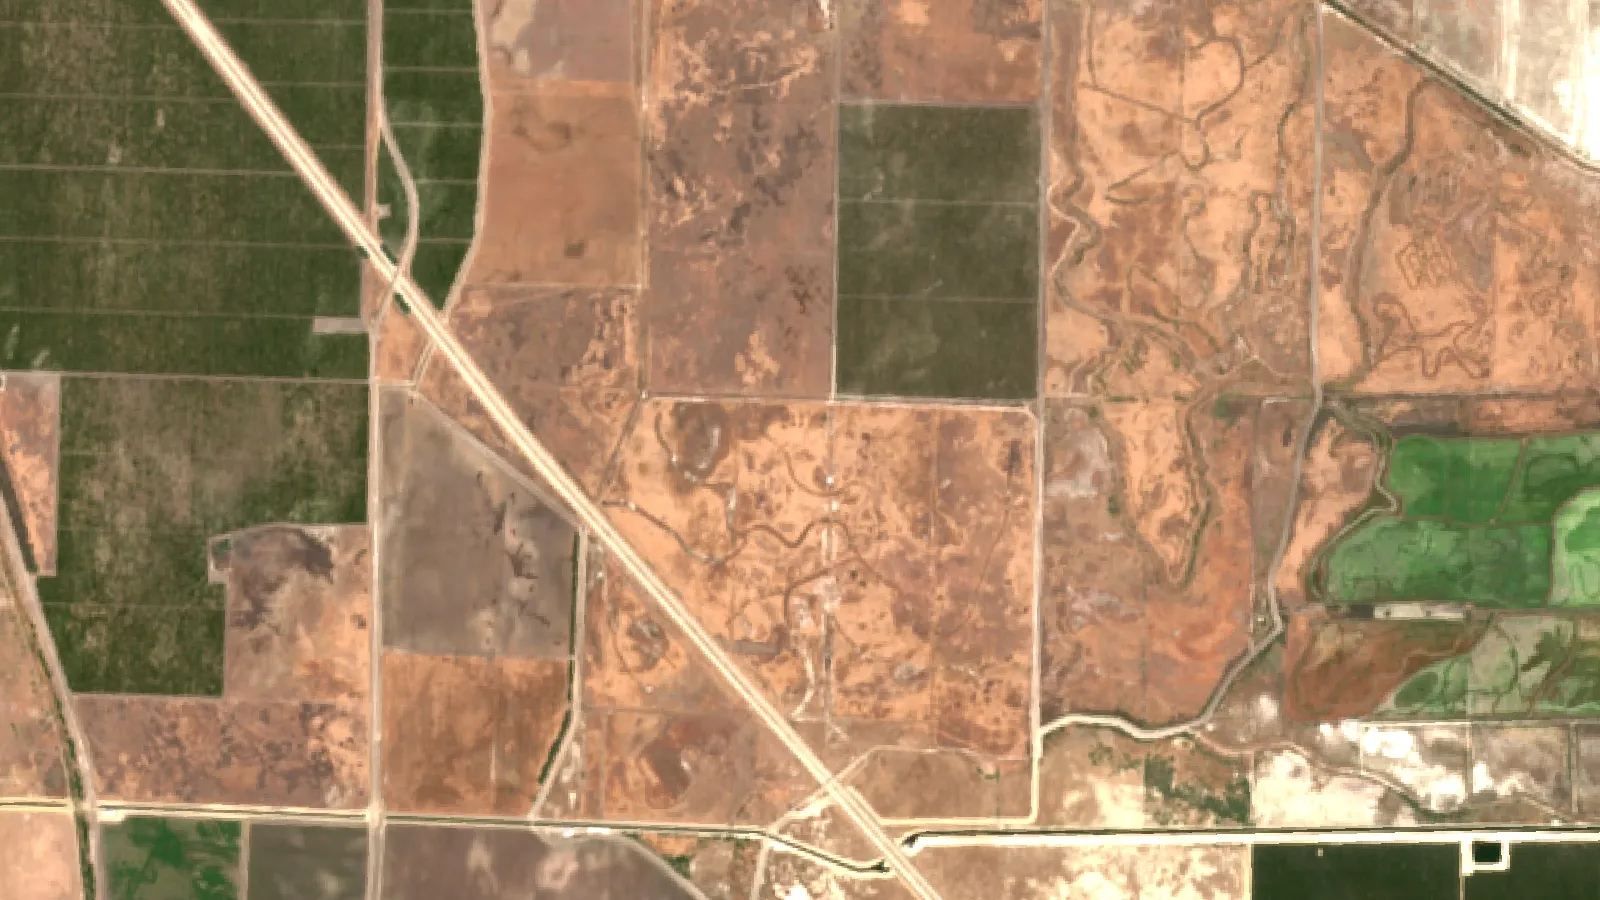
Key takeaways
- Per liter, almond milk uses about 371 L of water and emits 0.70 kg CO2e. Dairy is 628 L and 3.15 kg (Poore and Nemecek, 2018).
- Among the plant milks compared, almond uses the most water and has the lowest emissions.
- California’s almond industry uses almost three-quarters of managed US honey bee colonies (USDA ARS, undated page with acreage data to 2014).
- Bearing acres fell to an initial 1,385,870 in 2026, the first drop since 1995 (Land IQ via the Almond Board).
- USDA forecast the 2026 California crop at 2.7 billion pounds, down 1 percent (May 2026).
In this article
- What the almond milk supply chain looks like
- Why "is almond milk bad for the environment" has several answers
- Water: California, drought and your carton
- Almond milk compared with dairy, oat, soy and rice
- Are almond trees themselves the problem?
- Crop size, exports and the almond milk shortage question
- Lower-impact choices along the supply chain
- Questions to ask about one almond supply
- How growers track water in the almond supply chain
- FAQ
- The bottom line
The almond milk supply chain uses less water and emits far fewer greenhouse gases than dairy, yet it is the thirstiest plant milk measured: about 371 liters of water per liter of milk, against 628 for dairy and 48 for oat (Our World in Data, using Poore and Nemecek, 2018). So is almond milk bad for the environment? On water, it can be. On carbon and land, it does well. Where the water is taken matters as much as how much is used, and nearly all US almonds come from one state.
This page follows a carton back along each link, from bee hive to shelf, and shows which link drives which impact. It uses dated figures on orchards, crops and exports. The calculator lets you compare two milks using your own numbers.
What the almond milk supply chain looks like
A carton passes through more hands than the short ingredient list suggests. Each stage has its own environmental question, so a single verdict on “almond milk” hides a lot.
Infographic
From bloom to carton in 6 steps
- 1PollinationHives are brought in for bloom.
- 2OrchardIrrigation and inputs through the season.
- 3HarvestNuts come off from mid-August to October.
- 4HullingHulls go to dairy feed; kernels move on.
- 5TradeAlmonds are sold at home or exported.
- 6Milk plantBlended with water, packed and shipped.
- Bees. Hives arrive for bloom. In California the almond industry uses almost three-quarters of all managed US honey bee colonies, brought in for a short window (USDA Agricultural Research Service, undated page whose acreage data end in 2014).
- Orchard. Trees are irrigated, fed and protected from pests through the season. This is where the water footprint builds up.
- Harvest. Nuts come off from mid-August through October (USDA ERS Fruit and Tree Nuts Outlook, March 2026).
- Hulling and shelling. The hull and shell come off here. The Almond Board says all California almond hulls now go to dairy feed, so one co-product ends up back in the dairy chain. The Board also says hulls can replace alfalfa hay in dairy diets, and it credits this with saving water. That is an industry estimate.
- Export or domestic sale. Shelled almonds move to food makers at home and abroad.
- Milk plant and carton. Almonds are blended with water and other ingredients, packed, chilled or made shelf stable, and shipped to stores.
The farm stage likely drives the water story, while the milk plant mostly adds the water you see on the label. Crop statistics track almonds in general, not the part that becomes milk, so the crop and export numbers below describe the whole crop.
Why “is almond milk bad for the environment” has several answers
People ask this question from several angles, and they are not quite the same question. Searches about farms and trees concern the orchard: irrigation, soil and pesticide use. Searches about almond production concern the raw crop. Searches about why almond milk is not sustainable usually concern the product on the shelf. The answer shifts slightly with each version:
- The orchard: heavy irrigation in a dry state, plus the biodiversity trade-offs of any large single-crop planting.
- The raw almond: the often-repeated figure is 1 gallon of water per nut. The Almond Board quotes it as a footprint measure, and sets it beside 5 gallons for a walnut and 660 for a hamburger.
- The milk: a drink that is mostly water, which is why the footprint per liter surprises many readers given how little nut is inside.
Water: California, drought and your carton
How much water, and where it comes from
US almonds are grown almost exclusively in California. A USDA ERS chart from 2019 put them at nearly 80 percent of the global supply. The share has slipped since: the USDA FAS Tree Nuts report of October 2026 forecasts 1.22 million metric tons (shelled) of a 1.67 million ton world crop for 2026/27, or about 73 percent by our arithmetic.
Chart
Freshwater used per liter of milk
Liters of water per liter of drink, global averages
That concentration matters because California’s water is not dependable. The federal drought update of 27 April 2026 reported 65% of the state as Abnormally Dry, after a dry and warm March with record-breaking heat. Its April 1 snow water equivalent was the second lowest on record for the state, in records going back to 1981. Conditions shift week to week, and NOAA’s California drought page has the latest map.
Growers have changed how they irrigate. The Almond Board’s water page says over 80% of California almond farms use microirrigation, and that farmers cut water per almond by 33 percent between the 1990s and the 2010s. In 2018 the industry set a goal of a further 20% cut by 2025, and by 2022 it reported three-quarters of that goal met. The page gives no final 2025 result. These are the industry’s own figures. For growers, our guide to practical steps for cutting irrigation water use covers the same ground on any irrigated farm.
Why the number per liter looks so high
The 371 liter figure covers the whole chain, and Our World in Data does not split it by stage. Growing the nuts is likely the main part, given the irrigation the crop takes, but that is our reading, not a published split. Almond content can be low: a 2015 FoodNavigator report on a US lawsuit noted that the UK website for Almond Breeze listed almonds at 2%. US packs did not disclose a percentage then. Ingredients are listed by weight, so the position of almonds on the list gives a rough guide.
To picture 371 liters: it is about 98 gallons. EPA WaterSense puts a standard showerhead at 2.5 gallons per minute, so one liter of almond milk carries the water of about 39 minutes under that shower. The comparison is rough, because irrigation water and tap water are not the same resource.
Not all water counts the same way
Studies count water differently, and that explains many arguments online. The Poore and Nemecek figures on this page report freshwater use. The older Mekonnen and Hoekstra crop water footprint report gives a global average of 16,095 liters per kilogram of shelled almonds, split into rain (green), irrigation (blue) and pollution-dilution (grey) water. Only about a quarter of that total is blue, by our arithmetic. Global averages also say little about one California orchard. When you see a very large almond number, check which kinds of water it includes.
Almond milk compared with dairy, oat, soy and rice
“Plant milk beats dairy” is true on average, but the ranking among plant milks depends on the measure you pick. Our World in Data’s summary says cow’s milk causes around three times the emissions, uses around ten times the land and two to twenty times the freshwater of the alternatives. The Earth911 review of the same data calls almond the carbon winner and the most water-intensive plant milk.
| Milk (per liter) | Water (L) | CO2e (kg) | Land (m²) | Eutrophication (g PO4e) |
|---|---|---|---|---|
| Dairy | 628 | 3.15 | 8.95 | 10.65 |
| Almond | 371 | 0.70 | 0.50 | 1.50 |
| Rice | 270 | 1.18 | 0.34 | 4.69 |
| Oat | 48 | 0.90 | 0.76 | 1.62 |
| Soy | 28 | 0.98 | 0.66 | 1.06 |
Almond has the lowest emissions of the five and the second lowest land use, after rice. Soy has the lowest water use and eutrophication. Oat is low on water, though it has the largest land figure of the plant milks. Coconut milk is not in this comparison, so check a brand’s own life-cycle study if you need a figure for it.
So on the carbon footprint of almond milk vs cow milk, almond emits less than a quarter as much per liter. On almond milk vs cow milk water usage, it uses about 59% of dairy’s figure, by our arithmetic. These are global averages in a dataset built from 2013 values (Our World in Data), not figures for one brand. Protein and nutrition differ between these drinks, and per-liter comparisons do not capture that.
Calculator: compare two milks
The defaults compare almond with rice milk, the closest plant milk on water, because that pair shows the trade-off clearly: one saves water and the other saves carbon. Change the values to any pair in the table.
Chart
Water and emissions do not rank milks the same way
Per liter of drink: water (L) across, kg CO2e up
Try the numbers for your own farm below.
Calculator
How do two milks compare over a year for your household?
Enter how much you drink and the figures for any two milks.
- Milk A water per year: 38,584 L
- Milk B water per year: 28,080 L
- Difference as shower time: 18.5 hours
- Extra emissions from Milk B: 49.9 kg CO2e
Example values only, not a benchmark. Defaults use global averages for almond (Milk A) and rice (Milk B) from Poore and Nemecek (2018) via Our World in Data; replace them with any row in the table. Shower flow is EPA WaterSense’s figure for a standard showerhead. A positive result means Milk B uses less.
Are almond trees themselves the problem?
Set the milk aside. This is the question behind “are almond farms bad for the environment”. Orchards in the Central Valley are large and grown as one crop, so they carry familiar trade-offs:
▶ A plain guide to plantations vs farms, including monoculture risk. · 4:29
- Less variety on the farm. One tree species holds the same ground for many years, unlike rotated annual crops.
- Dependence on bees. USDA says almonds are almost completely dependent on honey bees, and bloom draws colonies from across the country. Weather matters too: USDA ERS reported that cool, rainy spells during February 2026 bloom reduced bee activity in some orchards.
- Pest and nutrient inputs. Orchards use fertilizer and pest control through the year. UC IPM’s almond guidelines set out monitoring and nonpesticide options as well as pesticides. Check the product label and local rules, and get professional advice before applying anything.
- Inflexible water demand. Annual crops can be left unplanted in a dry year. Permanent trees still need water to survive, which limits a grower’s choices during a drought.
Other permanent crops in the same region face similar structural issues. The difference for almonds is scale. Land IQ’s survey, published by the Almond Board, estimated 1,505,997 total almond acres in 2025 and 1,401,097 bearing acres, including 19,927 potentially abandoned (Almond Board, November 2025). Its survey combines field checks, remote sensing and AI, with a stated accuracy of 98.8%.
The almond footprint is no longer growing in acres. Total acreage fell four years in a row through 2025, and the April 2026 initial estimate put bearing acres at 1,385,870, the first drop since 1995. Orchard removals have been large each year, as the next chart shows.
Buyers who need to check how one supply is farmed, rather than rely on a regional average, sometimes use a product traceability platform to record where a harvest came from.
Chart
California almond orchard removals
Acres removed; the last bar is from an initial estimate
Crop size, exports and the almond milk shortage question
The crop itself is steady rather than scarce. The USDA forecast of May 2026 put the California harvest at 2.7 billion pounds, down 1 percent, with yield of 1,940 pounds per acre. That estimate comes from a survey of around 500 growers.
Estimates do move. In July 2025 USDA’s Objective Measurement Report forecast 3.0 billion pounds for 2025, yet the May 2026 forecast of 2.7 billion, described as 1 percent lower, points to a 2025 crop well under that. The Almond Board has since voted to stop funding the July report, so the May forecast is the only NASS report for the 2026 crop year. USDA keeps its releases on the California Almond publications page.
Exports take the larger share of the crop. In metric tons, FAS forecasts record US shipments of 960,000 tons (shelled) in 2026/27, against US consumption of 300,000 tons, and the European Union is the top import market at a forecast 275,000 tons. So much of the water used in California leaves the country inside the nut, and the US carton is only one part of the demand. Exports also draw on stocks, so read the two lines in the chart as a trend, not as a balance sheet. Other suppliers are growing: FAS forecasts larger crops in the European Union and Australia for 2026/27.
US demand has grown over the long term. USDA ERS reports that per person availability of almonds reached 1.9 pounds (shelled) in 2024/25, and that the 2022/23 to 2024/25 average is double the level of the early 2000s. The recent trend is softer: FAS shows US consumption falling from about 357,000 metric tons in 2021/22 to a forecast 300,000 in 2026/27.
These figures do not show a shortage of the nut, though supply is tightening: FAS forecasts US ending stocks of about 188,000 metric tons in 2026/27, about half the 2021/22 level of about 380,000. They cannot explain an empty shelf in one store, since that can come from any later link in the chain.
Chart
US almond production and exports
Thousand metric tons, shelled basis; 2026/27 is a forecast
Lower-impact choices along the supply chain
No plant milk here is impact-neutral, and the “best” choice depends on which resource is scarcest where you live.
- If water is your concern: oat and soy have much lower water figures than almond in the table above.
- If land use is your concern: rice and almond have the smallest land figures. For soy, ask where it was grown, since the concern is expansion onto cleared land rather than the crop itself.
- If greenhouse gases are your concern: almond has the lowest figure in the table. “Worst plant milk for water, best for carbon” is a fairer headline than a blanket “bad for the environment”.
- If you want to keep drinking almond milk: the footprint likely depends most on where and how the nuts were grown, not by the marketing on the carton. Ask brands for life-cycle data and for where their almonds come from.
Companies that must report the footprint of a plant-milk chain, rather than rely on the averages here, can work with a carbon footprinting service or commission their own life-cycle study.

▶ Six simple steps into precision agriculture, for farms starting small. · 4:18
Questions to ask about one almond supply
Averages only go so far. A food buyer or a careful shopper can ask a supplier these questions, and a grower can prepare answers to them:
- Where were the almonds grown? A basin under groundwater pressure is a different case from one with a steadier surface supply.
- How are the trees irrigated? Ask about microirrigation and how the schedule is set.
- What happens to the co-products? Hulls and shells have uses, so they should not be counted as waste by default.
- How much almond is in the drink? A higher share means more of the farm footprint per liter, and usually more of the nut you are paying for.
- Is there a life-cycle study? Ask for its boundaries, its water method and its year.
How growers track water in the almond supply chain
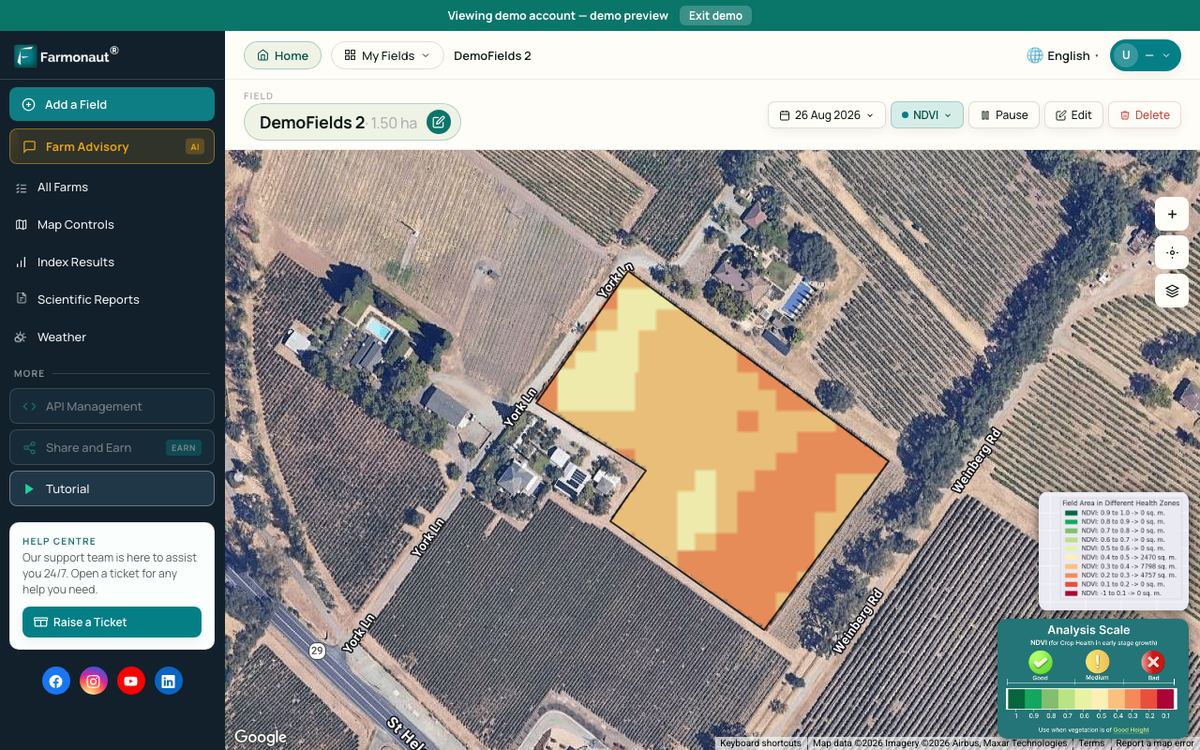
For growers, the useful question is which block needs water this week. Soil moisture meters and precision scheduling are among the tools the Almond Board names for its water goal. Satellite imagery adds a field-wide view of canopy change, which helps show where to look first. A satellite shows that vegetation has changed, not why, so someone still walks the row.
Farmonaut offers satellite crop monitoring for irrigated orchards and other crops, with a large-scale farm management dashboard for operations with many blocks. Developers can use the satellite and weather API and its developer documentation.
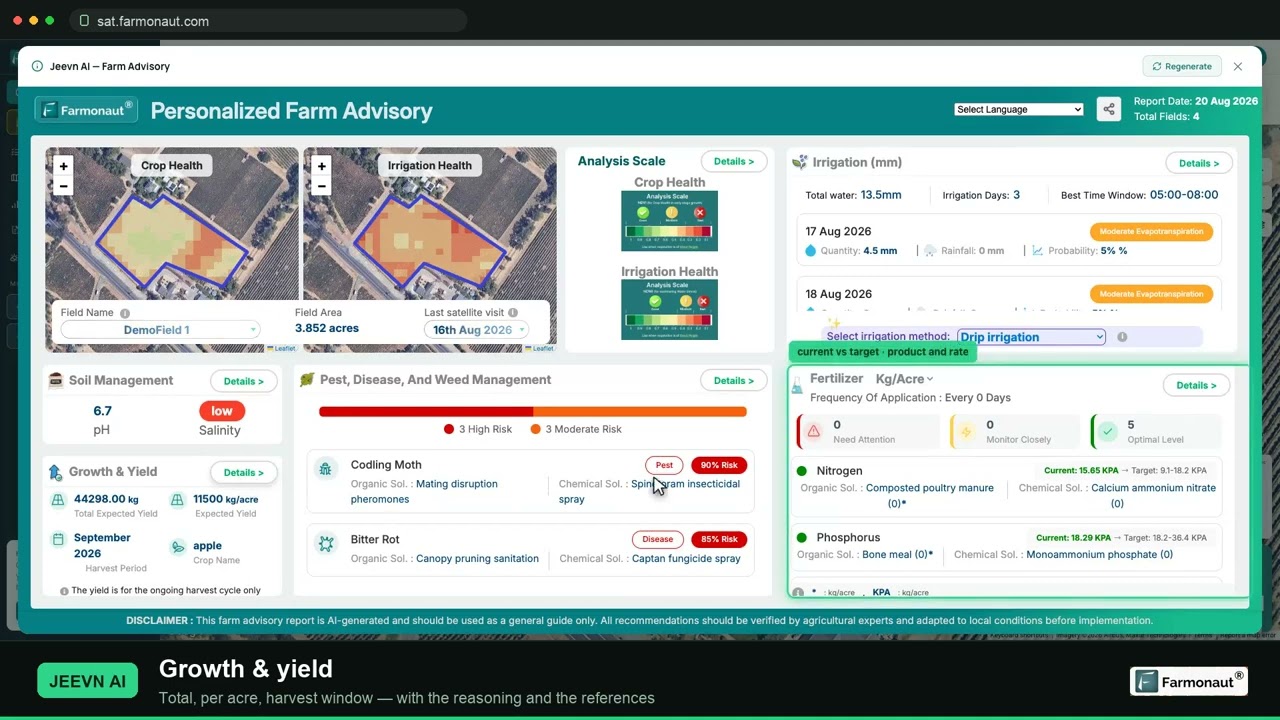
▶ A walkthrough of satellite crop monitoring: reading NDVI and pulling a field report. · 19:36
FAQ
Why isn’t almond milk sustainable?
The main objection is water. At 371 liters per liter of milk it uses more than any other plant milk in the Poore and Nemecek data, and the water is largely drawn in a drought-prone state. On carbon and land it does well, so “not sustainable” is too broad a label.
Is almond milk better for the environment than dairy milk?
On every measure in the table, yes. Per liter it uses about 59% of dairy’s water and emits less than a quarter of its greenhouse gases, with far less land. Nutrition differs, which matters for some diets.
Are almond farms bad for the environment?
They carry the trade-offs of large single-crop orchards: heavy irrigation, reliance on trucked-in bees and year-round inputs. Their size makes those effects large in total, though bearing acres fell in the 2026 initial estimate.
Is almond production bad for the environment, separate from the milk?
Whole almonds and almond milk share the same farm footprint. Eating whole nuts avoids the dilution in the milk but not the water used to grow them.
Is there an almond milk shortage?
The crop data does not point to one. USDA forecast a 2026 California crop only 1 percent smaller, and FAS expects record US exports in 2026/27, though US stocks are forecast to fall. Check USDA’s next release for later figures.
Which plant milk has the lowest impact?
None wins on every measure. Soy is lowest on water and eutrophication, almond on emissions, rice on land. Oat is low on water but has the largest plant-milk land figure. Pick based on the resource that worries you most.
The bottom line
Almond milk is neither a villain nor blameless. It trades a low carbon footprint for the highest water use among the plant milks in the 2018 study, drawn mainly from one drought-exposed state. The supply side is shifting too, with fewer California acres and more almonds from Australia and Europe. To recheck the facts, go to USDA’s almond publications, NOAA’s drought pages and the Almond Board’s water page, because each changes over time.
Related pages on our site: crop traceability, carbon footprints, irrigation water efficiency.
Farmonaut crop monitoring
See your own orchard from space
Check canopy changes across your blocks with satellite monitoring.



Keep reading


Sources
- Our World in Data, Environmental footprint of milks (from Poore and Nemecek, 2018): ourworldindata.org
- Our World in Data, Dairy vs plant-based milk (2022): ourworldindata.org
- Earth911, The climate impacts of milks: earth911.com
- USDA ARS, What happens to honey bees: ars.usda.gov
- USDA ERS, Fruit and Tree Nuts Outlook FTS-384 (March 2026): ers.usda.gov
- USDA ERS, Chart of Note on farm exports (2019): ers.usda.gov
- USDA FAS, Tree Nuts: World Markets and Trade (October 2026): apps.fas.usda.gov
- USDA NASS, California Almond publications: nass.usda.gov
- NIDIS, Drought status update for California-Nevada (27 April 2026): drought.gov
- NOAA NIDIS, California drought conditions: drought.gov
- Almond Board of California, Water page: almonds.org
- Almond Board, Acreage declines for fourth year (November 2025): almonds.org
- Almond Board, Bearing acreage drops (April 2026): almonds.org
- Almond Board, USDA forecasts smaller crop (May 2026): almonds.org
- Almond Board, USDA projects larger 2025 crop (July 2025): almonds.org
- Almond Board, Vote to end Objective Report funding (December 2025): almonds.org
- UC IPM, Almond pest management guidelines: ipm.ucanr.edu
- Mekonnen and Hoekstra, Water footprint of crops, Vol. 1 (2010): waterfootprint.org
- FoodNavigator, Almond Breeze lawsuit (2015): foodnavigator.com
- EPA WaterSense, Showerheads: epa.gov
Discussion
Questions, corrections or field experience? Share them below. First-time comments are reviewed before they appear, and your email is never published.
No comments yet. Be the first to add a question or your experience.

 Disease Free Life
 WebsEdge
 Blickwinkel
 Agricultural Credit Policy Council
 BayWa
 MCSOD
 Marei Nursery
 eKGIS
 Mostas Tech
 Native Seeds
 Andex
 FCF India
 Unifrutti Gulf
 Deluxe Conseil
 TVS Electronics
 WICO
 Chimera Innovation

 Licence holder · Niger · Gold
 Licence holder · Nigeria · Gold + lithium
 Client · Tanzania · Gold
 Client · Somalia · Gold
 Client & affiliate partner · Ghana · Gold










