In the ever-evolving world of agriculture, staying ahead of the curve is crucial for success. One of the most powerful tools at a farmer’s disposal is satellite monitoring, with NDVI (Normalized Difference Vegetation Index) being a key component. But what is NDVI in agriculture, and how can it revolutionize crop management? Let’s dive into the world of satellite monitoring and explore how it’s transforming modern farming practices.
Understanding NDVI: The Backbone of Satellite Monitoring in Agriculture
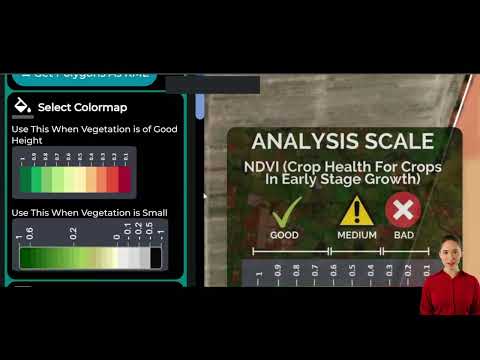
NDVI, which stands for Normalized Difference Vegetation Index, is a crucial metric in remote sensing and agriculture. But what does NDVI measure, and why is it so important?
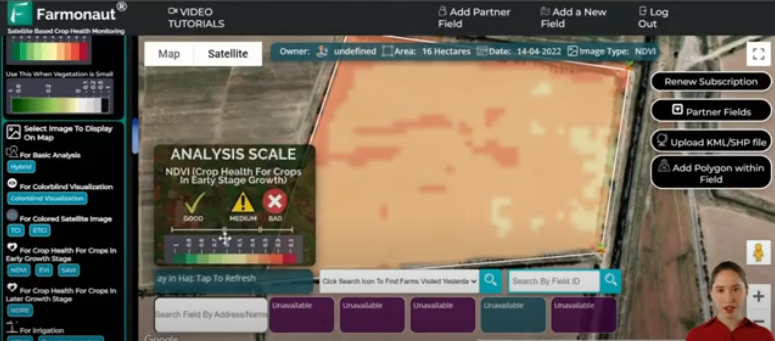
NDVI is primarily used to determine the health and vigor of vegetation. It works by measuring the difference between near-infrared light (which healthy vegetation strongly reflects) and red light (which vegetation absorbs). This simple yet powerful calculation provides invaluable insights into crop health, growth, and potential issues.
What is NDVI Used For in Agriculture?
- Assessing crop health and vigor
- Monitoring plant growth stages
- Detecting stress in vegetation
- Predicting crop yields
- Guiding precision agriculture practices
By utilizing NDVI data, farmers can make informed decisions about irrigation, fertilization, and pest management, ultimately leading to improved crop yields and resource efficiency.
Beyond NDVI: Advanced Indices for Comprehensive Crop Monitoring
While NDVI is a cornerstone of satellite monitoring in agriculture, it’s just one piece of the puzzle. Modern platforms like Farmonaut’s Web App utilize a range of indices to provide a comprehensive view of crop health and field conditions.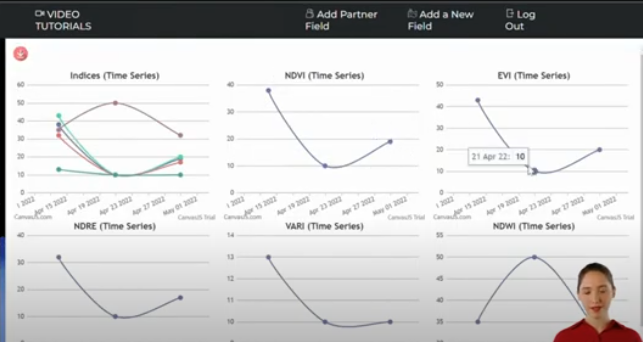
NDRE: Penetrating the Canopy
The Normalized Difference Red Edge (NDRE) index takes crop analysis a step further. Unlike NDVI, NDRE can penetrate deeper into the crop canopy, revealing issues that might not be apparent from surface-level observations. This becomes particularly valuable as crops mature and develop denser foliage.
NDRE is especially useful for:
- Detecting nutrient deficiencies
- Identifying disease presence in lower canopy layers
- Assessing overall crop vigor in later growth stages.
NDWI: Understanding Water Stress
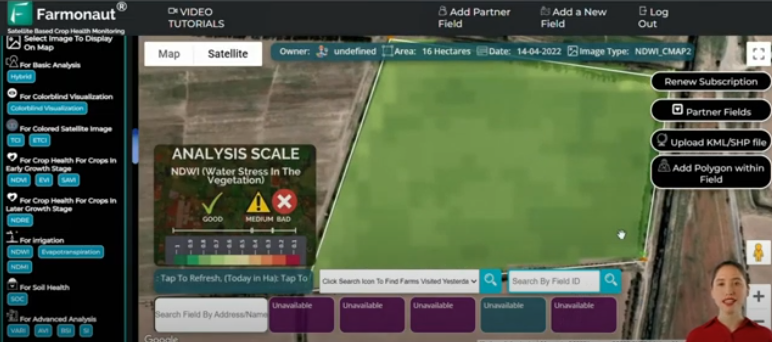
Water management is critical in agriculture, and this is where the Normalized Difference Water Index (NDWI) comes into play. NDWI measures water stress levels within crops, providing farmers with crucial information about their irrigation needs.
By analyzing NDWI data, farmers can:
- Identify areas requiring additional irrigation
- Optimize water management practices
- Prevent crop stress due to water deficiency
NDMI: Soil Moisture Insights
Complementing NDWI, the Normalized Difference Moisture Index (NDMI) focuses on soil moisture levels. This index helps farmers understand the water content in the soil across different areas of their fields.
NDMI data enables farmers to:
- Detect areas with poor soil moisture
- Ensure even distribution of irrigation
- Address specific zones with moisture issues
Irrigation Management: Balancing Water Resources
Effective irrigation is a delicate balance between providing enough water for optimal crop growth and avoiding waste. Satellite monitoring provides several tools to help farmers achieve this balance.
Evapotranspiration Rate: Understanding Water Consumption
The evapotranspiration rate is a critical parameter that shows how much water is evaporating from the soil and transpiring from plants. This information helps farmers understand water consumption patterns and optimize their irrigation schedules.
Benefits of monitoring evapotranspiration include:
- Preventing overwatering and underwatering
- Optimizing irrigation timing
- Improving water use efficiency
Soil Health Analysis: The Foundation of Crop Success
Healthy soil is the foundation of successful crop production. Satellite monitoring platforms provide valuable insights into soil health, allowing farmers to take proactive measures to improve and maintain soil quality.
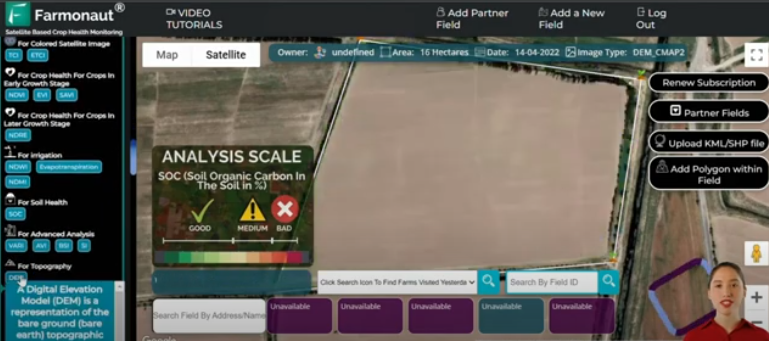
Soil Organic Carbon: A Key Indicator of Soil Health
Soil organic carbon (SOC) is a crucial parameter for understanding soil fertility and overall health. Low levels of organic carbon can be detrimental to crop growth, affecting nutrient availability and soil structure.
By monitoring SOC levels, farmers can:
- Identify areas with declining soil health
- Implement targeted interventions to improve soil quality
- Enhance nutrient levels through organic matter addition
Mitigating Risks: Waterlogging and Drainage Management
Excess water can be just as problematic as water scarcity. Satellite monitoring helps farmers identify areas at risk of waterlogging, allowing them to take preventive measures.
Digital Elevation Models: Predicting Water Flow
By utilizing digital elevation model data, farmers can identify low-lying areas within their fields that are prone to water retention. This information is invaluable for:
- Planning drainage systems
- Implementing preventive measures against waterlogging
- Protecting crops from water-related stress
Harnessing Historical Data for Future Success
One of the most powerful aspects of satellite monitoring is the ability to access and analyze historical data. This long-term perspective allows farmers to make informed decisions based on past trends and patterns.
Time Series Analysis: Understanding Crop Dynamics
By comparing satellite images and data from different dates, farmers can track crop growth, identify anomalies, and understand long-term trends. This historical perspective is invaluable for:
- Long-term crop planning
- Identifying recurring issues
- Optimizing crop rotation strategies
The Power of Visual Comparison
Sometimes, a picture is worth a thousand data points. Modern satellite monitoring platforms offer visual comparison tools that allow farmers to spot subtle changes in crop health over time.
Side-by-Side Image Comparison: Spotting the Subtle Changes
By comparing satellite images from different dates side-by-side, farmers can:
- Detect early signs of crop stress
- Monitor the effectiveness of interventions
- Track crop development stages
This visual approach complements the numerical data, providing a comprehensive understanding of field conditions and crop health.
Conclusion: Embracing the Future of Agriculture
Satellite monitoring, with NDVI at its core, is revolutionizing the way we approach agriculture. By providing real-time insights into crop health, soil conditions, and water management, these tools empower farmers to make data-driven decisions that optimize yields while conserving resources.

As we face the challenges of feeding a growing global population in an era of climate change, the importance of technologies like satellite monitoring cannot be overstated. By embracing these advanced tools, farmers can ensure healthy, high-yielding crops while promoting sustainable agricultural practices.
FAQ: Understanding NDVI and Satellite Monitoring in Agriculture
What does NDVI stand for?
NDVI stands for Normalized Difference Vegetation Index. It’s a standardized index that allows the generation of an image showing the relative biomass and health of vegetation.
What is NDVI primarily used to determine?
NDVI is primarily used to determine the health and vigor of vegetation. It can indicate plant health, biomass, and potential stress or disease in crops.
How is NDVI different from NDWI?
While NDVI focuses on vegetation health, NDWI (Normalized Difference Water Index) is used to monitor changes in water content of leaves and soil moisture. NDWI is particularly useful for water stress detection in crops.
What is the significance of NDVI in remote sensing?
In remote sensing, NDVI is crucial for monitoring vegetation health on a large scale. It allows researchers and farmers to assess crop conditions, forest health, and ecological changes over vast areas using satellite imagery.
How often should farmers monitor NDVI data?
The frequency of NDVI monitoring depends on the crop type and growth stage. Generally, weekly or bi-weekly monitoring during the growing season is recommended to catch any issues early and track crop development effectively.
| Index | Primary Use | Key Benefit |
|---|---|---|
| NDVI | Vegetation health and biomass | Overall crop health assessment |
| NDRE | Canopy chlorophyll content | Deeper canopy penetration |
| NDWI | Water stress in vegetation | Early detection of water deficiency |
| NDMI | Soil moisture content | Irrigation optimization |