Remote Sensing Blogs
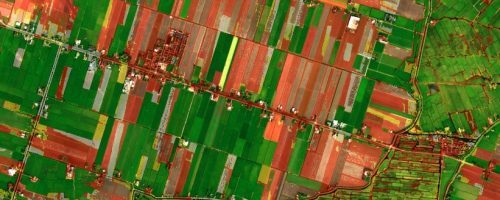
Normalized Difference Vegetation Index - NDVI
It has been quite a long time since scientists and agronomists are using Normalized Difference Vegetation Index (NDVI) to monitor and examine health of crops. The extent and benefits of NDVI have increased manifold with so many earth mapping satellites being launched every year to monitor earth’s surface in different wavelengths.
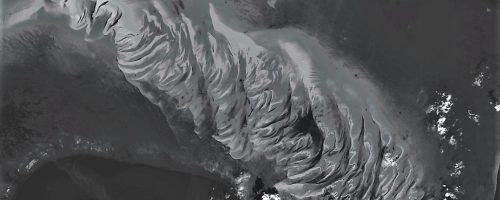
Applications of Satellite Imagery Bands - Part 1: Coastal Aerosol (B1), Blue (B2), Green (B3), and Red (B4)
Since water absorbs and scatters light, oceans and lakes tend to look dark or lack detail on True color satellite images, especially in the murky waters near coastlines. Coastal Aerosol (B1) imagery allows for coastal water and ocean color observation, as it reflects blues and violets, and displays subtle differences in the color of water.
Applications of Satellite Imagery Bands — Part 2: Vegetation Red Edge (B5, B6, B7, B8A)
The Red Edge band is located between the Red band (B4) and the NIR band (B8), without overlap. In a typical spectral response of green vegetation, the Red Edge band covers the portion of the spectrum where reflectance drastically increases from the red towards the NIR regions.
Applications of Satellite Imagery Bands — Part 3: Near Infrared (B8), Water Vapor (B9), and Shortwave Infrared (B10, B11, B12)
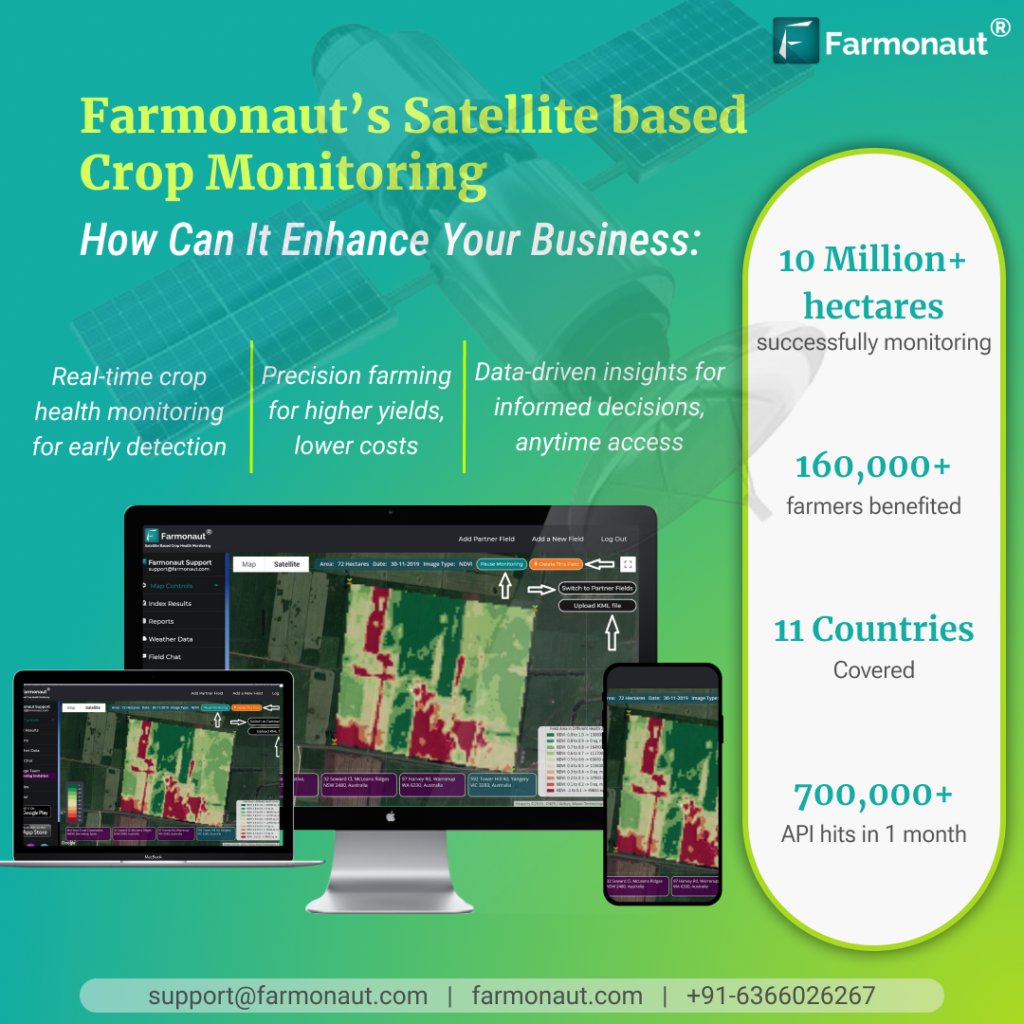
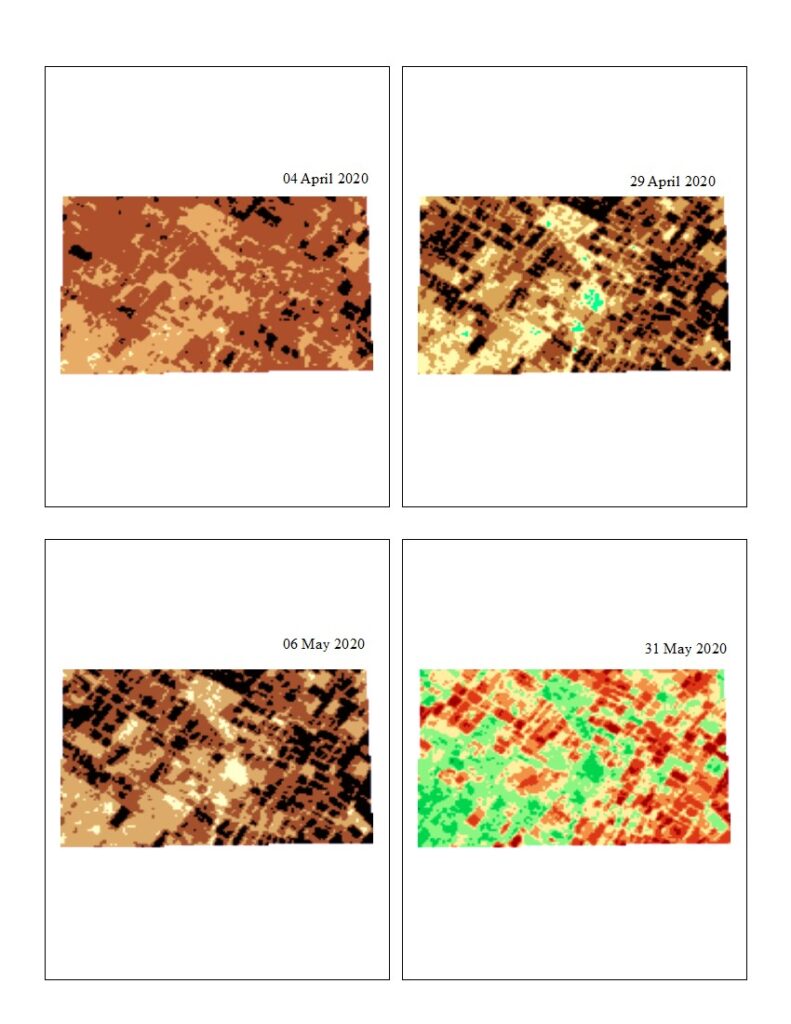
Near Infrared images can help us identify and monitor a plant’s health. At Farmonaut, we have developed our own Crop Health Monitoring system which processes Near Infrared Imagery in combination with several other spectral images to provide a health color-map of an agricultural land.
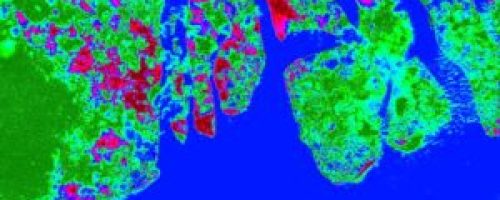
A tsunami swept across Indonesia’s islands of Sumatra and Java the night of December 22, just before 9:30 p.m. local time. There was no notice for the wall of water, which left devastation in its wake. At least 400 are confirmed to be dead and more than 800 are injured. Because of such a large impact of this event, we wanted to analyze the extent of devastation in the coastal region of the affected areas.
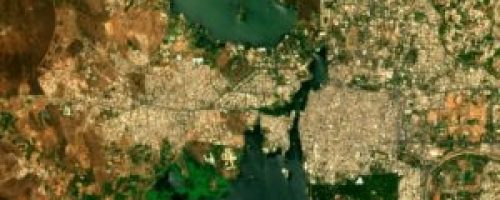
To understand how the condition of lakes change over a course of a year, we shifted our focus to some of the famous lakes in India. Udaipur is known for its beautiful lakes, so we decided to analyze four famous lakes of udaipur, namely: Dudh Talai, Lake Pichola, Swaroop Sagar and, Fateh Sagar Lake.
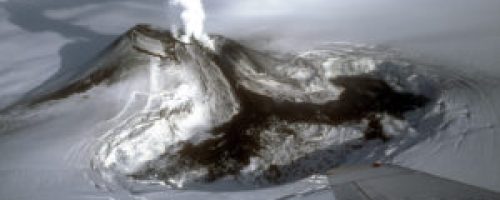
We mapped Mount Veniaminof’s volcanic activity using the short wave infrared satellite imagery accessed through our system. Recently, Mount Veniaminof had been in the news for it’s extreme volcanic activity wherein it ended up spewing ash as high as three miles in the air. The activity was so intense, that the region near it was declared as a no-fly zone.
Time Lapse of Californian Fire
The spread and extent of fire in California is massive and devastating. So, we decide to have a look on the imagery of the last month. The spread and extent of fire in California is massive and devastating. So, we decide to have a look on the imagery of the last month over a region in California and have created a Time Lapse of the same.
Farmonaut provides satellite based crop health monitoring system, through which farmers can select their field and identify the regions of the field at which the crop growth is not normal. Upon identifying that region of their fields, they can simply pay a visit to that part of the field and identify if the problem has already started. If it has not, the farmer can take preventive remedies by applying more fertilizers, plant growth regulators etc. If the problem has already started, they can simply explain their problem to Farmonaut’s crop issue identification system and get real-time govt. approved remedies.


