

Reviewed September 2026 against USDA NASS (Census of Agriculture, ARMS), USDA Economic Research Service, and the Rodale Institute’s long-term farming systems trials.
Try it: Run your own numbers →
The clearest examples of sustainable agriculture in the United States are cover cropping, no-till/conservation tillage, crop rotation, integrated pest management, agroforestry, efficient irrigation, and certified organic production. Each one has measurable adoption data, yield data, or profitability data behind it — not just a description. Below, every example carries the actual USDA or university figure attached to it, so you can check whether it still applies to your operation before you adopt it.
This matters because “sustainable farming” gets used as a marketing word more often than a measured one. USDA’s National Agricultural Statistics Service (NASS) puts cover crop adoption on US cropland at just 4.7% in 2022, via the Agricultural Resource Management Survey (USDA ERS Charts of Note). That’s the honest baseline: sustainable practices are proven, but adoption in the US still has a long way to go. The rest of this guide gives you the numbers for seven practices, a comparison table, and a calculator to estimate what cover cropping could return on your own acreage.
7 Sustainable Agriculture Examples With Data Behind Them
These are the seven practices of sustainable agriculture with the strongest US evidence base. Each entry states what it is, the actual adoption or performance figure, and where that figure comes from — so you can verify it rather than take it on faith.
-
Cover Cropping: The Best-Documented Example of Sustainable Agriculture
What it is: Planting a non-cash crop — legumes, cereal rye, or grasses — during the fallow window between cash crops, instead of leaving soil bare.
The number: Cover crops sat on 4.7% of all US cropland in 2022, per NASS’s Agricultural Resource Management Survey (USDA ERS). On corn and cotton acreage specifically, adoption averaged 8.2% across 2016–2021 (USDA ERS, chart 102161). Of the acres that do plant cover crops, 41.4% also run no-till in the same rotation — the two practices are usually adopted together, not separately.
Where it fits: Cover cropping is one of several soil-building methods explained step by step in regenerative practices that rebuild soil health. -
Conservation Tillage and No-Till: Protecting Soil Structure
What it is: Reducing or eliminating tillage passes so soil structure, residue cover, and stored carbon aren’t disturbed every season.
The number: No-till is the practice most frequently paired with cover crops — 41.4% overlap, as above (2016–2021, NASS ARMS). Conservation tillage builds soil organic carbon stores over time, and reduces fuel and labor costs by cutting field passes.
Verification note: There is no single national no-till adoption percentage in the brief for this article — NASS’s Census of Agriculture and ARMS both track it, but state-by-state breakdowns are fragmented across university extension reports rather than centralized. If you need a figure for a specific state, the Census of Agriculture (next full release 2030, annual Quick Stats updates in between) is the primary source. -
Crop Rotation and Diversity: The Foundation Practice
What it is: Alternating crop species — typically corn, soybeans, and small grains or legumes — across seasons in the same field instead of continuous monoculture.
The number: The clearest long-term comparison comes from Iowa State University’s long-term agroecological research (1999–2001): a corn-soybean-oat organic rotation returned $297 net per acre, versus $73 net per acre for a conventional corn-soybean system over the same period (Rodale Institute review of long-term trials).
How it works: Rotating nitrogen-fixing legumes with cereals replenishes soil nutrients naturally and breaks pest and disease cycles that build up under monoculture. -
Certified Organic Production: The Measurable Market Example
What it is: Crop and livestock production without synthetic fertilizers, synthetic pesticides, or GMOs, certified to USDA National Organic Program standards.
The numbers: The US had 7.2 million certified organic acres in 2025, generating $9.6 billion in certified organic product sales in 2022 — up 32% from 2017 (NASS Census of Agriculture, 2022 Organic Highlights). Certified organic products currently carry a 20–40% price premium over conventional equivalents (USDA ERS Organic Agriculture).
The yield trade-off: University of Minnesota’s Variable Input Crop Management Systems trial (1989–2007) found organic corn yielded 91–93% of conventional, and organic soybeans 81–84% — but in low-rainfall years, the multi-decade Rodale Institute Farming Systems Trial (1981–2020) found organic corn and soybean systems out-yielded conventional by 28–34%, because organic soils hold water better under drought stress. -
Integrated Pest Management (IPM): Reducing Chemical Reliance
What it is: Combining biological controls, crop scouting, resistant varieties, and targeted (not calendar-based) pesticide application to manage pest pressure with less chemical input.
Why it’s here: IPM is the connective practice between organic and conventional systems — many non-certified US farms run IPM protocols without pursuing organic certification, since it doesn’t require forgoing all synthetic inputs, only using them precisely. It pairs directly with the soil health institute’s regenerative findings below. -
Agroforestry: Integrating Trees Into Working Farmland
What it is: Deliberately planting trees or shrubs into cropland or pasture — windbreaks, alley cropping, or silvopasture — instead of keeping farmland treeless.
Why it’s here: Agroforestry adds a second income stream (timber, nuts, or fruit) on top of the primary crop or livestock enterprise, and buffers fields against wind erosion and temperature extremes. National-level US adoption figures for agroforestry acreage specifically were not in the data available for this article; USDA’s Census of Agriculture is the primary source to check for an updated figure. -
Efficient Irrigation: Matching Water to Crop Need
What it is: Drip irrigation, soil-moisture-triggered scheduling, and variable-rate systems that apply water based on measured crop demand rather than a fixed calendar.
Why it’s here: Efficient irrigation is the sustainable practice with the least controlled US measurement data currently published — most water-savings figures in circulation are modeled estimates rather than direct field measurements. If you need a number for your own operation, your state’s Cooperative Extension irrigation program or USDA NRCS field office can run a site-specific water budget; a generic percentage would not be honest here.
Comparison Table: Sustainable vs. Conventional Practices
Here’s how the seven examples stack up against their conventional counterparts, using the figures cited above rather than estimated ranges where a real number exists.
| Practice | US Adoption / Scale | Net Return or Yield Data | Source |
|---|---|---|---|
| Cover Cropping | 4.7% of US cropland (2022); 8.2% of corn/cotton acres (2016–2021 avg.) | 41.4% of cover-crop acres also run no-till | USDA NASS ARMS |
| No-Till / Conservation Tillage | Tracked jointly with cover crops in ARMS; no single national % in current brief | Builds soil organic carbon; cuts fuel/labor passes | USDA NASS ARMS |
| Crop Rotation (organic 3-crop) | Iowa State long-term trial, 1999–2001 | $297/acre net vs. $73/acre conventional corn-soy | Rodale Institute review |
| Certified Organic | 7.2 million acres (2025); $9.6B sales (2022), +32% vs. 2017 | Corn 91–93%, soybean 81–84% of conventional yield; +28–34% in drought years | NASS Census of Agriculture; Rodale FST |
| 6-Year Organic Rotation (Maryland) | USDA ARS Farming Systems Project, 2006–2014 | $858/acre net vs. $502/acre conventional chisel-till | USDA Agricultural Research Service |
| Regenerative Practices (Southern US) | Regional study, Soil Health Institute | 11–22% improvement in soil health indicators | Soil Health Institute |
| Organic Price Premium | Current US market | 20–40% above conventional pricing | USDA ERS |
The Economics: What the Long-Term Trials Actually Show
The profitability question is where most sustainable agriculture articles go vague. The actual data comes from two long-running US university trial networks, both compiled in the Rodale Institute’s review of long-term comparative research.
Iowa State University’s long-term agroecological research compared a corn-soybean-oat organic rotation against a conventional corn-soybean system from 1999 to 2001: the organic rotation returned $297 net per acre against $73 net per acre conventional — roughly four times the per-acre return over that window. Separately, the USDA Agricultural Research Service’s Farming Systems Project in Maryland ran a six-year organic rotation against conventional chisel-till corn from 2006 to 2014, finding mean net returns of $858 per acre organic versus $502 per acre conventional.
Both trials attach a real trade-off: transitioning from conventional to organic management typically costs a farm 4 to 6 years before profitability recovers to conventional parity, per the same Rodale Institute long-term analysis — the certification and soil-rebuilding period is a genuine cash-flow cost, not a marketing footnote. Yield during that window also runs below conventional: the University of Minnesota’s Variable Input Crop Management Systems trial (1989–2007) measured organic corn at 91–93% and organic soybeans at 81–84% of conventional yield. The exception is drought years, where the Rodale Institute’s own Farming Systems Trial (1981–2020) recorded a 28–34% organic yield advantage over conventional corn and soybeans, attributed to better water-holding capacity in organically managed soil.
On soil health specifically, the Soil Health Institute’s Southern US regional study found regenerative practices — cover crops, reduced tillage, diverse rotations — improved soil health indicators by 11–22% relative to conventional management. That study’s scope is regional (Southern US), not national, and the Institute publishes updated regional monitoring reports as coverage expands beyond the cotton belt.
What the current data does not yet cover, honestly: carbon sequestration rates in tons of CO2-equivalent per acre per year lack a consistent measurement protocol across US regions, so no verified figure is cited here. Pollinator counts and soil microbial diversity indices comparing sustainable to conventional farms are similarly thin in peer-reviewed US literature. If your operation needs either figure, your state’s land-grant university extension soil lab is the practical next step — ask specifically for regionally calibrated protocols, since national figures don’t yet exist to cite.

Cover Crop Cost & Break-Even Calculator
Cover cropping is the most widely adopted of the seven examples above (4.7% of US cropland, NASS ARMS 2022) but still a minority practice — mainly because the seeding cost has to be weighed against fertilizer and herbicide savings on your specific acreage. Enter your own numbers below to see the estimated per-acre and total balance.
Run your own numbers
Assumptions: seed and planting cost is a straight per-acre input cost; fertilizer and herbicide savings are figures you supply based on your own agronomist’s estimate or prior-year input records, not a Farmonaut-modeled number. The no-till adjustment reflects the 41.4% of US cover-crop acres that pair the two practices (NASS ARMS, 2016–2021) and uses a flat $9/acre placeholder for fuel and labor savings — replace it with your own equipment cost record for an exact figure. This tool excludes yield effects, transition-period costs, and any premium pricing; it is a first-pass input/savings comparison only.
Technology That Makes These Practices Easier to Run
Every example above depends on knowing field-level conditions well enough to time the practice correctly — planting a cover crop before the right frost window, scheduling irrigation to actual crop demand, or catching a pest outbreak before it needs a blanket spray. That’s where satellite monitoring and precision agriculture tools fit in.
-
Precision Agriculture Technology
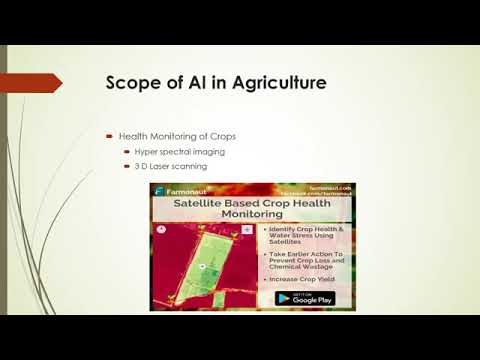
Satellite imagery, GPS mapping, and AI-driven analytics let a farm target input application field-by-field instead of uniformly. Platforms like Farmonaut deliver this from desktop and mobile, so decisions on fertilizer timing, irrigation, and pest scouting are based on current field data rather than a fixed calendar.
See Farmonaut’s Carbon Footprinting tool for tracking and reducing farm-level carbon emissions.
-
Genetic Modification and Breeding
Pest-, disease-, and drought-resistant crop varieties reduce the chemical inputs and irrigation volume a field needs, complementing rotation and IPM rather than replacing them.
-
Renewable Energy in Agriculture
Solar, wind, and bioenergy integration cuts the fossil-fuel dependency of irrigation pumping, grain drying, and equipment operation — read more in renewable energy’s impact on rural agriculture.
-
Blockchain Traceability
Traceability tools let buyers verify that a claimed sustainable practice — organic certification, IPM protocol, regenerative rotation — was actually followed, closing the gap between marketing claims and field records. Farmonaut’s product traceability platform is built for this.

How Farmonaut Supports These Practices
Running any of the seven examples above well depends on field-level visibility. Here’s how Farmonaut fits into that workflow:
- Satellite-Based Crop Health Monitoring: Track crop stress and time input applications to reduce waste on rotation, cover crop, and IPM programs.
Try it now: Farmonaut’s Large-Scale Farm & Plantation Management. - Fleet and Resource Management: Reduce logistics costs tied to tillage passes and input hauling — optimize your agri fleet at scale.
- Access to Finance: Document sustainable practice adoption for lenders and insurers with Farmonaut’s crop loan and insurance verification.
- API Integrations: Pull satellite and weather data into your own systems via public APIs and developer documentation.
Why Adoption Still Lags the Evidence
If cover cropping returns measurable soil health gains at 4.7% national adoption, the obvious question is why the other 95.3% of US cropland hasn’t switched. The trial data above answers part of it directly.
-
The transition cost is real and multi-year.
The 4-to-6-year window before organic profitability reaches conventional parity (Rodale Institute long-term analysis) is a genuine cash-flow barrier for an operation financing annual inputs on credit, independent of whether the long-term return is better.
-
Yield risk during the transition.
The 91–93% (corn) and 81–84% (soybean) yield figures from the University of Minnesota trial represent real bushels lost in most years, offset only in drought years by the Rodale Institute’s 28–34% organic yield advantage — a trade-off that depends on weather a farm can’t control in advance.
-
Data and training gaps.
State-by-state adoption figures for practices like no-till and IPM remain fragmented across university extension reports rather than centralized in one federal dataset, which makes it harder for an individual operation to benchmark itself against comparable farms in its own region.
-
Market recognition for the premium.
The 20–40% organic price premium (USDA ERS) only pays off if a buyer or certification program exists to capture it — without a market channel, sustainable practices show up as a cost with no offsetting revenue.
Frequently Asked Questions
What are examples of sustainable agriculture in the United States?
The seven with the clearest US data are cover cropping (4.7% of US cropland, NASS 2022), no-till/conservation tillage, crop rotation, certified organic production (7.2 million acres, $9.6 billion in sales in 2022), integrated pest management, agroforestry, and efficient irrigation. Each has adoption or profitability figures published by USDA or university trial networks, cited throughout this article.
What are the 7 practices of sustainable agriculture?
Crop rotation, conservation tillage, integrated pest management, agroforestry, organic/reduced-input farming, efficient water use, and cover cropping. These are covered individually above, each with the specific US figure attached where one exists.
Is sustainable agriculture more profitable than conventional farming?
It depends on the system and the time horizon. Iowa State’s long-term trial found an organic rotation returning $297/acre net versus $73/acre for conventional corn-soybean (1999–2001). USDA ARS’s Maryland trial found $858/acre versus $502/acre (2006–2014). Both trials also found a 4-to-6-year transition period before profitability reaches conventional parity — the long-term number and the short-term number tell different stories, and both are real.
Does sustainable farming reduce crop yields?
In most years, yes, somewhat: University of Minnesota’s long-term trial found organic corn at 91–93% and organic soybeans at 81–84% of conventional yield (1989–2007). In low-rainfall years, the Rodale Institute Farming Systems Trial found the opposite — organic systems out-yielded conventional by 28–34%, because organic soil holds water better under drought stress.
How do sustainable farming methods improve soil health?
The Soil Health Institute’s Southern US study found regenerative practices improved soil health indicators by 11–22% relative to conventional management. Practices like cover cropping, minimizing tillage, and increasing soil organic matter rebuild fertility and structure over successive seasons rather than in a single year.
What is precision agriculture, and how does it support sustainability?
Precision agriculture uses satellite imagery, GPS, sensors, and AI analytics to target input use — fertilizer, irrigation, pest control — at the field or sub-field level instead of applying a flat rate across an entire farm. This reduces waste and supports the input-reduction goals behind cover cropping, IPM, and efficient irrigation described above.
How does Farmonaut support these practices?
Farmonaut provides satellite-based crop monitoring, fleet and resource management, blockchain traceability, and API access to satellite and weather data, letting farms track and document the seven practices above at the field level. See the regenerative agriculture and step-by-step farming guides for implementation detail.
Where to Get Updated Numbers Every Year
Every figure in this article traces to a specific USDA survey or university trial, and each one updates on its own schedule — treat this as the current state of a continuing dataset, not a fixed snapshot. Cover crop and no-till adoption come from NASS’s Agricultural Resource Management Survey, accessible through the Quick Stats database; ARMS updates annually but typically lags by one to two years, so a figure from a recent year is often the most current one published. Organic acreage and sales come from the Census of Agriculture, which runs on a five-year cycle (last full release 2022, next in 2030) with annual interim updates via Quick Stats. Soil health indicator data is maintained by the Soil Health Institute, which publishes updated regional monitoring reports as its coverage expands beyond the Southern cotton belt.
If a number in this article looks out of date when you’re reading it, that’s the system working as intended — go to the source cited next to it rather than assuming the figure above still holds. The practices themselves — rotation, reduced tillage, cover cropping, organic management, IPM, agroforestry, efficient irrigation — don’t expire; only the adoption percentages and price figures around them do.

 Doodlakine
 Nale Network
 Exurbia Geospatial
 FieldZero
 Indico Company
 Kubota
 FFBS
FFBS Jontra
 Kalustyan
 Tucor
Tucor Geno
Geno Hayleys Agriculture
 Linx Agritech
 Adinet
