

Farm water · Problems and fixes
Problems of Water Management in Farming: 7 Fixes
US farms applied 81 million acre-feet of water to 53.1 million irrigated acres in 2023 (USDA NASS). Seven problems that waste or threaten that water, with dated evidence and practical fixes: drought plans, groundwater limits, efficient irrigation, soil health, nutrient care, field data and staged upgrades.
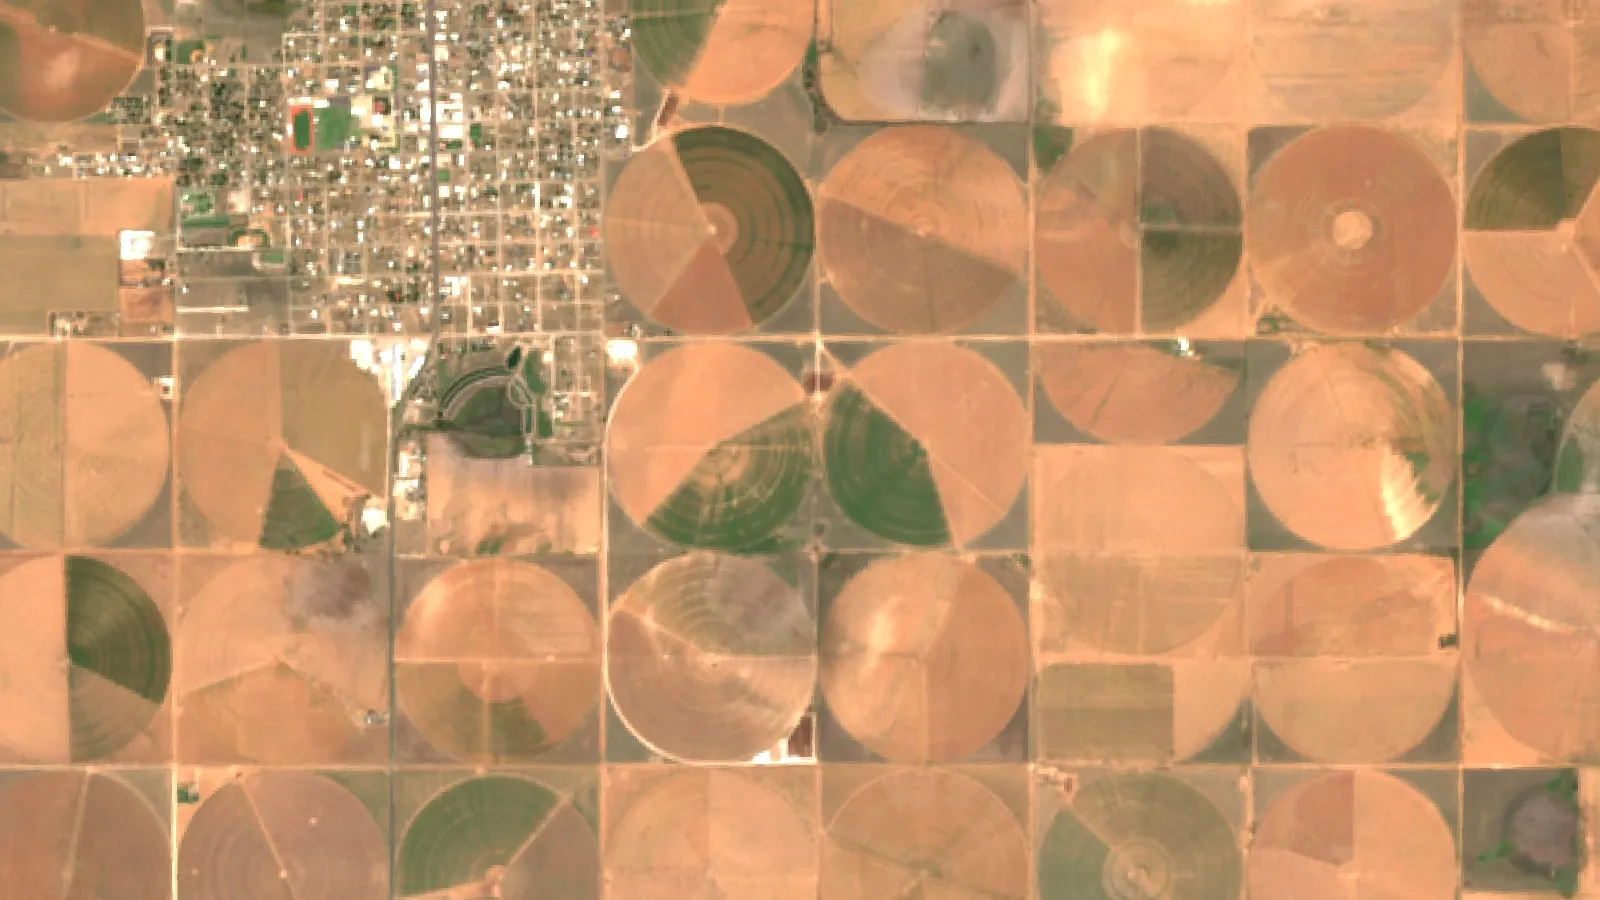
Key takeaways
- Agriculture accounts for 69% of world water withdrawals, or 59% if each country is averaged (FAO AQUASTAT).
- US farms applied 81 million acre-feet to 53.1 million irrigated acres in 2023, down from 83.4 million acre-feet in 2018; the average stayed at 1.5 acre-feet per acre (USDA NASS).
- Application efficiency ranges from 60% for furrow to 97% for subsurface drip in a Texas A&M AgriLife study of High Plains systems.
- High Plains Water District wells fell 0.57 feet on average from 2025 to 2026, with large 10-year declines in counties such as Castro and Parmer.
- Agricultural runoff is the leading cause of water quality impacts on US rivers and streams (EPA).
In this article
- Problems of water management at a glance
- How much water does agriculture use?
- 1. Drought, climate change and water scarcity
- 2. Over-extraction and groundwater depletion
- 3. Inefficient irrigation practices
- 4. Poor soil health and low water holding
- 5. Agricultural runoff and water pollution
- 6. Too little data on what each field needs
- 7. Costs, policies and water rights
- How the seven problems connect
- A simple water plan for your farm
- Related videos
- How we checked the figures
- FAQ
The main problems of water management in agriculture are drought and shifting rainfall, falling groundwater, water lost on the way to the root zone, poor soil that cannot hold water, nutrient runoff into rivers and lakes, too little data on what each field really needs, and rules and costs that make change slow. Each one has practical fixes, from better irrigation hardware and scheduling to cover crops and buffer strips.
This guide explains seven of these problems with dated figures from the USDA, the US Geological Survey, Texas water agencies, the FAO and the US Environmental Protection Agency. It shows how much water different irrigation systems deliver to the crop, how fast wells are falling on the Texas High Plains, and gives a calculator to test whether a more efficient system could pay back on your farm. For a wider view of water planning, see our guide to agriculture and water management strategies.
Problems of water management at a glance
The table sums up the seven problems. Each has its own section below with the source behind it.
| Problem | What goes wrong | Evidence | Main fixes |
|---|---|---|---|
| 1. Drought and climate shifts | Less water when crops need it most | Agriculture takes 69% of world water withdrawals (FAO AQUASTAT) | Drought plans, storage, tougher crop choices |
| 2. Groundwater depletion | Pumping beats recharge | Ogallala declines above 300 feet in parts of Texas (TWDB) | Pumping limits, metering, crop shifts |
| 3. Inefficient irrigation | Water lost to runoff and deep drainage | Application efficiency from 60% (furrow) to 97% (subsurface drip), Texas A&M | Low-pressure pivots, drip, scheduling |
| 4. Poor soil water holding | Rain runs off instead of soaking in | Farmers reported corn and soybean yields 10-12% higher after cover crops in the 2012 drought (SARE survey) | Cover crops, less tillage, organic matter |
| 5. Runoff and water quality | Nutrients and sediment reach streams | Agricultural runoff is the leading cause of impacts on rivers and streams (EPA) | Nutrient plans, buffers, timing |
| 6. Not enough field data | Water applied by habit, not need | Average 1.5 acre-feet applied per irrigated acre in 2023 (USDA NASS) | Soil moisture sensors, weather data, satellite maps |
| 7. Costs, rules and rights | Upgrades are costly and slow | US$3 billion spent on irrigation equipment and facilities (USDA NASS, 2023 survey) | Cost-share, water districts, staged upgrades |
How much water does agriculture use?
Farming is the largest user of fresh water in the world and in many farm regions. At world level, withdrawals split 69% agricultural, 12% municipal and 19% industrial, according to the FAO AQUASTAT note on water use. The FAO adds that these shares are pulled up by a few countries with very large withdrawals. If you average the shares country by country, agriculture is 59%.
In the United States, irrigation withdrawals were 118 billion gallons per day in 2015, which was 42% of all fresh water withdrawn, according to USGS Circular 1441. Irrigation was 70% of fresh groundwater withdrawals that year. That report is the latest in the USGS five-yearly national water-use circular series.
The USDA irrigation survey gives a newer view of farms themselves. The 2023 Irrigation and Water Management Survey counted 212,714 farms with 53.1 million irrigated acres and 81 million acre-feet of water applied, according to the USDA NASS release of October 2024. In 2018 the survey found 231,474 farms, 55.9 million acres and 83.4 million acre-feet. So farms irrigating, land irrigated and water used all fell. Water applied per acre held at 1.5 acre-feet. An acre-foot is the water needed to cover one acre one foot deep.
Where the water comes from matters too. On-farm wells supplied 54% of the irrigation water applied to fields in the open in 2023, and the average well was 241 feet deep. Five states, Arkansas, California, Idaho, Nebraska and Texas, held about half of the irrigated acres and used more than half of the water applied.
Chart
Water applied by US irrigated farms
Million acre-feet, USDA Irrigation and Water Management Survey years
1. Drought, climate change and water scarcity
Drought is the most visible water problem on a farm. Dry spells cut yields, force early sales of livestock and raise the cost of pumping. Climate change shifts when and how rain falls. More of it may arrive in heavy bursts that run off, with longer dry gaps between.
Satellites show how fast stored water can change. A study in Nature by Rodell and colleagues (2018) used the GRACE satellites to track 34 trends in water stored on land from 2002 to 2016. It linked them to natural swings, unsustainable groundwater use, climate change or a mix of these.
In Australia, the Bureau of Meteorology drought page tracks rainfall deficiencies and water availability across the country. Farmers can use these maps to plan water orders and stocking. In the UK and parts of Europe, dry summers have led to limits on how much water farms may take from rivers in some years.
What helps:
- Write a drought plan before the dry season: which fields get water first, which crops can be cut back and when you sell stock.
- Store water when it is plentiful, in on-farm ponds or tanks, where local rules allow.
- Choose crops and varieties that fit the water you can count on, not the water you hope for.
- Track rainfall, soil moisture and crop condition every week so you act early.
2. Over-extraction and groundwater depletion
Groundwater is a savings account. When farms take more each year than rain puts back, the water table falls, wells must go deeper and pumping costs rise. In time some wells can no longer supply a pivot.
The Ogallala Aquifer under the US High Plains shows the risk. In Texas, about 95% of the groundwater pumped from it is used for irrigated agriculture, according to the Texas Water Development Board. Over much of the aquifer withdrawals exceed recharge. Declines of more than 300 feet have occurred in several areas over the last 50 to 60 years, although the rate of decline has slowed and levels have risen in a few places.
Local measurements show the trend county by county. The High Plains Water District measured about 1,340 observation wells in early 2026 and found an average change of -0.57 feet since 2025, with an average saturated thickness of 51 feet, according to the High Plains Water District 2026 water level summary. Saturated thickness is the depth of water-bearing rock left above the base of the aquifer.
The chart below compares the 5-year and 10-year average change for counties in the district.
What helps:
- Meter every well, so you know how much you pump field by field.
- Follow district pumping limits and reporting rules. They exist to make the aquifer last.
- Move the thirstiest crops to fields with the best water, and consider dryland or limited-irrigation crops elsewhere.
- Upgrade to systems that put more of each pumped inch into the root zone (see problem 3).
Chart
Water level change, High Plains Water District counties
Feet, average change in observation wells over 5 and 10 years to early 2026, eight counties
3. Inefficient irrigation practices
Not all water that leaves the pump reaches the crop. Some runs off the end of the field. Some drains below the roots. Some blows away or evaporates from wet leaves and soil. The FAO irrigation manual calls the share that the crop can use the field application efficiency, and gives indicative values of 60% for surface irrigation, 75% for sprinklers and 90% for drip.
Chart
Application efficiency by irrigation system
Percent of applied water used effectively by the crop, Texas High Plains study assumptions
A Texas A&M AgriLife bulletin on irrigation systems for the Texas High Plains used similar figures for five systems: 60% for furrow, 78% for mid-elevation spray (MESA) pivots, 88% for low-elevation spray (LESA), 95% for low energy precision application (LEPA) and 97% for subsurface drip. In that study, a subsurface drip system needed only 91% of the water a LESA pivot used to give the same effective water to the crop. The authors also noted that the most efficient systems tended to have the lowest pumping costs.
The USDA survey shows the shift is under way. In 2023 there were 12.6 million more irrigated acres under sprinkler systems than under gravity irrigation, according to the NASS release.
What helps:
- Lower spray heads on centre pivots or move to LEPA drag hoses where soils and slopes suit them.
- Use drip or subsurface drip on high-value or row crops where the cost pays back.
- Fix leaks, worn nozzles and uneven pressure. A yearly system check is cheap compared with lost water.
- Schedule by crop need, not by the calendar (see problem 6).
Use the calculator below to test how much water and money a more efficient system could save on one field. For more irrigation methods, read our guide to sustainable irrigation.
Try the numbers for your own farm below.
Calculator
Could a more efficient irrigation system pay back?
Enter your crop water need, field size, system efficiencies and costs.
- Water applied now: 23.1 in/acre
- Water applied with new system: 18.9 in/acre
- Water saved on the field: 43.0 acre-ft
- Pumping cost saved: 5,162 US$/season
- Total upgrade cost: 37,500 US$
Example values only, not a benchmark or a forecast; every number is your input. Water applied = crop water need ÷ application efficiency. Indicative efficiencies: 60% surface, 75% sprinkler, 90% drip (FAO); 60-97% for High Plains systems (Texas A&M AgriLife). Pumping and upgrade costs are examples, use today’s price and quotes. Ignores loan interest, labour and yield change. Get professional advice before investing.
4. Poor soil health and low water holding
Healthy soil acts like a sponge. It soaks up rain, holds it in the root zone and releases it to the crop for days after. Compacted or bare soil with little organic matter lets rain run off, so the same storm stores less water and carries more soil away.
Cover crops and less tillage help. The SARE handbook on cover crops notes that aggressive tillage destroys earthworm and root channels that reach the surface, reducing infiltration during intense rainfall. In a national cover crop survey reported by SARE, farmers’ yields after cover crops were higher on average in every year, and most clearly in the 2012 drought, when soybean yields rose 12% and corn yields 10%.
What helps:
- Keep the soil covered with crops or residue for as many months as you can.
- Cut the number of tillage passes, and avoid working wet soil that compacts.
- Add organic matter with manure, compost or crop residue.
- Use rotations that include deep-rooted crops. Our guide to intercropping and crop rotation explains the options.
5. Agricultural runoff and water pollution
Water management is about quality as well as quantity. When crops do not take up all the nitrogen and phosphorus applied, some is washed from fields during rain or snowmelt, or leaches into groundwater, according to the EPA page on agricultural nutrient pollution. High levels can cause algal blooms and low-oxygen “dead zones” downstream.
The scale is large. The EPA nonpoint source page on agriculture says that, in the National Water Quality Assessment, agricultural runoff is the leading cause of water quality impacts on rivers and streams, the third leading source for lakes and the second largest source of impairments to wetlands. It adds that about 12 million tons of nitrogen and 4 million tons of phosphorus fertilizer are applied to US crops each year.
Too much irrigation makes this worse. Water that drains below the roots carries nitrate with it, so better irrigation and better nutrient use go together.
What helps:
- Follow the “4R” approach: right source, rate, time and place for every nutrient.
- Split nitrogen into smaller doses through the season instead of one large dose.
- Plant grass buffer strips along ditches and streams, and keep cover on bare soil over winter.
- Check the label on every fertilizer and pesticide, follow local rules on application near water, and get professional advice for your soil and crop.
6. Too little data on what each field needs
Many farms still water by habit: the same amount, on the same days, on every field. Yet soils, slopes and crops differ within one farm. Water applied by habit is often too much on some fields and too little on others.
Better data closes that gap. Soil moisture probes show how much water is left in the root zone. Local weather stations and evapotranspiration data show how much the crop used. Satellite images show which parts of a field are stressed, so you can check them before yield is lost.
Satellite vegetation maps are most useful on large or scattered farms, where walking every field each week is not possible. The Farmonaut Satellite + AI Farm Monitoring System is one such tool: you draw your fields once and see crop health and moisture maps through the season.
What helps:
- Install at least one soil moisture probe in each main soil type, at two depths.
- Base each irrigation on the soil water deficit and the weather forecast.
- Map where crops are stressed and look at those spots first.
- Keep simple records of water applied and yield, field by field, to learn from each season.
7. Costs, policies and water rights
Even when the fix is clear, money and rules slow it down. Farmers and ranchers spent US$3 billion on irrigation equipment, facilities, land improvement and computer technology in 2023, according to the USDA NASS release. A new pivot, drip system or well is a large outlay, and the payback depends on water price, energy cost and crop value.
Rules shape what is possible. In the western United States, water rights decide who may take water and how much. Groundwater districts on the High Plains set pumping limits and require meters. In the UK, abstraction licences set how much a farm may take from rivers and aquifers. In Australia, water entitlements and allocations are traded in many basins.
What helps:
- Ask your local conservation office or water district about cost-share programmes for irrigation upgrades. Rules and funding change, so check what is open now.
- Upgrade in stages, starting with the fields where water is scarcest or most costly.
- Join local water planning groups, so farm needs are heard when rules are set.
- Before you sign any loan or change a water right, get professional legal and financial advice.
How the seven problems connect
The problems feed each other. Drought makes farmers pump more groundwater. Inefficient systems waste part of that water and wash nutrients below the roots. Poor soil holds less of the next rain, so the cycle starts again. That is why single fixes rarely solve the whole problem.
A good plan works on several fronts at once: measure what you use, apply it where the crop needs it, keep the soil able to hold it and stop nutrients leaving the field. Each step also saves money, because every inch of water not pumped is energy not paid for.
A simple water plan for your farm
- Measure. Meter wells and pumps, and record water applied per field.
- Check the system. Test pressure, nozzles and uniformity before the season.
- Know your soil. Map soil types and their water holding capacity.
- Schedule by need. Use soil moisture, weather data and crop stage to decide when to irrigate.
- Watch the crop. Use field walks and satellite maps to find stressed areas early.
- Protect water quality. Match nutrients to crop need and keep buffers along water.
- Review each year. Compare water used and yield by field, and upgrade where the payback is best.
Related videos
These short videos from our channel show practical steps on soil and water, and how satellite crop monitoring works in practice.

▶ Seven simple ways to protect soil and water on the farm, explained with humour. · 4:34
▶ How satellite NDVI maps show crop stress before you can see it in the field. · 4:09

▶ A step-by-step tour of monitoring fields with satellite crop health maps on the web. · 8:43
How we checked the figures
We used the USDA NASS 2023 Irrigation and Water Management Survey for farm irrigation figures and kept its survey years. National withdrawal figures come from USGS Circular 1441 for 2015 and are not mixed with the USDA survey. Groundwater figures come from the Texas Water Development Board and the High Plains Water District 2026 summary. Irrigation efficiency values come from the FAO irrigation manual and a Texas A&M AgriLife study, and are indicative values, not field measurements. Each source is listed at the end of the article.
Related pages on our site: sustainable water management · water efficiency in agriculture · smart farming technology · large-scale farm management · farm fleet management · crop traceability · farm carbon footprint · crop loans and insurance · weather data API docs · water care in mining · monitoring app
FAQ
What are the main problems of water management in agriculture?
Drought and climate shifts, falling groundwater, water lost by inefficient irrigation, soils that hold little water, nutrient runoff, too little field data, and the cost and rules of changing systems.
What are common irrigation problems in agriculture?
Uneven water across the field, runoff at field ends, deep drainage below the roots, worn nozzles and leaks, and watering by the calendar instead of crop need. FAO gives indicative field efficiencies of 60% for surface, 75% for sprinkler and 90% for drip irrigation.
How can farmers manage water scarcity?
Plan for drought, meter and limit pumping, move to more efficient systems, improve soil so it holds more rain, and schedule each irrigation from soil moisture and weather data.
How much water does US agriculture use?
Farms applied 81 million acre-feet to 53.1 million irrigated acres in 2023, an average of 1.5 acre-feet per acre (USDA NASS). In 2015, irrigation took 42% of all fresh water withdrawn in the country (USGS).
Does drip irrigation always save water?
It delivers more of each pumped inch to the roots, but savings depend on management. If the saved water is used to irrigate more land, total use may not fall. Check local rules and get advice before a large change.
Farmonaut crop monitoring
See where your fields need water
Draw your fields once and Farmonaut shows satellite crop health and moisture maps for them through the season, on web, Android or iOS.




Sources
- USDA NASS, 2023 Irrigation and Water Management data now available (news release, 31 October 2024): nass.usda.gov
- Dieter et al., Estimated Use of Water in the United States in 2015, USGS Circular 1441 (2018): pubs.usgs.gov
- FAO AQUASTAT, Water use (methodology note): fao.org
- FAO, Irrigation Water Management: Irrigation Water Needs, chapter on irrigation efficiency: fao.org
- Rodell et al., Emerging trends in global freshwater availability, Nature (2018): nature.com
- Australian Bureau of Meteorology, Drought: rainfall deficiencies and water availability: bom.gov.au
- Texas Water Development Board, Ogallala Aquifer: twdb.texas.gov
- High Plains Underground Water Conservation District, 2026 Ogallala and Edwards-Trinity (High Plains) aquifer water level summary: hpwd.org
- Texas A&M AgriLife Extension, Irrigation systems for the Texas High Plains, bulletin B-6113: agecoext.tamu.edu
- SARE, Building Soils for Better Crops: Cover Crops: sare.org
- US EPA, Sources and Solutions: Agriculture (nutrient pollution): epa.gov
- US EPA, Nonpoint Source: Agriculture: epa.gov
Discussion
Questions, corrections or field experience? Share them below. First-time comments are reviewed before they appear, and your email is never published.
No comments yet. Be the first to add a question or your experience.

 ITC
 Dirks Bros Farms
 Red August Group
 Farm Inc
 WeMe Global
 Agrotoken
 Blue BearX
 Insignito
 Croptimum
 DnCubed
 Field Capacity
 Indosistim Teknologi
 Liquify Digital
 CU Foods
 BeyondTech Global
 Rouge VC
 AgroGreen Dynamics

 Licence holder · Niger · Gold
 Client · Tanzania · Gold
 Client · Somalia · Gold










