

Reviewed September 2026 against ICE Futures Canada and Trading Economics.
Try it: Run your own numbers →
ICE canola spot settled at C$822.50/tonne on September 4, 2026, and the front-month November 2026 futures contract was trading at C$810.20/tonne the same week, according to Trading Economics and ICE Futures Canada. That’s up 33.35% from where canola stood a year earlier and up 7.38% just since early August 2026. This page tracks what those numbers mean, where to check them yourself tomorrow, and how Saskatchewan cash prices and the broader canola oil and canola seed markets fit together.
Table of Contents
- Current Canola Futures and Spot Prices
- Saskatchewan Canola Prices in Context
- How the Canola Futures Contract Works
- The Canola Oil and Canola Seed Market
- What’s Moving the Canola Market
- Canola Contract Value Calculator
- How to Read Canola Futures Predictions
- FAQ
- Try it: Run your own numbers
Current Canola Futures and Spot Prices
The two numbers that matter for anyone pricing canola right now are the spot price and the front-month futures price, and they aren’t the same thing. ICE spot canola was C$822.50/tonne as of September 4, 2026 (Trading Economics, citing ICE Futures Canada data). The November 2026 futures contract — the nearest active delivery month on ICE at the time of writing — was quoted at C$810.20/tonne. The gap between the two reflects carrying costs and market expectations for the delivery period, not a data error; the research available for this piece does not include a published breakdown of that spread, so treat spot and futures as two separate reference points rather than interchangeable figures.
Year-over-year, canola is up 33.35% versus September 2025, and it gained 7.38% in the single month from August 4 to September 4, 2026 alone. That’s a fast move by canola’s usual standards, and it’s the reason “canola futures prices” and “canola futures predictions” are live searches right now — traders and farmers alike are trying to figure out whether the run continues or corrects.
| Metric | Value | As of | Source |
|---|---|---|---|
| ICE canola spot price | C$822.50/tonne | September 4, 2026 | Trading Economics / ICE Futures Canada |
| ICE canola November 2026 futures | C$810.20/tonne | September 2026 | ICE Futures Canada |
| Year-over-year change | +33.35% | Sep 2025 to Sep 4, 2026 | Trading Economics |
| One-month change | +7.38% | Aug 4 to Sep 4, 2026 | Trading Economics |
These figures move continuously during ICE trading hours, so a number printed on any web page — including this one — is a snapshot, not a live feed. For the current tick, go directly to ICE Futures Canada’s canola data page, which publishes settlement prices for every active contract month daily. Bookmark that page rather than relying on any single article’s figures, since canola futures can move several dollars per tonne between sessions.

Saskatchewan Canola Prices in Context
Saskatchewan grows more canola than any other Canadian province, which is why “canola prices saskatchewan” and “saskatchewan canola prices” are searched separately from the general futures query — growers there want a cash number, not just an exchange quote. Cash prices at a specific elevator or crush plant in Saskatchewan will sit at a basis (a dollar amount above or below the futures price) that reflects local freight costs, elevator demand, and proximity to crush capacity. That basis is not published in any national dataset this article can cite, and it changes by delivery point and week.
The reliable way to get a real Saskatchewan number is to call or check the pricing page of your local grain elevator or delivery point directly, and compare it against the same day’s ICE futures settlement from the link above — the difference between the two is your local basis. For provincial-level acreage and production estimates that underpin those cash prices, Statistics Canada publishes seeded-area forecasts in June and yield/production estimates in October and December each year, which is the standard reference point Canadian grain traders use to gauge how much Saskatchewan canola supply is actually coming to market.
How the Canola Futures Contract Works
ICE Futures Canada lists canola futures contracts for delivery in January, March, May, July, and November, each in units of 20 metric tonnes, priced in Canadian dollars per tonne. The November 2026 contract at C$810.20/tonne referenced above is the nearest active month as of this review; by the time you’re reading this, a different month will be the front contract, and the specific price will have moved. That’s a structural feature of any futures contract page, which is exactly why the ICE product page — not a cached price — is the correct source to check before making a pricing decision.
Full contract specifications, including tick size, delivery points, and expiry calendar, are published on ICE’s canola futures product page. If you’re searching “canola futures contract” specifically, that page — not a summary article — is the authoritative source for the mechanics: margin requirements, settlement procedure, and the exact delivery specification (Canada No. 1 Canada canola, in-store Vancouver or Thunder Bay).
Reading a Canola Futures Predictions Page
“Canola futures predictions” gets searched heavily, but there is no single authoritative forecast body for canola the way USDA WASDE forecasts corn or soybeans. What exists instead is a set of inputs a trader combines: the futures curve itself (the price differences between contract months on the ICE page above, which reflect the market’s own expectation of future supply and demand), Statistics Canada’s seeded-area and production estimates, and the price behavior of substitute oilseeds like soybeans and European rapeseed, which canola trades in close correlation with. A prediction built from those three inputs, updated against the current ICE curve, will be more current than any fixed number printed here.
The Canola Oil and Canola Seed Market
Global canola oil demand reached 29.4 million tonnes in 2025, per Mordor Intelligence data referenced by Trading Economics — a figure that captures both food use and the growing biofuel/renewable diesel feedstock market that has been pulling canola oil demand higher across North America. That demand pool is the backdrop for queries like “canola oil market,” “canola seed market,” and “us canola oil market”: the seed price, the oil price, and the meal (livestock feed byproduct) price move together but are quoted in different markets, and a search for one often really wants context on all three.
For the US-specific angle, canola oil competes directly with soybean oil in the domestic vegetable oil and biodiesel feedstock complex, and the two track each other closely because refiners and biodiesel producers substitute between them based on relative price. A separate, current breakdown of US crush capacity and the split between food-use and biodiesel-use demand was not available in the research for this piece; the IMARC Group canola oil market report is a starting point for market-size and demand-driver detail beyond the 2025 volume figure cited above.
Related reading on how canola fits into the broader commodities landscape: our overview of agricultural commodity trading trends and a primer on the top agricultural commodities, including where oilseeds rank against grains and softs.
Download our Android app or iOS app to track your own canola fields alongside market data.


What’s Moving the Canola Market
A 33.35% year-over-year gain and a 7.38% one-month gain are large enough moves that they’re rarely explained by a single cause. The factors most commonly cited by market commentary for canola price strength include:
- Substitute oilseed pricing: Canola trades closely with soybeans and European rapeseed; a supply constraint in either tends to lift canola as buyers substitute toward it.
- Canadian production estimates: Statistics Canada’s June seeded-area report and its October/December yield updates are the reference points the trade uses to gauge how much Canadian canola supply is coming; a below-trend estimate tends to support price.
- Biofuel feedstock demand: Rising renewable diesel and biodiesel capacity in North America has added a demand pool for canola oil beyond traditional food use, contributing to the 29.4 million tonne global demand figure cited above.
- Export logistics: Canadian canola exports move primarily through West Coast terminals; any disruption to rail or port throughput between the Prairies and Vancouver affects how quickly supply reaches export buyers, which can widen or narrow the basis growers see. Current terminal operating status is best checked directly with the terminal operator or Statistics Canada’s trade data rather than assumed from a prior year’s events.
What this article cannot do — and what no page should claim to do without live data access — is attribute the September 2026 price move to a specific, dated event with a citable source. The research base for this piece does not include a documented cause for the current rally beyond the price-level and percentage-change figures above. If you’re trying to trade or hedge around a specific catalyst, the ICE futures curve itself (near-month vs. deferred-month pricing on the ICE product page) is the most current signal of what the market currently expects, since it’s repriced continuously rather than published on a lag.
Weather and Crop Conditions
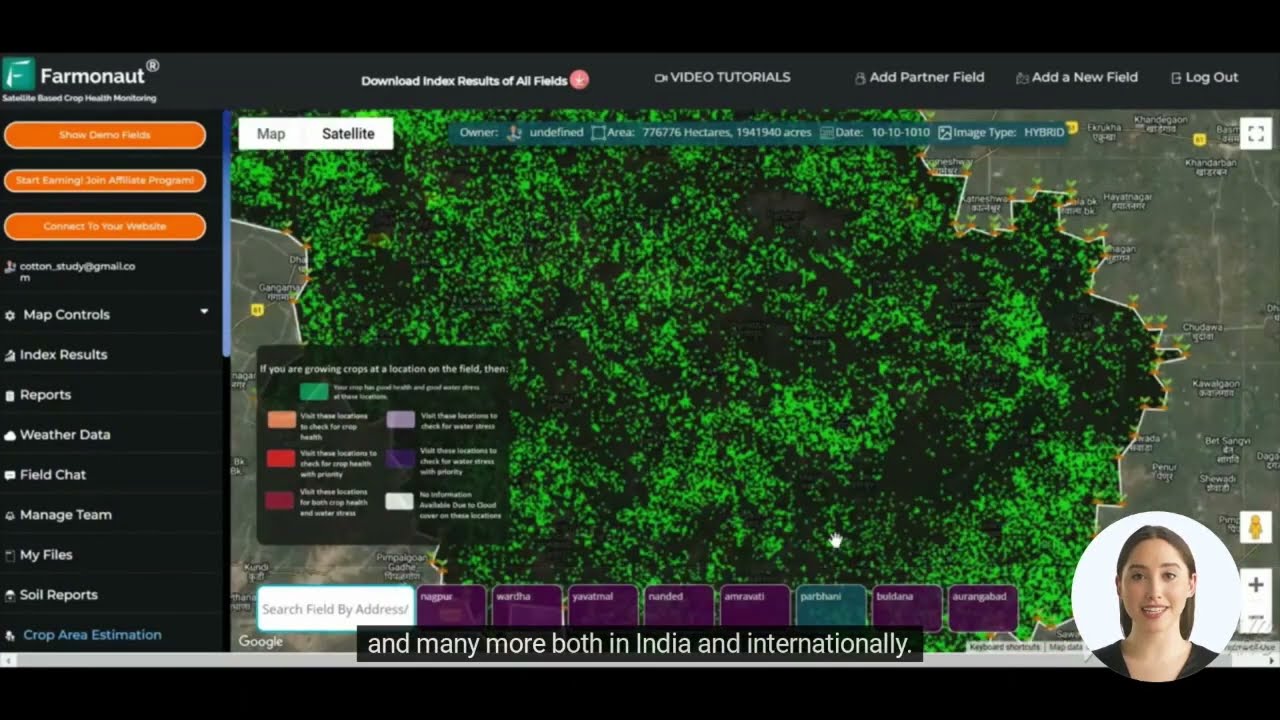
Canola yields on the Canadian Prairies are sensitive to moisture during flowering and pod-fill, the same as any oilseed. Real-time crop condition monitoring — rather than waiting for a monthly government report — is where satellite-based tools add value: Farmonaut’s platform tracks vegetation health (NDVI) and soil moisture across a field through the growing season, which lets a grower or buyer see a stress signal weeks before it shows up in a yield estimate.
Explore our web app to monitor field-level crop health alongside market prices.

Crude Oil and Currency Effects on Canola
Canola’s link to crude oil prices runs through two channels: biofuel demand (higher crude oil prices tend to make canola-based biodiesel more economically competitive) and input costs (fuel and fertilizer costs for growing canola). A third channel — the Canadian dollar’s exchange rate against the US dollar — affects how competitively priced Canadian canola exports are on the international market, since Canadian canola sold into US or overseas biodiesel and food markets is effectively priced in a foreign buyer’s currency once converted. None of these relationships is quantified with a current, citable figure in the research for this piece; readers hedging on this basis should check the current CAD/USD rate and crude benchmark alongside the ICE canola curve rather than relying on a fixed correlation number.
Canola Contract Value Calculator
A single ICE canola futures contract covers 20 metric tonnes, so the dollar value of a position depends on both the quoted price and the number of contracts. Enter your own price and contract count below to see the total value — the calculator does not store or send your data anywhere.
Run your own numbers
Assumptions: standard ICE canola contract size of 20 metric tonnes; the default price of C$810.20 is the November 2026 futures quote cited above and will not match live pricing — replace it with the current settlement from the ICE data page. The basis field is a manual entry for local cash-price adjustments and is not sourced from any live feed. This calculator excludes commissions, margin requirements, and delivery costs.
How to Read Canola Futures Predictions
Rather than repeating a single forecast number that will be wrong within days, here is the method a working trader or grower uses to form a canola price view, updated with whatever the current data shows:
- Check the futures curve, not just the front month. On the ICE canola data page, compare prices across January, March, May, July, and November contracts. A curve sloping upward into later months (contango) suggests the market expects tighter near-term supply; a downward slope (backwardation) suggests the opposite.
- Cross-reference Statistics Canada’s production data. The June seeded-area report and October/December yield estimates at statcan.gc.ca tell you whether Canadian supply is running above or below the prior year.
- Watch soybean and rapeseed prices. Because canola substitutes with both in the vegetable oil and meal markets, a sustained move in either tends to pull canola with it.
- Track your local basis separately. The futures price is a national benchmark; your actual price depends on the basis at your nearest delivery point, which your local elevator publishes directly.
This four-step method doesn’t expire the way a single number does — it’s the same process whether canola is at C$800/tonne or C$900/tonne, which is the point of using it instead of memorizing today’s price.

Precision Tools for Canola Growers
Beyond price tracking, canola growers managing price risk benefit from tighter visibility into their own yield potential, since knowing your likely production ahead of harvest changes how you use futures and forward contracts to hedge. Farmonaut’s satellite monitoring platform provides field-level NDVI, soil moisture, and weather data through the growing season, and the API lets larger operations and agribusinesses pull that data into their own market-analysis or risk-management systems.
Good soil health management also plays into long-run canola yield stability, since canola is more sensitive to soil compaction and nutrient timing than some cereal crops. That connects to the broader category of Canadian agricultural products and waste-management practices that affect input costs on the same farms growing canola as a rotation crop, often alongside other cash crops.
Canola Demand and Downstream Buyers
The 29.4 million tonne global canola oil demand figure for 2025 sits inside a supply chain that runs from Prairie fields through crush plants to food manufacturers and biodiesel refiners. Food and beverage manufacturers using canola oil as an ingredient face the same price volatility documented above, and increasingly need to demonstrate supply-chain sustainability credentials to retail and institutional buyers — a trend covered in our piece on sustainable agriculture for food manufacturers.
Ready to pair market awareness with field-level data? Explore our subscription options below:
FAQ
Q: What is the current canola futures price?
A: ICE canola spot was C$822.50/tonne and the November 2026 futures contract was C$810.20/tonne as of September 4, 2026, per Trading Economics and ICE Futures Canada. Because these prices update continuously during trading hours, check the live ICE data page for the current tick.
Q: How much have canola prices risen recently?
A: Canola gained 33.35% year-over-year (September 2025 to September 4, 2026) and 7.38% in the single month from August 4 to September 4, 2026, according to Trading Economics.
Q: How do I find Saskatchewan canola cash prices specifically?
A: There is no single published Saskatchewan cash price; it’s the ICE futures price plus or minus a local basis set by each elevator or crush plant. Check your nearest delivery point’s posted price against the same-day ICE futures settlement to calculate your basis.
Q: What size is one canola futures contract?
A: ICE canola futures trade in units of 20 metric tonnes, priced in Canadian dollars per tonne, with contract months in January, March, May, July, and November. Full specifications are on the ICE product page.
Q: How big is the global canola oil market?
A: Global canola oil demand volume was 29.4 million tonnes in 2025, per Mordor Intelligence data cited by Trading Economics.
Q: Is there an official canola futures prediction or forecast?
A: No single authoritative forecast body exists for canola the way USDA issues WASDE forecasts for corn and soybeans. The closest working method is reading the ICE futures curve across contract months alongside Statistics Canada’s seeded-area and yield estimates — see the step-by-step method above.
Q: How can farmers track crop conditions that affect canola pricing decisions?
A: Satellite-based platforms like Farmonaut provide field-level NDVI and soil moisture monitoring through the growing season, giving an earlier read on yield potential than waiting for government crop reports.

Canola prices will keep moving with the futures curve, Prairie production estimates, and substitute-oilseed pricing — the method above, not any single figure on this page, is what stays useful as those numbers change.

 Raketla
 Polaris Digitech
 Teledarbas
 Wild Oak Farm
 SFX
SFX BACF Africa
 Doodlakine
 Exurbia Geospatial
 FieldZero
 Indico Company
 Kubota
 FFBS
FFBS Jontra
 Tucor
Tucor
