

Reviewed August 2026 against USDA Economic Research Service farm-technology data, land-grant Cooperative Extension pest-monitoring guidance (Iowa State University and Alabama’s ACES), and FAO global crop-loss estimates.
Try it: Calculate Your Own Scouting Time & Cost Savings →
Automated Pest Monitoring System Market: 7 Shocking Innovations
An automated pest monitoring system is a network of sensors, cameras, or connected traps that detects and counts pests in a field or structure and reports the data to a phone or dashboard without a person walking the rows. The global market for these systems is a genuinely small, fast-growing category — one industry estimate puts it at $2.71 billion in 2025 (Market Research Future) — and the adjacent precision-agriculture toolkit it plugs into is already mainstream on large U.S. farms. Below: what these systems cost to run versus scout by hand, which device category fits a row-crop field versus a greenhouse, the degree-day method that tells you when to actually deploy them, and a calculator to run your own numbers.
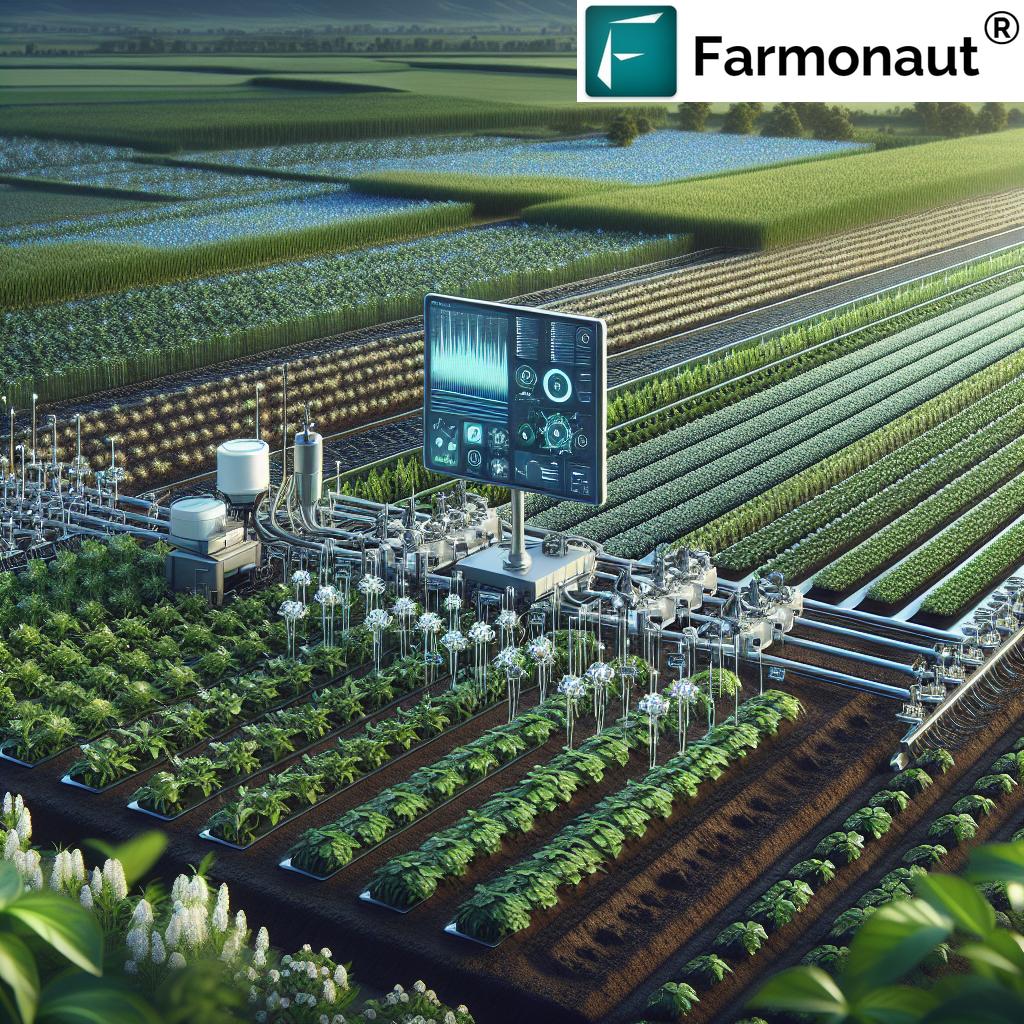
A pest monitoring system, automated or not, exists to answer one question: is the pest population in this field or house above the level where control pays for itself? Manual scouting answers that question with a person and a clipboard, walking a fixed pattern on a schedule. Automated systems answer it with a trap that counts continuously, a camera that photographs and classifies, or a satellite pass that flags stressed canopy before symptoms are visible on the ground. The rest of this article treats those as the actual product category — not a synonym for pesticide sprayers — and covers cost, deployment type, and the underlying method so the numbers stay usable after this year’s device prices change.
Why Automated Pest Monitoring Matters Now
Pests and diseases account for a reduction of between 20 and 40 percent of global crop yields every year, according to the Food and Agriculture Organization of the United Nations. That range is wide because it spans every crop and region FAO tracks — the number for a specific farm depends on the pest complex, the crop, and how early it’s caught, which is exactly the variable an automated pest monitoring system is built to shrink. Three forces make this the moment growers are converting from manual scouting to automated detection:
- Targeting beats blanket spraying. Continuous trap or camera data lets a grower spray a 40-acre hot spot instead of an entire 400-acre field, cutting input volume without cutting yield protection — the same logic behind integrated pest management programmes.
- Environmental exposure drops. Less blanket application means less pesticide reaching soil and waterways, which is the core rationale behind integrated pest management (IPM) programs that USDA, EPA, and land-grant extension services have promoted for three decades.
- The economics are documented for adjacent tools. USDA’s Economic Research Service measured per-acre savings from precision technologies on U.S. corn farms (USDA ERS, Amber Waves); monitoring is bought on the same cost-avoidance logic.
- Try it: Calculate Your Own Scouting Time & Cost Savings
How Automated Pest Monitoring Systems Work
Every system on the market, from a pheromone trap with a counter to a satellite-fed dashboard, runs the same four-step loop: collect field data (images, insect counts, temperature, humidity, canopy reflectance), classify it against a pest model, push the result to a phone or web dashboard, and trigger an alert once a threshold is crossed. What differs between products is which step is automated and which still needs a human — a plain sticky card automates none of it, a camera trap automates the first two, and a full IoT platform automates all four.

Automated Pest Monitoring System Market Size & Growth
Industry-research firms scope this market differently — some count only field hardware, others fold in software subscriptions and services, which is why headline numbers you’ll see quoted range from the low hundreds of millions to several billion dollars for the same “automated pest monitoring system market” label. Rather than stack contradictory figures, here is one full report, verified directly: Market Research Future values the global automated pest monitoring system market at $2.487 billion in 2024, rising to $2.707 billion in 2025, and projects $6.304 billion by 2035 — an 8.82% compound annual growth rate over that decade (Market Research Future, automated pest monitoring system market report). That is the trajectory behind the “smart pest monitoring management system market” and “automated pest monitoring system market” searches this article targets.
For a number that stays current past this review date, don’t rely on a single vendor’s report: pull the free summary tables that most market-research firms publish (base year, forecast year, and CAGR are usually shown without a paywall), and compare at least two so you can see whether they’re scoping hardware only or hardware plus subscriptions.
Who sells automated pest monitoring systems
The market is made up of a few distinct product types, each with established vendors:
- Camera traps for field crops. DTN sells Smart Traps, camera-equipped sticky traps that send images and counts to a dashboard (see the Alabama Extension review below).
- Pheromone camera traps with AI identification. Trapview, founded in Slovenia in 2007, photographs moths caught in pheromone traps and uses image recognition to count and identify them. Its traps are used on grapes, tomatoes, olives, tree fruit and brassicas (CNN Business).
- Orchard sensor networks. Vancouver-based Semios runs wireless sensor networks in fruit and nut orchards that track pest pressure and weather, and can release mating-disruption pheromones automatically (Smithsonian Magazine).
- Remote sensing. Satellite and drone services flag stressed canopy across whole farms, but they detect crop stress, not individual insects, so they point scouts to where to look.
A review of camera traps in the Journal of Pest Science found they cut the labour of checking traps but still depend on good image quality and on counts being checked against ground truth, which matches the Alabama Extension findings. When comparing vendors, ask which pests the model has been trained on for your region, how often traps must be serviced, and what the annual subscription covers.
Growth Drivers and the Real Cost Savings Behind Them
What actually drives a farm to switch from manual scouting to an automated pest monitoring system is rarely the pest itself — it’s the per-acre economics of the broader precision toolkit it belongs to. USDA’s Economic Research Service measured per-acre cost savings from adjacent precision technologies on U.S. corn farms: guidance/autosteering systems saved $15 per acre (2.7% of production costs), GPS soil mapping saved $13 per acre (2.4%), yield mapping saved $25 per acre (4.5%), and variable-rate technology (VRT) combined with yield mapping saved $22 per acre versus $21 per acre for VRT with soil mapping alone (USDA ERS, Amber Waves). Automated pest monitoring is priced and adopted on the same logic — it earns its place in the equipment budget by avoiding a cost, not by adding a feature.
Calculate Your Own Scouting Time & Cost Savings




How to Automate Pest Monitoring: Sensors, AI & Degree-Days
Moving from manual scouting to automated pest monitoring is a five-step process, and it works the same whether you're deploying connected pheromone traps or a satellite subscription:
- Identify your target pest(s) and their known degree-day thresholds — this determines what device category even makes sense (a camera trap for moths, a soil sensor for rootworm).
- Place sensors or traps at the density the pest's spread pattern requires — edge-heavy for invasive pests entering from field margins, grid-spaced for pests distributed uniformly by weather.
- Connect the device to a cellular or Wi-Fi gateway so counts reach a dashboard without a daily manual check.
- Set an economic threshold alert, not just a presence alert — a system that pings you the moment it sees one insect will train you to ignore it.
- Log the season's data against your own yield and spray records so next year's threshold is calibrated to your field, not a generic default.
Step one is the one growers skip, and it's the one that actually makes monitoring "automated" instead of just "digitized." Because insects are ectothermic, their development rate tracks accumulated heat, not the calendar — which is why land-grant extension entomologists time scouting and trap deployment to growing degree days (GDD) rather than fixed dates. Iowa State University Extension and Outreach publishes the lower and upper developmental thresholds behind this method for several major field-crop pests:
| Pest | Lower Developmental Threshold | Upper Developmental Threshold | Why It Matters |
|---|---|---|---|
| Seedcorn maggot | 39°F | 84°F | Sets when to deploy traps in early spring before planting |
| Western corn rootworm | 52°F (soil) | 86°F | Soil-threshold pest — timing tied to seed-zone temperature, not air temperature |
| Soybean aphid | 50°F | 95°F | Wide thermal window means monitoring needs to start earlier and run longer |
Source: Iowa State University Extension and Outreach, Integrated Crop Management, "Growing Degree Days for Insect Pests." Thresholds are per-pest constants published by extension entomologists — check the same page for pests not listed here before setting your own alert dates.
On the sensing side, artificial intelligence and IoT connectivity are what turned this from a manual-count method into something that runs itself. AI models trained on trap-camera images now classify pest species from photos automatically, and connected traps can trigger an automated pest control action — activating a pheromone dispenser or logging a spray recommendation — the moment a count crosses the degree-day-adjusted threshold, instead of waiting for the next scheduled scouting visit.
Field, Farm & Greenhouse Deployments Compared
"Automated pest monitoring" covers meaningfully different hardware depending on where it's deployed. A field pest monitoring system built for 500 open acres and a smart pest monitoring setup built for a 20,000-square-foot greenhouse solve different problems and don't share a parts list.
Field and Row-Crop Systems
Outdoors, the dominant hardware is the connected trap. Alabama's Cooperative Extension System documents two commercial designs from DTN: Z-Traps, which use bioimpedance sensors and a metal zapper to count and kill moths, transmitting data over a cellular connection every 24 hours; and Smart Traps, camera-equipped sticky traps (on the market since 2018) that photograph catches and send counts and images to a software dashboard automatically (Alabama Cooperative Extension System). The same extension article flags real limitations worth knowing before buying: neither trap type predicts actual larval load on the crop itself, Z-Traps can misfire on plant debris, and Smart Traps can fill up during peak flight periods and need more frequent physical emptying — automation reduces labor, it doesn't eliminate the field visit entirely.
At the larger end of "field pest monitoring system," satellite and drone imagery add a layer traps can't: they flag crop stress from pest pressure across a whole field or region before symptoms are visible from the ground, which matters most on farms too large to scout on foot every week.
Greenhouse and Controlled-Environment Monitoring
An automated greenhouse monitoring system is built around a closed, climate-controlled space rather than open acreage, and that changes the hardware: yellow and blue sticky-card counts for whiteflies and thrips, humidity and leaf-wetness sensors tied into the same controller that runs the vents and misting lines, and shorter sensor-to-alert distances because a greenhouse outbreak can move through a crop in days rather than weeks. If what you're actually searching for is nutrient or environmental monitoring for a soil-free hydroponic system rather than pest detection, that's a distinct equipment category — pest counting devices and hydroponic nutrient/EC monitoring are not interchangeable hardware, and this article stays in its lane on the pest side.
| Deployment | Primary Hardware | Typical Coverage | Key Constraint |
|---|---|---|---|
| Field / row crop | Cellular smart traps, drone or satellite imagery | Tens to thousands of acres | Cellular signal in remote fields; wide degree-day windows |
| Orchard / specialty crop | Pheromone traps with camera or bioimpedance counters | Block-by-block, tree rows | Trap density needed for reliable edge-entry detection |
| Greenhouse / controlled environment | Sticky-card counts, humidity/leaf-wetness sensors tied to climate control | Single structure, sq. ft. | Fast outbreak spread demands short alert-to-action time |
Farmonaut's carbon footprinting feature helps farms and agribusinesses track and reduce environmental impact with real-time emissions data alongside crop and pest monitoring.
Challenges Facing Automated Pest Monitoring Systems
Adoption has accelerated, but four practical barriers still slow it down, especially for smaller operations:
- Upfront hardware cost. Traps, sensors, and gateway hardware are a capital outlay before any savings materialize — weigh it against the per-acre savings figures above, not against the pest problem alone.
- Awareness gaps. Many growers have not seen a side-by-side comparison of manual scouting time against an automated system's alert-to-action time on their own crop.
- Connectivity. Cellular-connected traps and IoT sensor networks depend on signal that isn't uniform across every rural field — check coverage at the actual field location, not the farm office, before buying.
- Data security. Field and yield data flowing to a cloud dashboard is a new attack surface; ask any vendor directly how field data is stored and who else can access it.
Farmonaut's platform enables satellite-based verification for crop loans and insurance, reducing risk for both farmers and lenders through the same monitoring data used for pest and crop-health tracking.
7 Innovations Changing Automated Pest Monitoring
1. AI-Driven Visual Pest Identification
Deep-learning models trained on trap and field-camera images classify pest species automatically, cutting the manual identification step out of scouting entirely.
2. IoT-Enabled Smart Pest Traps
Cellular- or Wi-Fi-connected traps stream counts continuously and can trigger an automated pest control action, such as a pheromone dispenser, once a threshold is crossed.
3. Drone-Based Pest Surveillance
Drones fitted with imaging sensors scan large fields fast, flagging infestation hot spots for targeted follow-up instead of a full-field walk.
4. Predictive Analytics & Outbreak Forecasting
Models combining weather history, degree-day accumulation, and crop stage forecast outbreaks before they happen, shifting scouting from reactive to scheduled.
5. Satellite-Based Crop and Pest Stress Monitoring
Multispectral satellite passes flag canopy stress consistent with pest pressure across a whole farm, even on ground too remote to scout weekly.
6. Integrated Farm Management Platforms
Single dashboards combine pest, irrigation, resource, and yield data so a pest alert shows up alongside the field conditions that explain it.
7. Blockchain-Enabled Pest & Supply Chain Traceability
Immutable records of on-farm pest-management practices support organic certification claims and buyer audits without a paper trail.
| Innovation | Technology Used | Best Fit |
|---|---|---|
| AI-Driven Visual Pest ID | AI, machine learning | Camera traps, smartphone scouting apps |
| IoT Smart Pest Traps | IoT, cloud analytics | Row crops, orchards |
| Drone-Based Surveillance | Drones, imaging sensors | Large or irregular-shaped fields |
| Predictive Outbreak Forecasting | AI, weather and degree-day data | Regionally coordinated pest programs |
| Satellite Crop/Pest Monitoring | Multispectral satellite imaging | Remote or very large acreage |
| Integrated Farm Platforms | IoT, cloud, AI | Mixed-operation farms tracking several inputs at once |
| Blockchain Traceability | Blockchain, IoT | Organic and export-certified supply chains |
Farmonaut lets producers and food companies authenticate every stage of crop production and supply-chain movement, from field practices to the end buyer.
Farmonaut: Data-Driven Farm Management for Pest Monitoring
Farmonaut brings several of the categories above into one accessible platform rather than a single point tool:
- Satellite-Based Crop Health Monitoring — multispectral imagery tracking NDVI, soil moisture, and pest-disease stress signals to target interventions instead of blanket-spraying a field.
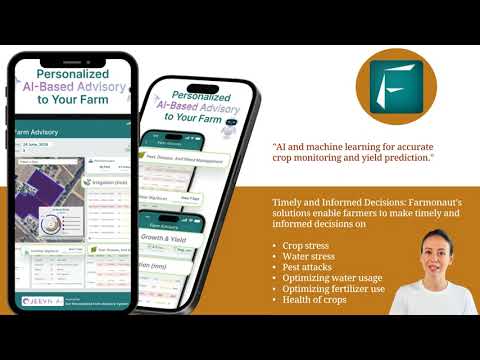
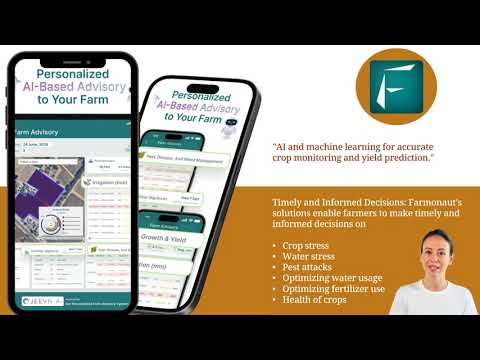
- Jeevn AI Advisory — combines satellite data with local weather to deliver pest and crop management guidance.
- Blockchain-Based Traceability — tracks chemical usage and supports organic-certification recordkeeping for corporate and export buyers.
- Resource, Fleet, and Farm Management — subscription platform plus API access (see API; developer docs) for large-scale plantation management, logistics, and crop area/yield estimation.
- Carbon Footprinting — tracks and reports emissions alongside crop and pest data.
Optimize agricultural logistics and equipment uptime alongside your pest and crop monitoring in one platform.
Built for plantations and agribusinesses needing resource allocation and yield forecasting across many fields at once.
Frequently Asked Questions
What is an automated pest monitoring system?
A network of sensors, cameras, or connected traps that detects and counts pests and reports the data to a dashboard automatically, replacing or supplementing manual field scouting.
What does an automated pest monitoring system cost?
Pricing isn't standardized across vendors the way seed or fertilizer prices are — get a current quote directly from device makers for your acreage and pest target, and compare it against your own labor cost per hour using the calculator above rather than a published average.
How do these systems reduce pesticide use?
By pinpointing where pest pressure actually crosses an economic threshold, growers spray only the affected area instead of the whole field, which is the core idea of integrated pest management.
What's the difference between a field system and a greenhouse system?
Field systems (cellular smart traps, drones, satellite) cover open acreage and work on wide degree-day windows; greenhouse systems use sticky-card counts and climate sensors tied into the same controller running vents and misting, because outbreaks in an enclosed space move faster.
How does IoT enhance pest monitoring?
It connects traps, sensors, and cameras to a cloud dashboard so counts arrive continuously instead of on the scouting schedule, and can trigger an automated response the moment a threshold is crossed.
Is automated pest monitoring worth it for a small farm?
Run your own acreage, scouting frequency, and labor rate through the calculator above — the per-acre savings USDA ERS documented for adjacent precision technologies (see the Growth Drivers section) scale down as well as up, so the arithmetic works the same regardless of farm size, even though device cost per acre does not.


Further reading:
Conclusion
The category behind "automated pest monitoring system market" searches is small in absolute dollars — $2.71 billion globally in 2025 by one verified estimate — but the adoption curve underneath it is already steep: guidance autosteering alone was used on 52% of midsize and 70% of large-scale U.S. crop farms in 2023 (USDA ERS), and the per-acre savings from that stack are documented in USDA's own economic research, not vendor marketing. What doesn't expire with this year's device prices is the method: degree-day thresholds tell you when a pest is actually active regardless of the calendar, and matching hardware to deployment (field trap, drone, satellite, or greenhouse sensor) matters more than any single spec sheet.
Platforms like Farmonaut combine several of these layers — satellite monitoring, AI advisory, traceability, and resource management — so a farm doesn't have to buy point solutions from five different vendors to get one dashboard.
For developers and businesses integrating pest monitoring into custom software, Farmonaut's API and developer documentation cover satellite and weather data access directly.
For an in-depth look at real solutions and to start your own farm data journey, visit Farmonaut.com.

 Abhishta Agri
 SP Farms
 Indosistim Teknologi
 Liquify Digital
 CU Foods
 BeyondTech Global
 Rouge VC
 AgroGreen Dynamics
 AgroRisk
 Oath Inc
 Reddane Farming
 Esri North East Africa
 Cresol
 MDCV UK
 Zerella Group
 Etech Consulting Madagascar
 Vestlandsforsking
 Delicio
