

Reviewed September 2026 against USDA Economic Research Service and AEM/USDA precision agriculture data.
Try it: Run your own numbers →
Smart farming systems are connected networks of sensors, guidance hardware, and software that let a farm operator see soil, crop, and machine conditions in real time instead of guessing at them. On the ground in the United States, that shift is already well underway: USDA’s Economic Research Service found that 70% of large-scale crop farms were using guidance autosteering systems as of its 2023 survey, and 68% of large-scale farms were using yield monitors, yield maps, and soil maps in the same dataset. This article covers what IoT for smart farming actually delivers today, what it costs, where the agriculture industry is putting it to use, and what role AI for farmers realistically plays right now.
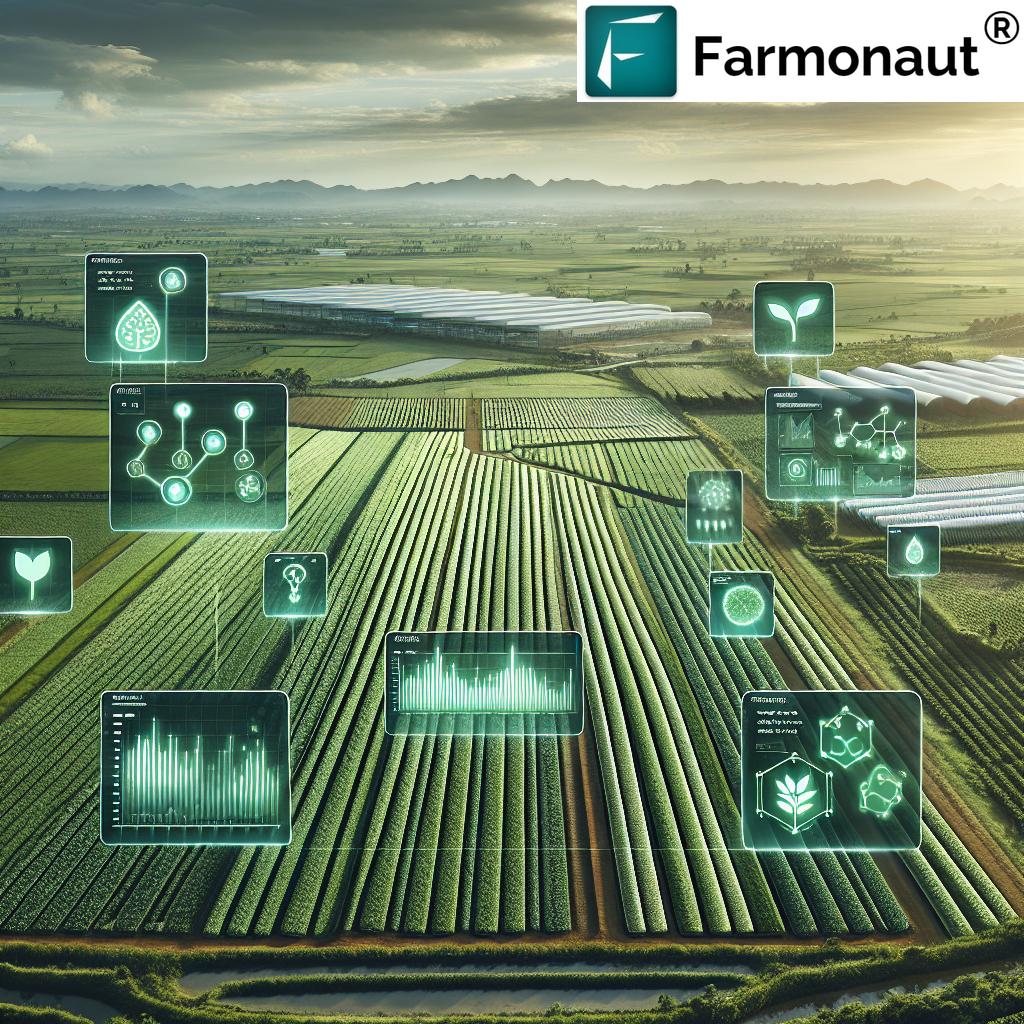
Table of Contents
- What Smart Farming Systems Actually Are
- Who’s Actually Using IoT for Smart Farming: The 2023 USDA Numbers
- The Economic Case: Productivity Gains and Per-Acre Value
- Seven Smart Farming Systems and What Each One Does
- IoT Smart Services: What a Farm Actually Buys
- Calculator: What Could Precision Ag Be Worth on Your Acreage?
- Comparative Benefits Table of IoT Solutions in Agriculture
- AI for Farmers: What’s Real and What’s Still Unpublished
- Farmonaut: Making Precision Agriculture Accessible
- How to Access Farmonaut: Web App, Mobile Apps, and API
- Farmonaut Subscription Model
- Challenges and Considerations
- Frequently Asked Questions
- Conclusion
What Smart Farming Systems Actually Are
A smart farming system connects field sensors, guidance electronics, and farm software so that decisions about water, nutrients, and machinery pass are based on measured conditions rather than a fixed calendar. The category covers autosteering and GPS guidance on tractors and sprayers, yield monitors that map output across a field in real time, soil and moisture sensors, weather stations, drone and satellite crop imagery, and the data platforms that tie all of it together. “IoT for smart farming” is the connectivity layer underneath all of it: the sensors, gateways, and network links that move field data to a phone, tablet, or farm office without a person walking the field to collect it.
The agriculture industry has been building toward this for over two decades, starting with GPS-guided equipment in the late 1990s and expanding into yield mapping, variable-rate application, and now satellite-based crop monitoring that needs no field hardware at all. What’s changed recently is not the concept but the adoption curve: USDA’s own survey work, discussed in detail below, shows the technology has crossed from early-adopter territory into the majority practice on large commercial farms.
Who’s Actually Using IoT for Smart Farming: The 2023 USDA Numbers
The clearest published picture of US adoption comes from the USDA Economic Research Service’s precision agriculture adoption research, which breaks adoption down by farm size and technology type. As of the 2023 survey data:
- 70% of large-scale crop farms were using guidance autosteering systems.
- 68% of large-scale US farms were using yield monitors, yield maps, and soil maps.
- 52% of midsize US farms were using guidance autosteering systems.
The gap between large-scale and midsize adoption — 70% versus 52% for the same autosteering technology — is the single most useful number in this dataset for anyone sizing up where their own operation sits relative to peers. It shows autosteering has already cleared majority adoption even at midsize, while still running meaningfully higher at scale, likely reflecting equipment cost amortized over more acres. USDA ERS updates this research periodically following farm census cycles; the agency’s next comprehensive update is expected in 2026, so check the publication page linked above directly for the current release before citing these percentages as this year’s figures.
The Economic Case: Productivity Gains and Per-Acre Value
Adoption numbers only matter if the technology pays for itself, and this is where a joint industry-government analysis fills the gap. The Association of Equipment Manufacturers’ precision agriculture benefits report, produced with USDA, quantifies both the productivity gain already realized and the value left on the table:
- Precision agriculture adoption has already delivered a 5% increase in farm productivity.
- Broader adoption across the sectors not yet using these tools could add a further 6 percentage points of productivity gain.
- The report puts the annual economic value of precision agriculture at $118 per acre per year.
On a 1,000-acre operation, $118 per acre works out to roughly $118,000 per year in aggregate value under this AEM/USDA estimate — not a guaranteed return for any individual farm, since the report is a national-level economic analysis, but a useful benchmark for weighing a five- or six-figure equipment or subscription decision. The calculator further down this page lets you run that math against your own acreage and the subscription cost of a monitoring platform.
Seven Smart Farming Systems and What Each One Does
Below are the seven categories of connected technology doing the actual work on farms today, from the field-level sensors that feed decisions to the traceability layer that carries those decisions through to the consumer.
1. Precision Farming Technologies: From Data to Decision-Making
Precision farming technologies use field-level data — soil moisture, temperature, nutrient status — to replace whole-field averages with zone-by-zone management. This is the category USDA measures directly: the 70% autosteering figure and 68% yield-mapping figure cited above both fall under this umbrella, and they represent the most mature, most measured segment of smart farming adoption in the US.
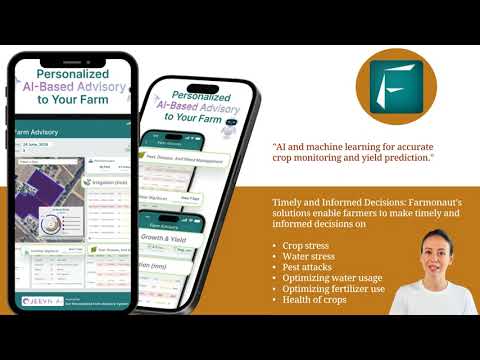
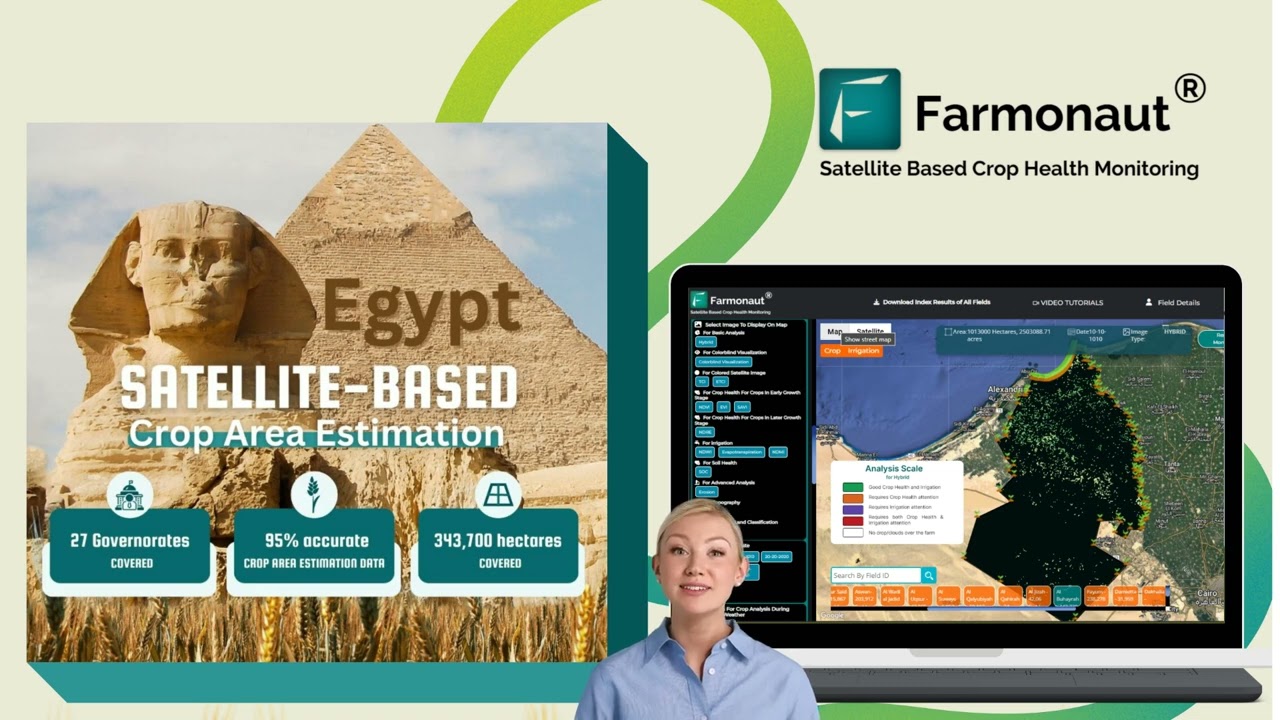
Farmonaut’s platform approaches precision farming from orbit rather than from field hardware: satellite-based NDVI vegetation health data, soil moisture monitoring, and AI-assisted advisory delivered without sensors to install or maintain in the field.



2. Smart Irrigation Systems: Optimizing Every Drop
Smart irrigation systems pair soil moisture sensors with weather data to automate watering schedules instead of running on a fixed calendar. This matters most in water-constrained growing regions — the western US, in particular, where irrigation districts and state water boards increasingly require metered, documented water use.
The specific percentage reduction in water use from smart irrigation on US row-crop or specialty-crop acreage is not part of the USDA ERS or AEM datasets cited above; those cover autosteering, yield mapping, and aggregate productivity, not irrigation-specific savings. If you need a water-savings figure for a grant application, sustainability report, or your own field trial, USDA’s annual Technology Use Survey (released each August) is the right primary source to check for current farm-level connectivity and technology-use statistics, alongside your local extension service or irrigation district, which typically track savings for the crops and soils in your specific region.
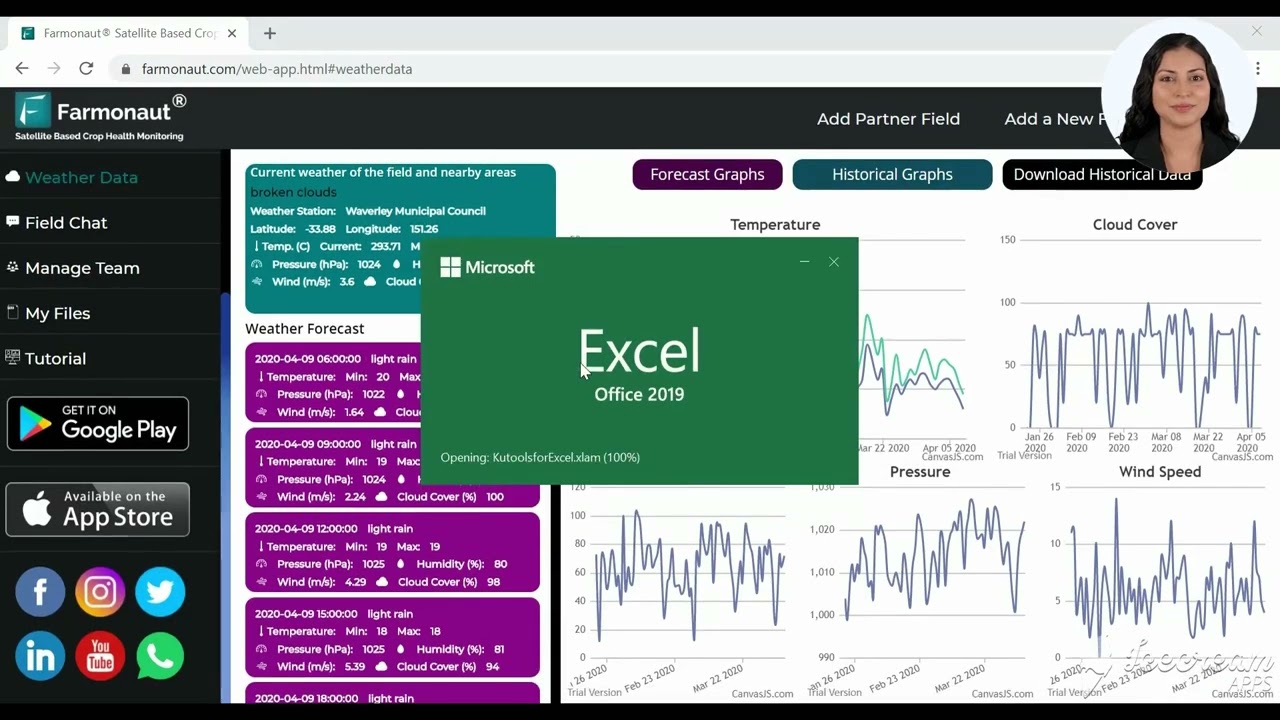
Farmonaut’s satellite-based soil moisture and weather monitoring feeds directly into irrigation timing decisions without requiring in-field soil probes.
Further Reading: Farmonaut’s Plantation, Crop, and Forest Advisory Tools combine remote sensing data with practical irrigation recommendations.
3. Crop Monitoring and Disease Detection: Proactive Crop Health
Crop monitoring combines drone imagery, ground sensors, and satellite data to flag disease pressure, pest infestation, and nutrient deficiency before visible symptoms spread across a field. This is where scouting labor is most directly displaced: a field that once needed a walked transect now gets a standing alert when a vegetation-index anomaly appears in a specific zone.
Farmonaut’s AI-driven crop advisory uses satellite and field-sensor data to flag changes in crop vigor and route alerts to the grower automatically.
Learn More: Farmonaut Crop Monitoring Platform lets growers diagnose problems from a phone or browser.
4. Livestock Monitoring Solutions: Smart Animal Management
IoT extends past row crops into livestock operations through wearable sensors and behavior-tracking collars that monitor health status, location, and reproductive cycles on cattle, sheep, and other herds. These systems catch illness earlier than visual inspection alone and reduce the labor needed to check a herd spread across pasture.
Farmonaut’s fleet and resource management tools extend this connected-monitoring approach to the vehicles and equipment that support livestock and row-crop operations alike, giving larger operations one view of both machinery and herd logistics.
5. Environmental Monitoring for Farms: Adapting to Nature in Real Time
Environmental monitoring covers temperature, humidity, soil condition, and atmospheric readings that let a farm adjust planting, harvest timing, and input use to actual conditions rather than a historical average. It’s also increasingly tied to compliance: carbon accounting and emissions tracking are becoming a documentation requirement for supply contracts with larger buyers and for certain USDA conservation program applications.
Farmonaut’s carbon footprinting tools measure emissions for sustainability reporting, tying into the same resource-management discipline used across other land-based industries.

6. Supply Chain Traceability in Agriculture: Ensuring Food Safety and Trust
Supply chain traceability connects field-level IoT data to a permanent, verifiable record as product moves from farm to buyer — harvest date, storage conditions, transport temperature, and processing steps. For US producers, this increasingly overlaps with FDA Food Safety Modernization Act recordkeeping requirements for certain high-risk foods, making a digital chain of custody a practical necessity rather than a nice-to-have.
Farmonaut’s blockchain-based product traceability system integrates with farm data for end-to-end tracking.
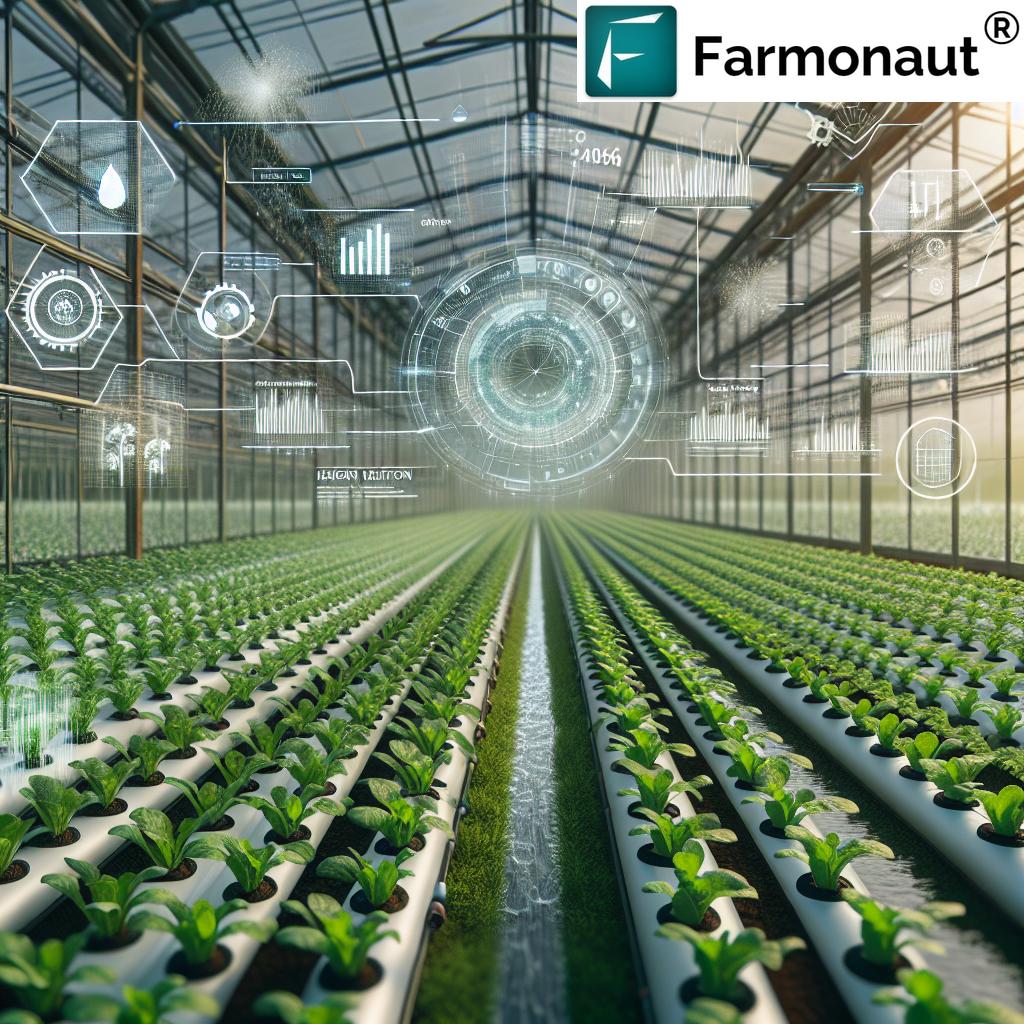
7. Smart Greenhouses & Automated Fertilization: Controlled Growth and Resource Optimization
Smart greenhouses automate lighting, temperature, humidity, and ventilation to hold crops in a consistent environment regardless of outside conditions, a category particularly relevant to the specialty-crop and controlled-environment sector. Paired with automated fertigation, nutrients are applied at the rate and timing a crop’s growth stage calls for rather than on a fixed schedule, cutting the runoff associated with blanket applications.
Farmonaut’s platform supports greenhouse growers with sensor integration and automated recommendations spanning irrigation, fertilization, and resource tracking.
IoT Smart Services: What a Farm Actually Buys
“IoT smart services” is the layer of subscriptions and managed platforms that sit on top of the hardware described above — the thing a farm operator actually pays for and logs into, as distinct from the sensors themselves. In practice, this breaks into three purchasing models:
- Hardware-plus-subscription: field sensors or telematics devices sold with an ongoing data-service fee, typical of equipment-manufacturer platforms.
- Satellite/software-only: no field hardware at all — imagery and analytics delivered through a subscription, the model Farmonaut uses, which removes the sensor installation and maintenance cost entirely.
- API/developer access: raw satellite and weather data delivered programmatically for operations building their own internal tools, rather than using a vendor’s dashboard.
Farmonaut’s API and developer documentation serve that third model directly, for operations or software vendors who want to merge satellite and weather data into a proprietary platform rather than use a pre-built dashboard.
Calculator: What Could Precision Ag Be Worth on Your Acreage?
Enter your acreage and an estimated annual subscription or equipment cost to see the AEM/USDA per-acre value estimate applied to your own operation, net of what you’d spend on the technology.
Run your own numbers
Assumptions: uses the AEM/USDA national estimate of $118/acre/year in precision agriculture value (2023 whitepaper); this is an aggregate economic estimate, not a guaranteed per-farm return, and excludes financing costs, installation labor, and crop- or region-specific variation. Use it to size a budget conversation, not as a substitute for your own trial.
Comparative Benefits Table of IoT Solutions in Agriculture
| Smart Farming System | Documented Adoption / Impact | Source | Technology Example |
|---|---|---|---|
| Guidance Autosteering | 70% of large-scale US farms, 52% of midsize US farms (2023) | USDA ERS | GPS-guided tractors and sprayers |
| Yield Monitors / Yield & Soil Mapping | 68% of large-scale US farms (2023) | USDA ERS | Combine-mounted yield sensors, GIS mapping |
| Precision Ag, aggregate productivity | +5% realized; +6 points more possible with broader adoption | AEM/USDA | Variable-rate application, guidance systems |
| Precision Ag, economic value | $118 per acre per year | AEM/USDA | Combined precision technology stack |
| Smart Irrigation | Not published at national level; check USDA’s annual Technology Use Survey or your irrigation district | USDA (survey pending) | Soil moisture sensors, automated valves |
| Crop Monitoring & Disease Detection | Input-savings % not separately published; falls under precision ag aggregate above | AEM/USDA (aggregate only) | Drone imagery, satellite NDVI mapping |
The table intentionally leaves two rows without a specific percentage: no dataset in the USDA ERS or AEM/USDA research cited here isolates a water-savings or input-savings figure for irrigation or crop-monitoring systems specifically, as opposed to precision agriculture as an aggregate. Rather than round off someone else’s number to fit, the honest answer for those two rows is where to look for one — the annual USDA Technology Use Survey (released each August) and your regional extension office, which track savings for your specific crops and soils.
AI for Farmers: What’s Real and What’s Still Unpublished
AI for farmers today mostly means the analytics layer sitting on top of the sensors and imagery already discussed — pattern detection across satellite time series, predictive alerts for pest and disease risk, and yield forecasting from historical and current-season data. What isn’t yet available is a published, farm-level adoption percentage specifically for AI-driven crop recommendation systems: USDA’s AI strategy work is underway, but adoption figures broken out for AI recommendation tools specifically (as distinct from precision ag broadly) have not yet been published as of this writing. If you need that number for your own reporting, USDA ERS’s precision agriculture research page is the correct place to check for its next release, since AI-specific adoption tracking would logically appear as an extension of the same survey program cited throughout this article.
Similarly unpublished: ROI payback periods broken out by farm size, and adoption rates specifically for non-commodity specialty crops like vegetables and orchards. Both are listed as open gaps in current USDA precision agriculture reporting. Treat any online claim of a specific “X-month payback” or “Y% adoption in specialty crops” with skepticism unless it links to a primary source — those figures are not part of the current published USDA or AEM datasets.
Farmonaut: Making Precision Agriculture Accessible for All
The gap between large-scale (70% autosteering) and midsize (52%) adoption shown in the USDA data above is largely a cost-and-hardware story: field sensors, guidance electronics, and their installation are easier to amortize over more acres. Farmonaut’s approach is to remove the field-hardware requirement entirely, using satellite data instead:
- Satellite-Based Crop Health Monitoring: Multispectral data tracks vegetation health (NDVI), soil moisture, and weather risk across an operation without field sensors to install or maintain.
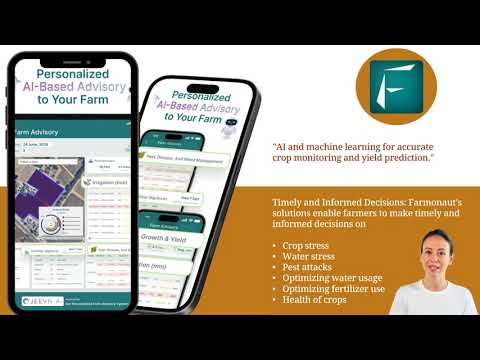
- AI-Powered Jeevn Farm Advisory: Real-time weather updates and predictive analytics for management decisions.
- Blockchain-Based Product Traceability: Verifiable digital records from seed to shelf.
- Fleet and Resource Management: Equipment and logistics tracking for cost control and safety.
- Carbon Footprinting: Real-time emissions data for sustainability reporting.
Farmonaut’s large-scale farm management platform brings these tools to plantations, estates, and agencies managing acreage well beyond a single operation.
Building your own tools on top of this data? Farmonaut API access and its developer documentation merge satellite and weather statistics into any platform.
How to Access Farmonaut: Web App, Mobile Apps, and API
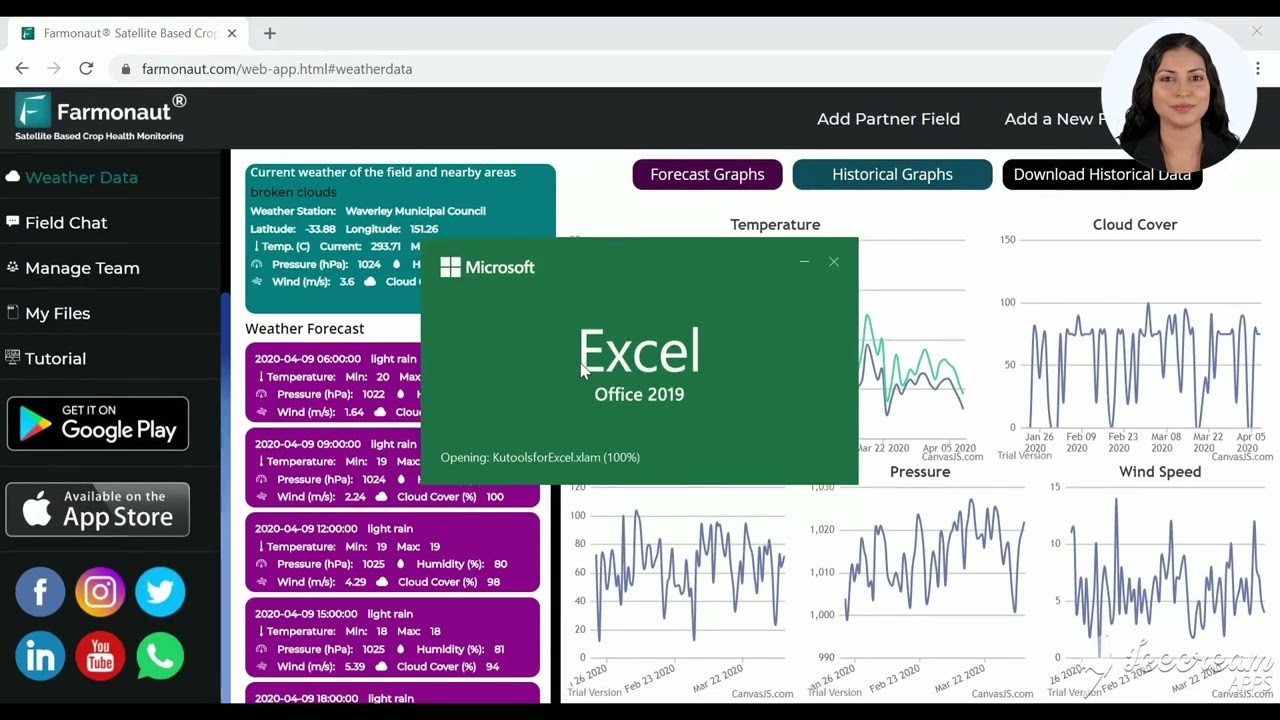
- Farmonaut Web App: Access satellite, weather, and advisory services from any browser—no installation required.
- Farmonaut Android App: Download on Google Play for field management, crop health tracking, and weather monitoring on the go.
- Farmonaut iOS App: Available on the App Store for iPhone & iPad—field management, alerts, and insights in your pocket.
- Farmonaut API: Integrate crop and field data into your own platforms (Developer Docs).
Also see Farmonaut’s crop loan & insurance verification tools, which use satellite data for financing and claims documentation.
Farmonaut Subscription Model: Choose Your Plan
Farmonaut operates on a flexible subscription model for individual growers, cooperatives, agribusinesses, and institutions. Select a plan based on area monitored, data frequency, and service needs, scaling with your operation.
Challenges and Considerations: Moving Towards Smarter Farming
Adopting IoT for smart farming has real obstacles, and the USDA adoption gap between large-scale and midsize farms (70% vs. 52% for autosteering) is direct evidence of the first one:
- Initial Technology Costs: Field hardware and installation carry real up-front expense; satellite-only platforms like Farmonaut lower this barrier by skipping field devices entirely. Weigh cost against the AEM/USDA $118/acre/year estimate using the calculator above.
- Data Security: Farm data and supply-chain records need the same digital safeguards as any connected business system.
- Technical Expertise: New systems carry a learning curve; platforms built around usability reduce the adoption barrier for operations without in-house IT staff.
- Infrastructure Reliability: Rural broadband and cellular coverage limit sensor-network reliability in some regions; USDA’s annual Technology Use Survey tracks farm connectivity rates and is the source to check for current coverage statistics.
- Integration: Aligning new systems with existing workflows takes planning; modular, scalable tools reduce the disruption.
Frequently Asked Questions (FAQ)
What are smart farming systems?
Smart farming systems connect sensors, guidance electronics, and software across a farm to collect and act on real-time data. USDA ERS found 70% of large-scale US crop farms using guidance autosteering and 68% using yield monitors and mapping as of its 2023 survey.
What does IoT for smart farming actually include?
It’s the connectivity layer: soil and weather sensors, satellite and drone imagery systems, and the networks that move that data to a phone or farm office in real time, feeding into the decision tools above them.
What are IoT smart services?
The subscriptions and platforms built on top of IoT hardware — hardware-plus-data-service bundles, satellite/software-only platforms like Farmonaut that need no field hardware, and API access for building custom tools.
How much value does precision agriculture actually add?
AEM and USDA jointly estimate $118 per acre per year in economic value from precision agriculture adoption, with a 5% productivity gain already realized nationally and up to 6 more percentage points possible with broader adoption.
Is there a published adoption rate for AI-based crop recommendation tools?
Not yet at the level of the autosteering and yield-mapping figures above. USDA’s AI strategy work is underway, but AI-specific adoption percentages have not been published separately from precision agriculture as a whole; check USDA ERS’s precision agriculture research page for future releases.
How does the agriculture industry use this data day to day?
Row-crop operations use autosteering and yield mapping most heavily, livestock operations add wearable herd sensors and fleet tracking, and specialty/greenhouse growers lean on automated climate and fertigation control — each covered in the seven-system breakdown above.
How can I start using Farmonaut’s precision agriculture services?
Sign up on the Farmonaut web or mobile app, select a subscription, and begin integrating satellite and AI-powered insights into your operation.


Conclusion: Where Smart Farming Adoption Goes Next
The measurable story here is adoption crossing from early-adopter territory into standard practice at scale: 70% of large US farms on autosteering, 68% on yield monitors and mapping, and a documented $118-per-acre annual value from AEM/USDA’s analysis. The gap still open is at midsize (52%) and in categories — irrigation-specific savings, AI recommendation adoption, specialty-crop uptake — that USDA has not yet published at the same resolution. The durable way to track this going forward is not this article’s numbers but the method: check USDA ERS’s precision agriculture publication page for the next survey cycle, and USDA’s Technology Use Survey each August for updated connectivity and adoption statistics, rather than relying on any single year’s snapshot.
Ready to add satellite-based smart farming to your operation? Start your Farmonaut journey today!

 Godrej Agrovet
 Hayleys Agriculture
 Linx Agritech
 Adinet
 Save Your Soils
 GalaxEye Space
 Grandstream Algérie
 XOS Realty
 Geospatial Lab Africa
 Agro La Gándara
 HIPSAC
 ZOL Zimbabwe
 Juligerm
 AdBio
AdBio MISE Maroc
 NWNS
NWNS Red August Group
 Farm Inc
 WeMe Global
 Agrotoken
 Blue BearX
 Insignito
 DnCubed
 Indosistim Teknologi
 Liquify Digital
 CU Foods
 BeyondTech Global
 Rouge VC
 AgroRisk
 Oath Inc
 Esri North East Africa
 MDCV UK
 Etech Consulting Madagascar
 Vestlandsforsking
 WB Dev
 Sama Premium
 Tres Valles
 Blickwinkel
 Agricultural Credit Policy Council
 eKGIS
eKGIS Mostas Tech
 Andex
Andex Deluxe Conseil
 WICO
WICO Chimera Innovation
 SkyHarvest
 Teledarbas
 Exurbia Geospatial
 FieldZero
