

Green farm technology · Evidence guide
Best Green Technologies for Farming: 10 With Real Data
The best green technologies for farming are those with measured results, such as guidance, sensor irrigation, cover crops, trees and solar. FAO puts agrifood at 32% of global emissions in 2023.
Key takeaways
- Agrifood systems emitted 16.5 billion tonnes of CO2 equivalent in 2023, 32% of the global total; farm-gate emissions were 8.1 billion tonnes (FAO, 2025).
- Auto-steer covered 58% of US corn acres in 2016, but yield maps, soil maps and variable-rate tools were on only 5-25% of acres for four other crops (USDA ERS).
- A 2015 model of Arizona lettuce found 20 litres of water per kg in hydroponics against 250 in the field, but 82 times more energy (Barbosa et al.).
- US farms with solar panels rose from 90,142 in 2017 to 116,758 in 2022 (USDA NASS Census of Agriculture).
- Cover crops covered 17,985,831 US acres in 2022, 4.7% of cropland (USDA ERS).
In this article
- Green technologies for farming at a glance
- How we checked the numbers
- Where farming emissions come from
- 1. Precision agriculture: apply inputs only where needed
- 2. Vertical farming: more crop per square metre, more energy
- 3. Hydroponics and aquaponics: much less water per kilogram
- 4. Agroforestry: trees on working farms
- 5. Smart irrigation: water by data, not by hand
- 6. On-farm renewable energy and agrivoltaics
- 7. Biological pest control: natural enemies in place of sprays
- 8. Soil health monitoring and cover crops
- 9. Silvopasture: trees, grass and livestock together
- 10. AI and satellite data: decisions from many signals
- Other green farm technologies
The best green technologies for farming are the ones with measured results: precision guidance, sensor-based irrigation, cover crops, trees on farms, on-farm solar and biological pest control. Global agrifood systems emitted 16.5 billion tonnes of CO2 equivalent in 2023, or 32% of all human-caused emissions, according to the FAO emissions brief. This guide goes through ten technologies and shows what US government, university and UN sources say about most of them.
It also shows how many US farms use them, adds four charts, and gives a payback calculator you can fill in with your own costs.
Green technologies for farming at a glance
The table shows one fact for each technology and who measured it. Every number is explained in its own section below.
| Technology | What the sources show | Source | Main limit |
|---|---|---|---|
| 1. Precision agriculture | Auto-steer used on 58% of US corn acres in 2016 | USDA ERS | Low use on small farms |
| 2. Vertical farming | A modelled hydroponic greenhouse used 82 times more energy per kg of lettuce | Barbosa et al. | High energy use |
| 3. Hydroponics | Modelled lettuce: 20 vs 250 litres of water per kg | Barbosa et al. | Modelled, one region |
| 4. Agroforestry | 32,717 US farms reported it in 2022 | USDA Forest Service | Slow payback |
| 5. Smart irrigation | Soil moisture probes in 7-12% of fields (USDA NASS 2019) | Univ. of Nebraska | Cost and effort |
| 6. On-farm renewable energy | 153,101 US farms had a system in 2022 | USDA NASS | Site and grid access |
| 7. Biological pest control | About 2 million ha of Brazilian sugarcane treated with wasps in 2018 | Brazilian review | Needs pest timing |
| 8. Soil and cover-crop monitoring | 18.0 million US acres of cover crops in 2022 | USDA ERS | Only 4.7% of cropland |
| 9. Silvopasture | Shade and shelter for livestock | UW-Madison Extension | Shade slows forage |
| 10. AI and satellite data | Imagery tracked in USDA adoption surveys | USDA ERS | Needs good local advice |
How we checked the numbers
We used only pages we opened: USDA Economic Research Service (ERS), USDA National Agricultural Statistics Service (NASS), the USDA Forest Service, the National Laboratory of the Rockies (formerly NREL), the FAO, university extension and peer-reviewed papers. Each figure carries its year and what it measures.
Some results are survey counts, some are field trials and some are models. We say which. Instead, the order follows how a farm usually adds them: data first, then water, energy, plants and animals.
Costs vary by farm, crop and country. That is why the calculator below asks for your own prices. Any pest, fertilizer or legal topic below is general information. Follow the product label, check local rules and get professional advice for your farm.
Where farming emissions come from
A green technology is worth adding where the emissions or waste are. The FAO splits the 16.5 billion tonnes of agrifood emissions into three parts: farm-gate emissions from crops and livestock, land-use change, and everything before and after the farm, such as processing, transport, packaging and retail.
Chart
Farm-gate emissions are the largest part of agrifood emissions
Billion tonnes CO2 equivalent, global agrifood systems, 2023
Farm-gate emissions were 8.1 billion tonnes in 2023, or 49% of the agrifood total. Pre- and post-production emissions were 5.2 billion tonnes. Land-use change was 3.2 billion tonnes. Livestock, at 4.3 billion tonnes, was the largest single source, the same FAO brief shows. The share of agrifood in all emissions fell from 38% in 2001 to 32% in 2023.
1. Precision agriculture: apply inputs only where needed
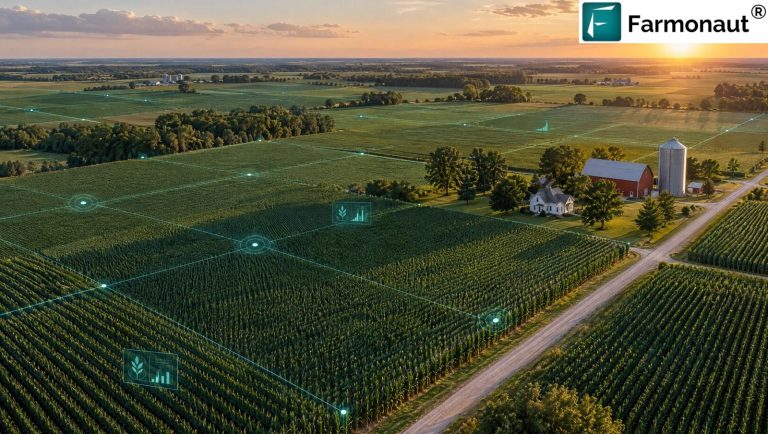
Precision agriculture uses GPS, yield monitors, soil maps and variable-rate machines to put seed, fertilizer and chemicals where a field needs them. In the US it is common on large row-crop farms. Auto-steer guidance went from 5.3% of planted corn acres in 2001 to 58% in 2016, according to USDA ERS report EIB-248. The same report gives 72.9% for sorghum and 64.5% for cotton in 2019.
Other tools are less common. Yield maps, soil maps and variable-rate technology were used on only 5-25% of planted acres of winter wheat, cotton, sorghum and rice, and fewer than a quarter of the smallest farms (except for cotton) used any of four tools, the ERS report says. Farm size matters. For all farms, the 2022 Census of Agriculture counted 226,092 farms that used precision agriculture practices, about 12% of the 1,900,487 US farms, from the USDA NASS Census of Agriculture.
Best for: row-crop farms that already own GPS-ready machines. Watch out for: the data only helps if someone acts on it.
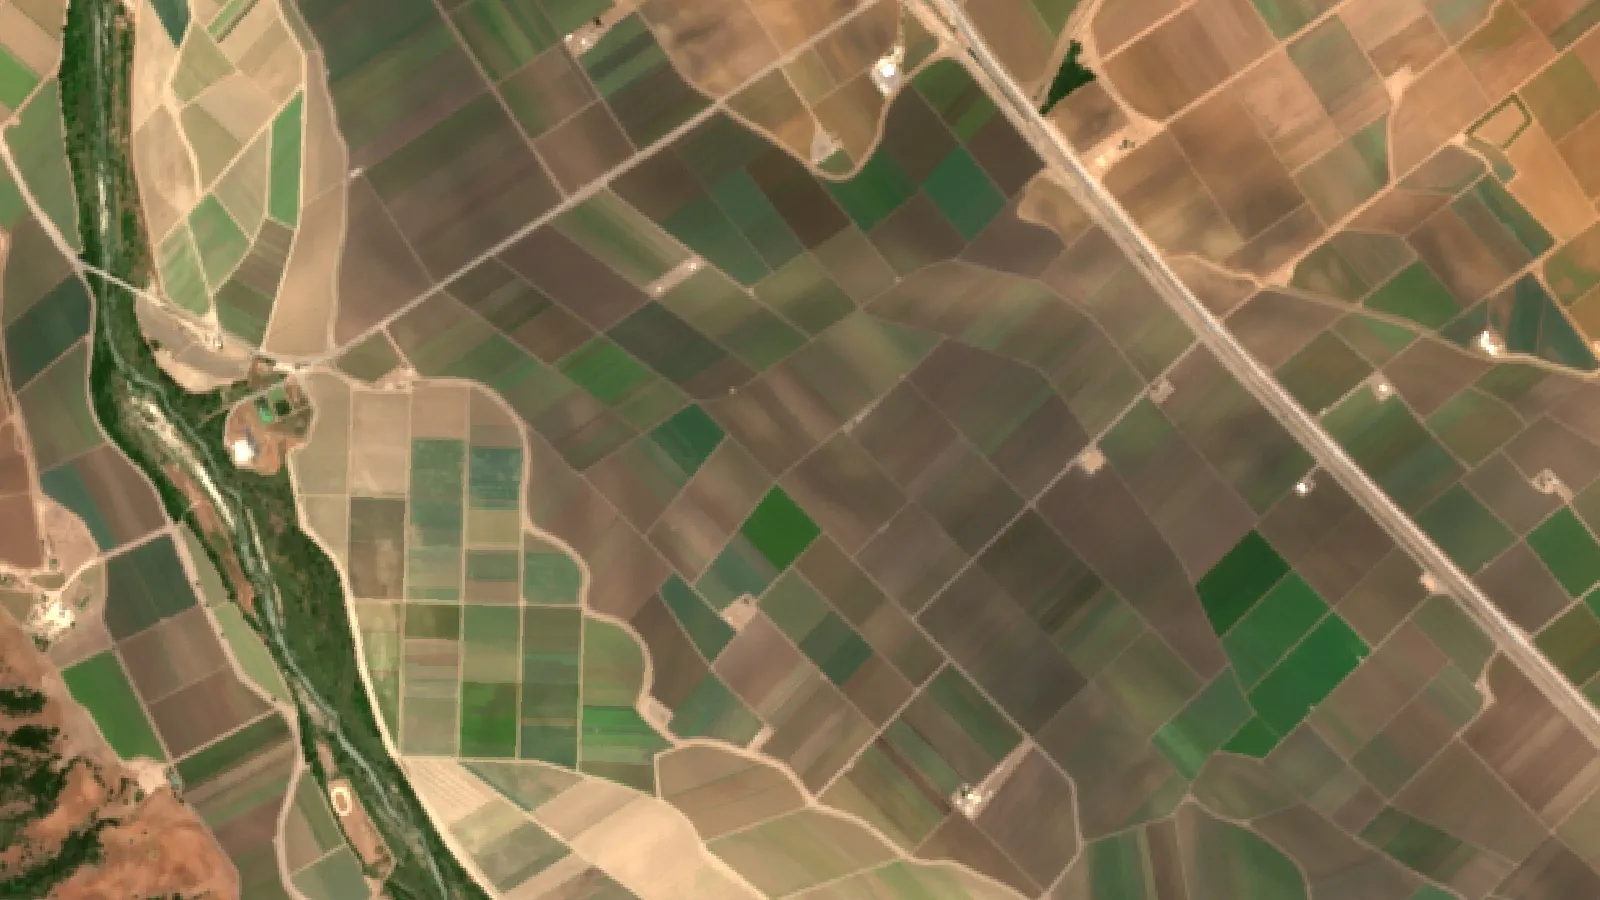
Satellite and drone imagery can show which parts of a field differ. Farmonaut offers a large-scale farm management platform and a web and mobile app for field monitoring from satellite data. Satellites show how plants look, not the cause, so check problem spots on the ground.

▶ Six plain steps to start precision agriculture without buying a robot. · 4:18
2. Vertical farming: more crop per square metre, more energy
Vertical farms stack growing trays indoors under LED light. They use little land and are shielded from weather. The trade-off is energy. The nearest data is the Arizona hydroponic greenhouse model in the next section, which is a single-layer greenhouse, not a stacked farm. It needed 82 times more energy per kilogram than field lettuce, and heating and cooling made up most of it.
That makes the power source the key question. The same paper worked out that solar panels covering about three times the greenhouse floor area could offset the energy demand of its system, under its assumptions. For the wider case for stacked farming, read our guide to the benefits of vertical farming.
Indoor growing is also tested in dry regions; see our note on desert agriculture. Best for: leafy greens near cities, or places with little farmland or water. Watch out for: the electricity bill and the choice of crop.
3. Hydroponics and aquaponics: much less water per kilogram
Hydroponics grows plants in nutrient water instead of soil. A 2015 paper in the International Journal of Environmental Research and Public Health compared lettuce in Yuma, Arizona, using crop budgets and engineering equations. It is a model, not a farm trial. It found hydroponic lettuce needed 20 litres of water per kilogram a year, against 250 litres for field lettuce. Yield per square metre was 41 kg against 3.9 kg.
Chart
Modelled water use per kilogram of lettuce, Yuma, Arizona
Litres per kg per year, model based on crop budgets and engineering equations
The energy figure is the catch: 90,000 kJ per kilogram for hydroponics against 1,100 kJ for field lettuce (about 25 kWh against 0.3 kWh). Results for other crops, climates and newer greenhouses will differ.
In aquaponics, fish waste feeds the plants and the plants clean the water for the fish.
4. Agroforestry: trees on working farms
Agroforestry puts trees or shrubs in crop or pasture systems. The USDA Forest Service analysed the Census of Agriculture and found that 32,717 US farms reported agroforestry in 2022, up 6% from 30,853 in 2017. Use is uneven. Vermont had the highest share of farms at 7.8%, then Maine at 6.0% and New Hampshire at 5.6%. Arizona, Utah and North Dakota were lowest, between 0.3% and 0.4%.
Chart
Share of farms reporting agroforestry, selected states
Percent of farms, 2022 Census of Agriculture, three highest and three lowest states
The chart repeats the highest and lowest states in that analysis. It does not show every state.
Best for: farms that can wait years for a return, or that want shelter belts, nuts, fruit or timber. Watch out for: tree choice and spacing, which depend on your climate and machines.
5. Smart irrigation: water by data, not by hand
Smart irrigation links soil, canopy or weather data to the schedule. Many farmers still judge by eye or feel. A University of Nebraska-Lincoln CropWatch article says soil moisture probes are used in only 7-12% of fields, citing USDA NASS 2019, while hand-feel methods remain popular. The article says uncertainty leads some growers to add extra water for insurance. Cost and ease of use are the main barriers it names.
In the Nebraska trial, sensors mounted on a centre pivot matched stationary sensors well. The study ran on a 140-acre research field with corn and soybean, so treat it as a test of the method, not a promise of savings on your land.
Best for: irrigated fields where water is costly or limited. Watch out for: sensors that are not placed or checked well.
6. On-farm renewable energy and agrivoltaics
Solar, wind and small hydro cut the fossil power a farm buys. The 2022 Census of Agriculture counted 153,101 US farms with renewable energy producing systems, up from 133,176 in 2017. Solar panels were on 116,758 farms in 2022, up from 90,142.
Chart
US farms with renewable energy systems, by type
Thousands of farms, 2017 and 2022
Agrivoltaics puts crops or grazing under or between solar panels. The National Laboratory of the Rockies says shade changes the microclimate and soil moisture. In arid climates yields may be higher with less watering, while in very wet places panel spacing and drainage matter more. So results depend on site. A related NREL feature from 2024 describes farmers and researchers working on solar sites that also host crops and grazing.
Best for: farms with high power bills, sunny sites and enough space. Watch out for: lease terms, grid connection rules and local permits. Get legal and financial advice before signing. Our guide to USDA beginning farmer loans covers funding routes for new farmers.
7. Biological pest control: natural enemies in place of sprays
Biological control uses natural enemies of pests, such as parasitic wasps, predators and microbes. California’s agriculture department runs a biological control programme that brings in and tests natural enemies of invasive weeds and insects.
One large case is in Brazil. A review of biological control in Brazil says about 2 million hectares of sugarcane were treated with Trichogramma galloi in the 2018 season to control the sugarcane borer. The figure comes from an industry association, as personal communication in that paper.
Best for: integrated pest management, organic systems and high-value crops. Watch out for: release timing, and the effect of other sprays on the natural enemies. Follow the product label and local rules for any release or spray.
8. Soil health monitoring and cover crops
Soil monitoring covers lab tests, field sensors and satellite maps of plant cover. Cover crops are a practice you can count. USDA ERS reports that US cover-crop area rose 17% between 2017 and 2022, from 15,390,674 to 17,985,831 acres. That was 4.7% of US cropland. The Census of Agriculture counts 153,328 farms with cover crops in 2022. Texas added the most acres, from 1,014,145 to 1,550,789.
Monitoring tells you whether a practice is working on your fields. Sampling and satellite maps are tools for that check, not a replacement for soil tests. Satellite plant-cover maps also help see how a cover crop grew over the season. For more on how soil holds together, read our guide to soil structure and soil health.
Best for: croplands with erosion, compaction or nutrient loss. Watch out for: seed and termination cost, and timing in your rotation.
▶ Regenerative agriculture, carbon farming and soil health explained. · 10:25
9. Silvopasture: trees, grass and livestock together
Silvopasture manages trees, forage and livestock on the same site. A University of Wisconsin-Madison Extension guide calls shade and shelter for livestock one of the most important benefits. In extreme heat, shade can protect production and even life, and trees can block winter wind. Grazed woodland can bring income between timber harvests.
The guide also lists concerns. Forage production is lower than in open pasture, and animals can damage trees, so it takes intensive management.
Best for: cattle, sheep or goat farms with wooded land or room to plant trees. Watch out for: tree protection and grazing times.
10. AI and satellite data: decisions from many signals
AI tools combine satellite images, weather, soil and field records to flag problems or suggest actions. USDA ERS tracks drones, aircraft and satellites as one group in its adoption survey.
What matters for you is simple. Check that the tool uses local data, that you can see why it gave a result, and that a person confirms the advice before you spray, irrigate or sell. Developers can use the satellite API and its developer docs to build such tools. Our overview of farm technologies and robots covers machines, and the list of agriculture technology companies in the USA shows the vendors.
Best for: large or many-field operations. Watch out for: advice that is not tied to your fields.
Other green farm technologies
Four more ideas are common in guides like this one. We kept claims short because national data is thin.
Blockchain traceability records steps from farm to shelf. It helps only if the data entered is correct. See our page on product traceability. Carbon farming covers cover crops, reduced tillage, managed grazing and trees. Carbon credit rules and prices change, so check current programme terms. A carbon footprint tracker can help you record emissions. Nano sensors are mostly at research stage. Regenerative practices, such as no-till, cover crops and varied rotations, are the base on which many of the tools above work.
Fleet and machinery use also matter. A fleet management tool can cut idle time and trips. Mapping land types helps plan where each tool fits, as in our note on rural agriculture and land classes. If you need finance records, see crop loan and insurance verification.
Which green technology should you start with?
Start where your biggest cost or loss is. Our page on sustainable farming practices covers low-tech options too. If fuel and overlap are the issue, begin with guidance. If water is, begin with soil moisture checks. If soil is eroding, begin with cover crops. If power bills are high, look at solar. Add one change at a time and measure it on one field first.
The video below goes through seven green technologies in plain language.
Run a one-field trial first
- Pick one field or block with a known history and a similar field next to it.
- Write down your cost per acre for seed, fertilizer, water, fuel and labour before you change anything.
- Add the tool to one field only, and keep the other as it was.
- Record yields, input use and hours of work for the full season.
- Compare the two fields, including the cost of the tool, and only then decide about the rest of the farm.
Questions to ask a supplier
- Which crops, soils and climates was it tested in, and who ran the test?
- What does it cost per acre per year, including software, sensors and training?
- Does it work with the machines and records we already have?
- Who owns the data, and can I export it?
- What happens if the weather, the crop price or the rules change?
A low adoption rate is not a sign that a tool fails. The ERS report links uptake to farm size, field shape, soil variation and the cost of changing equipment. A technology that suits a 2,000-acre corn farm may not suit a 40-acre vegetable farm, and the reverse is also true. Match the tool to your farm, not to a headline.
▶ A plain-language video on seven green farming technologies. · 2:24
Does a green technology pay for itself?
Use the calculator to test any tool that saves inputs, such as seed, fertilizer, water or fuel. The figures are examples only. Replace them with your own quotes and records.
Try the numbers for your own farm below.
Calculator
What must a green tool save to pay for itself?
Enter your own area, input spend, expected saving and tool cost.
- Saving per acre: 7.50 US$
- Break-even saving: 4.0 %
- Total tool cost per year: $3,000
Example values only, not benchmarks or forecasts. Input spend is the yearly cost per acre of the input the tool targets (seed, fertilizer, water or fuel). Use your own quotes in US$.
FAQ
What are the best green technologies for farming?
There is no single best. The ones with solid data are precision guidance, sensor-based irrigation, cover crops, agroforestry, on-farm solar and biological pest control. Pick by your largest cost or loss.
How much water does hydroponics save?
A 2015 model of Arizona lettuce found 20 litres per kilogram for hydroponics against 250 for field lettuce. It also needed far more energy. Other crops and places will differ.
How many US farms use precision agriculture?
The 2022 Census of Agriculture counted 226,092 of 1,900,487 farms, about 12%. Use is higher on large row-crop farms.
Can crops grow under solar panels?
Yes, at some sites. The National Laboratory of the Rockies says results depend on climate and panel spacing. Check local permits and lease terms before you build.
What does it cost to add green technology?
Costs depend on farm size, crop and supplier. Use the calculator with your own quotes.
Related pages on our site
More on this topic: smart farm innovations, green tech innovations, technology in sustainable agriculture.
Conclusion
Green farm technology works where it targets a real cost or loss. The US numbers show wide use of guidance and solar, slow uptake of soil moisture probes, and a small share of cropland in cover crops. Start with one tool, measure it, and use the calculator before you buy.
Farmonaut Satellite + AI Farm Monitoring System
Build on satellite crop data
Developers and agtech teams can add field monitoring from satellite data to their own tools through the Farmonaut API.




Keep reading
Sources
- FAO, FAOSTAT Analytical Brief 115: Greenhouse gas emissions from agrifood systems 2001-2023: openknowledge.fao.org
- USDA ERS, Precision Agriculture in the Digital Era, EIB-248: ers.usda.gov
- USDA NASS, 2022 Census of Agriculture, Volume 1 US data: nass.usda.gov
- Barbosa et al., Lettuce land, water and energy comparison, IJERPH (2015): pmc.ncbi.nlm.nih.gov
- USDA Forest Service, Agroforestry across the United States: 2022 Census of Agriculture: research.fs.usda.gov
- University of Nebraska-Lincoln CropWatch, Sensors on the pivot (2022): cropwatch.unl.edu
- National Laboratory of the Rockies, Agrivoltaics: nlr.gov
- NREL feature, Lighting the way for agrivoltaics (2024): nlr.gov
- California Department of Food and Agriculture, Biological Control Program: cdfa.ca.gov
- Applied Biological Control in Brazil, PMC review: pmc.ncbi.nlm.nih.gov
- USDA ERS, Charts of Note: cover crop use, 2022 Census of Agriculture: ers.usda.gov
- UW-Madison Extension, Introduction to Silvopasture: cropsandsoils.extension.wisc.edu
Discussion
Questions, corrections or field experience? Share them below. First-time comments are reviewed before they appear, and your email is never published.
No comments yet. Be the first to add a question or your experience.

 Green Bite Farm
 FCF India
 Unifrutti Gulf
 Deluxe Conseil
 TVS Electronics
 BW Pipelines
 WICO
 Gen Chayat
 Chimera Innovation
 SkyHarvest
 Polaris Digitech
 Teledarbas
 Wild Oak Farm
 SFX
 Doodlakine

 Licence holder · Niger · Gold










