Mastering NDWI: A Comprehensive Guide to Landsat 5 and Landsat 8 Water Index Analysis

In the ever-evolving landscape of remote sensing and environmental monitoring, the Normalized Difference Water Index (NDWI) has emerged as a powerful tool for assessing water bodies and moisture content. At Farmonaut, we recognize the importance of this index in agricultural applications and environmental studies. In this comprehensive guide, we’ll delve deep into the world of NDWI, focusing specifically on its implementation using Landsat 5 and Landsat 8 satellite imagery.
1. Introduction to NDWI
The Normalized Difference Water Index (NDWI) is a satellite-derived index used to delineate open water features and enhance their presence in remotely-sensed digital imagery. Developed by McFeeters in 1996, NDWI has become an essential tool for monitoring changes in water content of leaves, water bodies, and moisture in soil.
NDWI is calculated using near-infrared (NIR) and short-wave infrared (SWIR) bands from satellite imagery. The formula is:
NDWI = (NIR – SWIR) / (NIR + SWIR)
This index ranges from -1 to +1, where higher values indicate higher water content or presence of water bodies.
2. Understanding Landsat 5 and Landsat 8
Before we dive into the specifics of NDWI calculation, let’s understand the key differences between Landsat 5 and Landsat 8 satellites.
Landsat 5
- Launched in 1984 and decommissioned in 2013
- Carried the Thematic Mapper (TM) sensor
- Provided 7 spectral bands
- 30-meter resolution for most bands
Landsat 8
- Launched in 2013 and currently operational
- Carries the Operational Land Imager (OLI) and Thermal Infrared Sensor (TIRS)
- Provides 11 spectral bands
- 30-meter resolution for most bands, with improved radiometric resolution
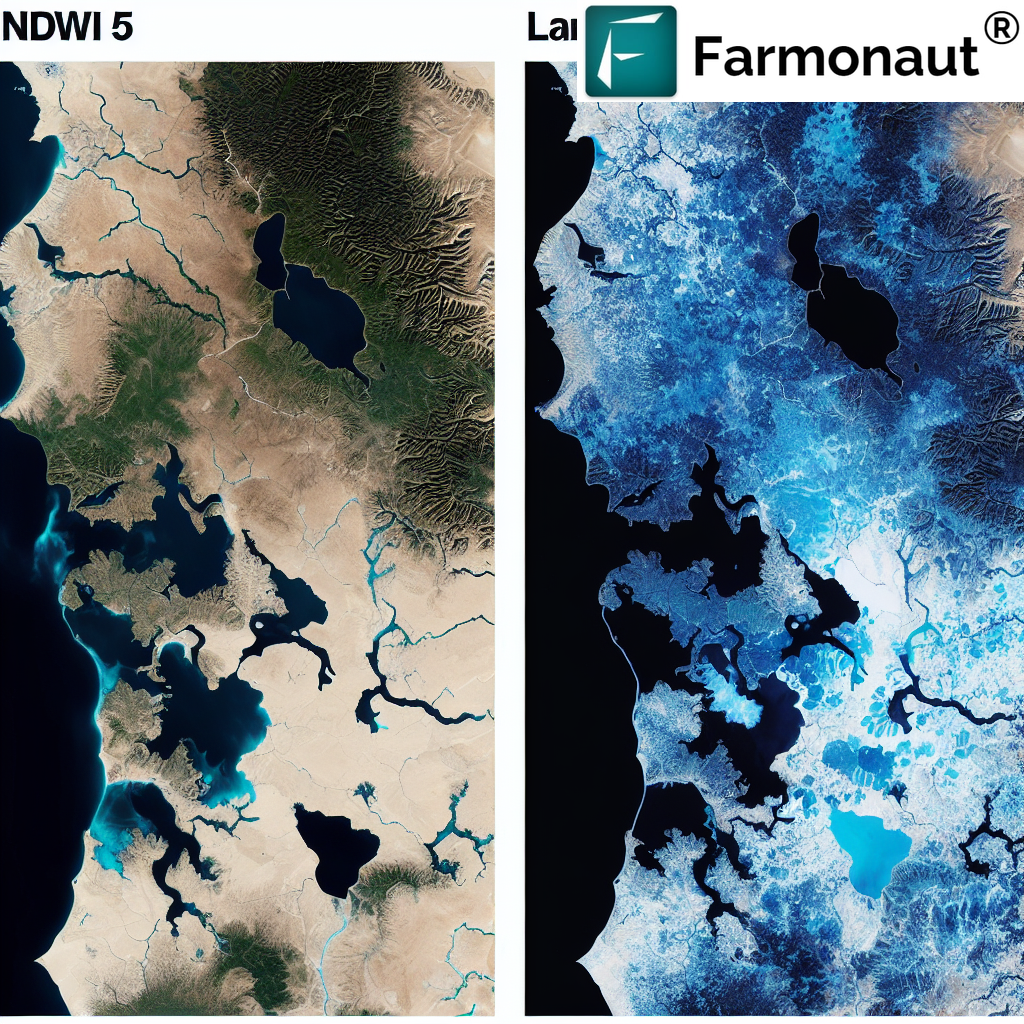
3. NDWI Calculation: Landsat 5 vs. Landsat 8
The calculation of NDWI differs slightly between Landsat 5 and Landsat 8 due to their different band designations.
NDWI Landsat 5
For Landsat 5, we use the following bands:
The formula for
NDWI Landsat 5 is:
NDWI = (Band 4 – Band 5) / (Band 4 + Band 5)
NDWI Landsat 8
For Landsat 8, we use the following bands:
The formula for
NDWI Landsat 8 is:
NDWI = (Band 5 – Band 6) / (Band 5 + Band 6)
4. Applications of NDWI in Agriculture and Environmental Studies
NDWI has a wide range of applications in agriculture and environmental monitoring. At Farmonaut, we leverage this index to provide valuable insights to farmers and environmental researchers. Some key applications include:
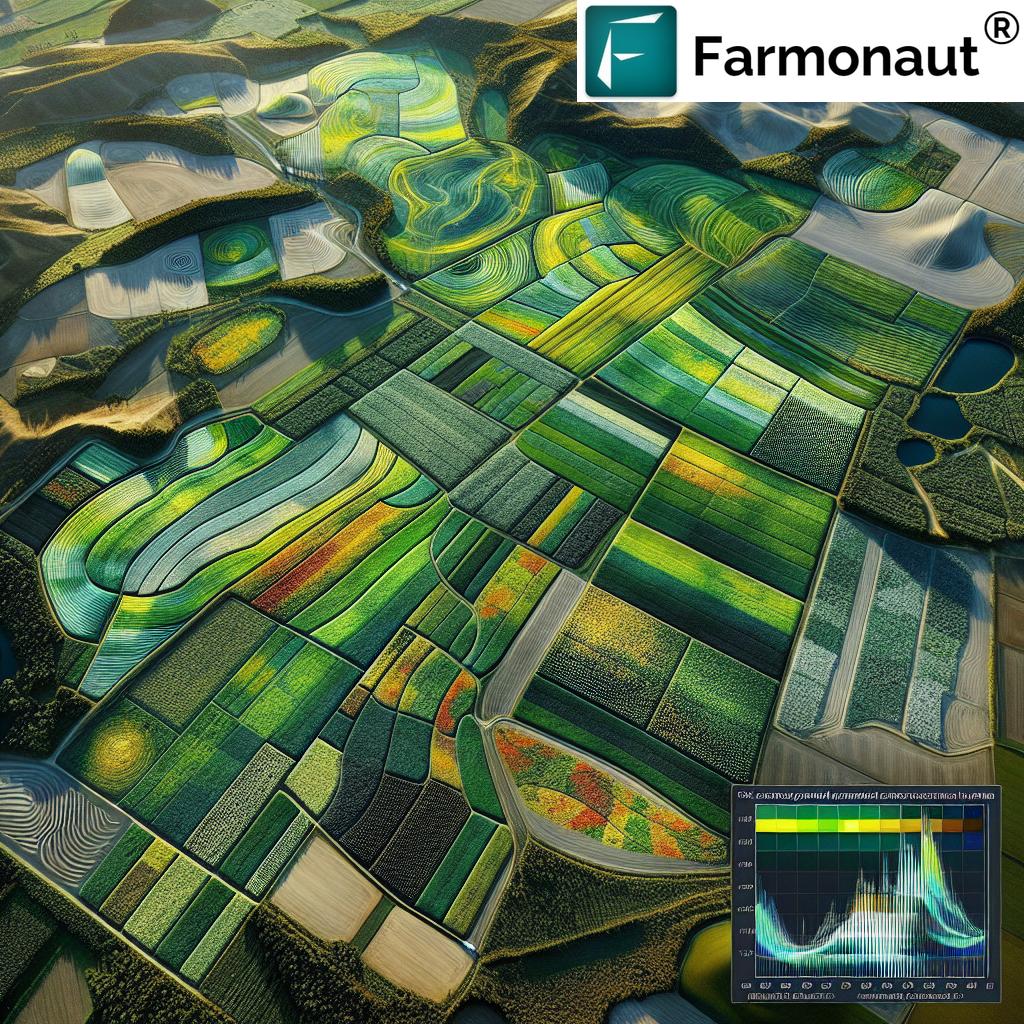
- Crop Health Monitoring: NDWI helps in assessing plant water content, which is crucial for understanding crop health and stress levels.
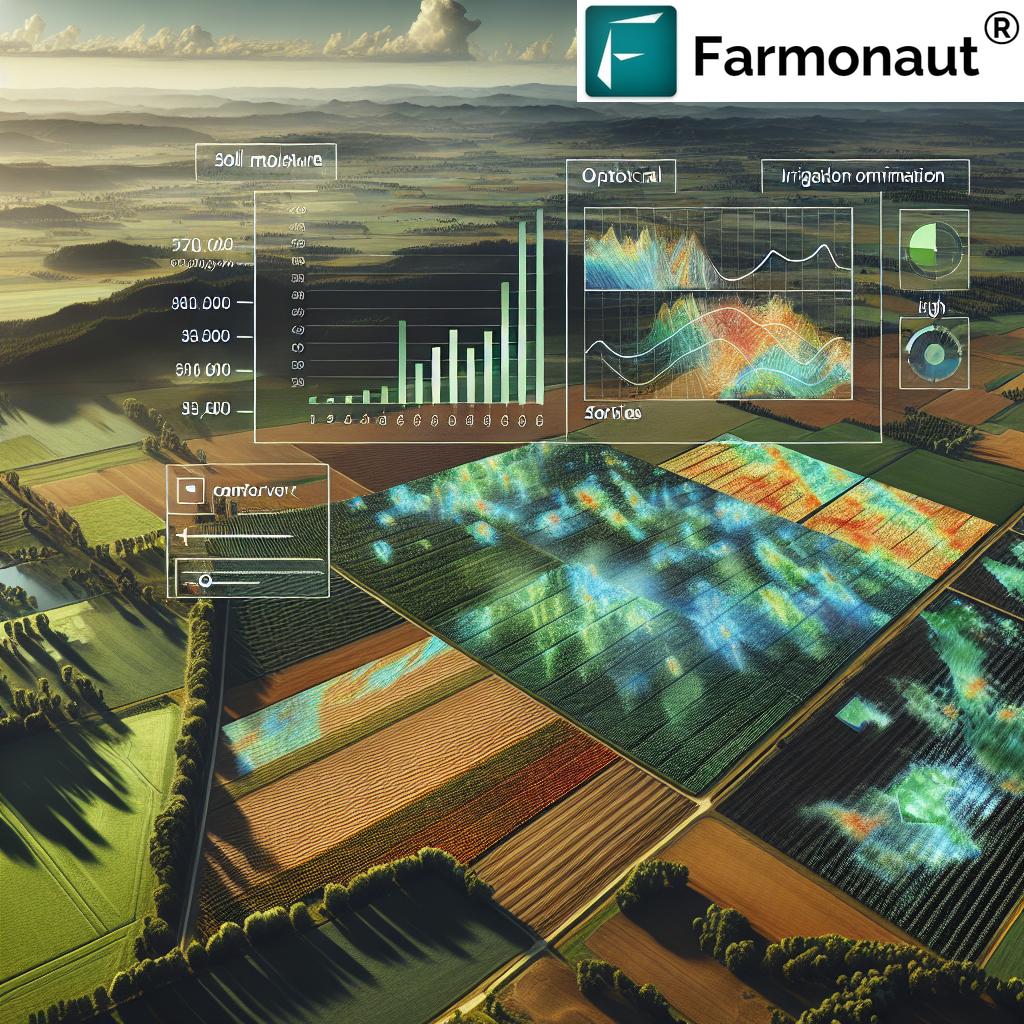
- Irrigation Management: By analyzing NDWI values, farmers can optimize their irrigation practices, ensuring efficient water use.
- Drought Detection: Changes in NDWI over time can indicate the onset and severity of drought conditions.
- Flood Mapping: NDWI is effective in delineating flood-affected areas, aiding in disaster management.
- Wetland Monitoring: The index is useful for tracking changes in wetland areas and their water content.
- Water Resource Management: NDWI assists in monitoring water bodies, helping in the management of water resources.
5. Farmonaut’s Approach to NDWI Analysis
At Farmonaut, we’ve integrated NDWI analysis into our comprehensive suite of satellite-based farm management solutions. Our approach includes:
- Advanced Algorithms: We use state-of-the-art algorithms to process Landsat 5 and Landsat 8 imagery for accurate NDWI calculation.
- Time Series Analysis: By analyzing NDWI values over time, we provide insights into long-term trends in water content and availability.
- Integration with Other Indices: We combine NDWI with other vegetation indices like NDVI to provide a comprehensive view of crop and environmental health.
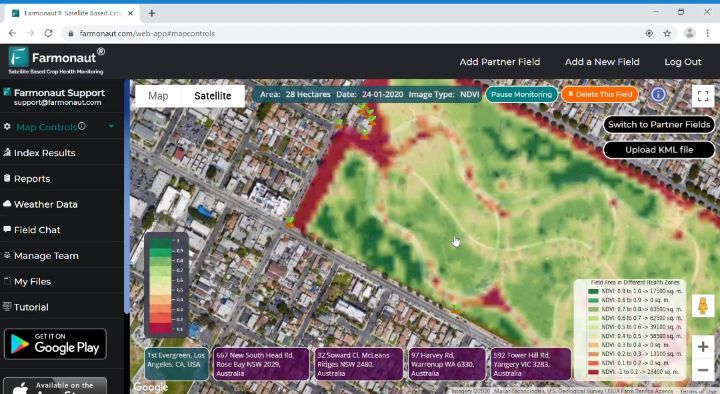
- User-Friendly Visualization: Our platform presents NDWI data in easy-to-understand formats, enabling farmers and researchers to make informed decisions.
- AI-Powered Insights: Our Jeevn AI Advisory System incorporates NDWI data to provide personalized recommendations for water management and crop health.
To experience these features firsthand, visit our
Farmonaut App.
6. Step-by-Step Guide to Calculating NDWI
For those interested in calculating NDWI using Landsat imagery, here’s a step-by-step guide:
- Data Acquisition: Download Landsat 5 or Landsat 8 imagery from reliable sources like USGS Earth Explorer.
- Preprocessing: Perform atmospheric correction and radiometric calibration on the raw imagery.
- Band Selection: Identify the NIR and SWIR bands based on the Landsat sensor (5 or 8).
- NDWI Calculation: Apply the appropriate NDWI formula based on the Landsat version.
- Scaling: Scale the NDWI values to a range of -1 to +1.
- Visualization: Create a color-coded map to represent NDWI values.
- Interpretation: Analyze the results, considering that higher values indicate higher water content or presence of water bodies.
For developers interested in integrating NDWI calculations into their applications, check out our
Farmonaut API.
7. Interpreting NDWI Results
Interpreting NDWI results requires understanding the range of values and what they represent:
- NDWI > 0.3: Typically indicates open water bodies
- 0.0 < NDWI < 0.3: May represent mixed pixels of water and vegetation or soil with high moisture content
- NDWI < 0.0: Generally represents non-water features like vegetation, soil, or built-up areas
It’s important to note that these thresholds can vary depending on the specific environment and study area. At Farmonaut, we’ve developed region-specific thresholds to enhance the accuracy of our water content assessments.
8. Challenges and Limitations
While NDWI is a powerful tool, it’s important to be aware of its limitations:
- Cloud Interference: Cloud cover can significantly affect NDWI calculations, necessitating cloud masking techniques.
- Mixed Pixels: In areas with complex land cover, mixed pixels can lead to ambiguous NDWI values.
- Temporal Resolution: The 16-day revisit time of Landsat satellites may limit the ability to capture rapid changes in water content.
- Shallow Water Detection: NDWI may have limitations in detecting very shallow water bodies or wetlands with dense vegetation cover.
At Farmonaut, we address these challenges through advanced image processing techniques and by integrating data from multiple satellite sources to provide more frequent and accurate updates.
9. Future Perspectives
The future of NDWI analysis looks promising, with several exciting developments on the horizon:
- Integration with Machine Learning: Advanced ML algorithms can enhance NDWI interpretation and automate the detection of water-related changes.
- Fusion with Other Data Sources: Combining NDWI with data from radar satellites, drones, and IoT sensors can provide more comprehensive water monitoring capabilities.
- Near Real-Time Monitoring: Improvements in satellite technology and data processing may enable near real-time NDWI monitoring, crucial for rapid response to water-related events.
- Enhanced Resolution: Future satellite missions may offer higher spatial and temporal resolution, improving the precision of NDWI analysis.
At Farmonaut, we’re continuously innovating to stay at the forefront of these developments. Our research team is exploring advanced NDWI applications to provide even more valuable insights to our users.
Farmonaut Satellite System vs. Drone and IoT-based Farm Monitoring
| Feature |
Farmonaut Satellite System |
Drone-based Monitoring |
IoT-based Monitoring |
| Coverage Area |
Large scale (Global) |
Limited (Local) |
Very Limited (Point-based) |
| Frequency of Data Collection |
Regular (Every few days) |
On-demand |
Continuous |
| Initial Setup Cost |
Low |
High |
Medium to High |
| Operational Complexity |
Low |
High |
Medium |
| Weather Dependency |
Moderate |
High |
Low |
| Data Processing |
Automated and Scalable |
Manual or Semi-automated |
Automated |
| Regulatory Compliance |
Straightforward |
Complex (Aviation rules) |
Moderate |
| Scalability |
Highly Scalable |
Limited Scalability |
Moderate Scalability |
As evident from the comparison, Farmonaut’s satellite-based system offers unparalleled advantages in terms of coverage, cost-effectiveness, and scalability. While drones and IoT devices have their specific use cases, our satellite technology provides a comprehensive solution for large-scale agricultural monitoring.
10. FAQ Section
Q1: What is the main difference between NDWI Landsat 5 and NDWI Landsat 8?
A1: The main difference lies in the band selection. For Landsat 5, NDWI uses Band 4 (NIR) and Band 5 (SWIR), while for Landsat 8, it uses Band 5 (NIR) and Band 6 (SWIR). This difference is due to the different sensor configurations on these satellites.
Q2: Can NDWI be used for all types of water bodies?
A2: NDWI is generally effective for most water bodies, but its accuracy can vary. It works best for clear, open water bodies. For turbid waters or water bodies with heavy vegetation cover, additional indices or modifications to NDWI might be necessary.
Q3: How often should I calculate NDWI for my agricultural land?
A3: The frequency depends on your specific needs and the variability of water conditions in your area. For most agricultural applications, calculating NDWI every 2-4 weeks during the growing season is sufficient. However, during critical growth stages or in drought-prone areas, more frequent calculations might be beneficial.
Q4: Can Farmonaut provide historical NDWI data for my farm?
A4: Yes, Farmonaut can provide historical NDWI data for your farm. Our platform archives satellite imagery and can generate NDWI time series analyses, allowing you to track changes in water content over extended periods. This historical perspective is crucial for understanding long-term trends and making informed decisions.
Q5: How does NDWI complement other vegetation indices like NDVI?
A5: NDWI complements NDVI (Normalized Difference Vegetation Index) by providing specific information about water content. While NDVI focuses on vegetation health and density, NDWI gives insights into water stress and moisture levels. Using both indices together provides a more comprehensive understanding of crop health and environmental conditions.
Q6: Is NDWI affected by atmospheric conditions?
A6: Yes, atmospheric conditions can affect NDWI calculations. Factors like cloud cover, haze, and atmospheric moisture can influence the satellite measurements. At Farmonaut, we apply advanced atmospheric correction techniques to minimize these effects and provide more accurate NDWI values.
Q7: Can NDWI help in detecting irrigation issues?
A7: Absolutely. NDWI is an excellent tool for detecting irrigation issues. By monitoring NDWI values across your field, you can identify areas that are under-watered or over-watered. This information is crucial for optimizing irrigation practices and ensuring uniform crop growth.
Q8: How does Farmonaut integrate NDWI data into its farm management recommendations?
A8: Farmonaut integrates NDWI data into our AI-powered advisory system. We combine NDWI insights with other data points like weather forecasts, soil type, and crop stage to provide personalized recommendations for irrigation scheduling, water stress management, and overall farm water management strategies.
Q9: Can NDWI be used for drought monitoring?
A9: Yes, NDWI is an effective tool for drought monitoring. By tracking NDWI values over time, we can detect decreases in water content that may indicate the onset or progression of drought conditions. This information is valuable for early warning systems and drought management strategies.
Q10: How accurate is NDWI compared to ground-based moisture measurements?
A10: While NDWI provides valuable insights, it’s important to note that it’s a remote sensing index and may not always perfectly align with ground-based measurements. The accuracy can vary depending on factors like vegetation type, soil characteristics, and atmospheric conditions. At Farmonaut, we recommend using NDWI in conjunction with ground truthing for the most accurate results.
Conclusion
The Normalized Difference Water Index (NDWI) is a powerful tool in the realm of remote sensing and agricultural management. By leveraging the capabilities of Landsat 5 and Landsat 8 satellites, we can gain valuable insights into water content and distribution across large areas. At Farmonaut, we’re committed to harnessing the power of NDWI and other advanced remote sensing techniques to provide farmers, researchers, and environmental managers with the data they need to make informed decisions.
As we continue to innovate and expand our services, we invite you to explore the possibilities of satellite-based farm management. Whether you’re a small-scale farmer looking to optimize your irrigation practices or a large agribusiness seeking comprehensive water resource management solutions, Farmonaut has the tools and expertise to support your needs.
To learn more about how Farmonaut can help you leverage NDWI and other advanced agricultural technologies, visit our website or download our app:
For developers interested in integrating our satellite data and analytics into their own applications, check out our
API documentation.
Join us in revolutionizing agriculture through the power of satellite technology and data-driven insights. Together, we can build a more sustainable and productive future for farming.
Subscribe to Farmonaut
 In the ever-evolving landscape of remote sensing and environmental monitoring, the Normalized Difference Water Index (NDWI) has emerged as a powerful tool for assessing water bodies and moisture content. At Farmonaut, we recognize the importance of this index in agricultural applications and environmental studies. In this comprehensive guide, we’ll delve deep into the world of NDWI, focusing specifically on its implementation using Landsat 5 and Landsat 8 satellite imagery.


