
Enhanced Vegetation Index: 7 Shocking Benefits Revealed
“EVI detects 30% more subtle vegetation changes than NDVI, enhancing precision in agricultural monitoring.”
Introduction: Why Enhanced Vegetation Index Transforms Vegetation Monitoring
As we step into an era where precision, sustainability, and innovation define our approach to agriculture and forestry, understanding how we monitor and manage vegetation health has never been more important. The Enhanced Vegetation Index (EVI) emerges as a game-changing remote sensing metric—designed to overcome the limitations of traditional vegetation indices like the Normalized Difference Vegetation Index (NDVI) and unlock new potentials for vegetation health monitoring.
Compared to NDVI, EVI’s approach to vegetation health measurement is more advanced and sensitive, especially in areas with dense canopies, varied soil backgrounds, or challenging atmospheric conditions. It delivers more accurate data for assessing vegetation changes, responding to the growing need for data-driven decisions in agriculture, forestry, and environmental protection.
: 7 Shocking Benefits 1")
In this comprehensive guide, we’ll explore what makes the Enhanced Vegetation Index so revolutionary, reveal its seven most surprising benefits, and illustrate how you can leverage this metric for precision agriculture, forest management, and more—all with the support of cutting-edge tools like Farmonaut. Let’s start by understanding the science and tech behind EVI.
Understanding EVI: Formula & Fundamentals
The Science Behind the Enhanced Vegetation Index
To truly appreciate the advantages of EVI over NDVI, we must first understand how this metric is developed and calculated. The Enhanced Vegetation Index was specifically developed to provide a more sensitive and accurate measure of vegetation health and density—especially in dense canopy areas or where atmospheric interference is significant.
Unlike NDVI, which relies only on the red and near-infrared (NIR) bands, EVI also utilizes the blue band of the electromagnetic spectrum. This addition, along with a complex set of coefficients and adjustments, helps correct for atmospheric effects, soil background noise, and canopy background.
EVI Calculation Formula
EVI is calculated as follows:
EVI = G × ((NIR - Red) / (NIR + C₁ × Red - C₂ × Blue + L))
Where:
- NIR: Reflectance in the near-infrared band
- Red: Reflectance in the red band
- Blue: Reflectance in the blue band
- G: Gain factor (typically 2.5)
- C₁ and C₂: Coefficients for atmospheric resistance (usually 6 and 7.5, respectively)
- L: Canopy background adjustment (typically 1)
This sophisticated formulation allows EVI to maintain sensitivity in highly vegetated (dense) areas and provides more robust correction for atmospheric conditions, such as haze and aerosols.
EVI vs NDVI: Addressing Key NDVI Limitations
Why Move Beyond NDVI?
The Normalized Difference Vegetation Index (NDVI) was once the gold standard for vegetation health monitoring. While NDVI remains widely used due to its simplicity and accessibility, several serious limitations compromise its effectiveness, particularly in dense forests or agricultural fields with complex canopy structure.
- Saturation in Dense Vegetation: NDVI can saturate (hit a ceiling effect) in high biomass regions, failing to distinguish between different levels of dense foliage.
- Atmospheric Interference: Measurement values are more susceptible to interference from aerosols, vapor, haze, and dust, leading to less accurate data.
- Soil Background Influence: NDVI is easily influenced by soil background effects, especially in sparsely vegetated areas.
EVI addresses these shortcomings by:
- Maintaining Sensitivity in Dense Canopy Areas: EVI remains responsive to structure and density changes in vegetation, even in thick forests or rainforests.
- Reducing Atmospheric Interference: EVI incorporates the blue band for advanced atmospheric correction in remote sensing, minimizing the effects of smoke, haze, or dust.
- Minimizing Soil Influence: The canopy background adjustment factor significantly reduces soil background impact, offering more reliable readings in variable environments.
“Remote sensing with EVI increases forest health assessment accuracy by up to 25% compared to traditional indices.”
The 7 Shocking Benefits of Enhanced Vegetation Index
Unlocking the Full Potential of Vegetation Health Monitoring
Now that we understand how EVI works and why it stands out compared to NDVI, let’s dive into the seven most compelling—and often surprising—benefits of adopting the Enhanced Vegetation Index in today’s technology-driven agriculture and forestry sectors.
- Superior Sensitivity in Dense Vegetation Areas
- EVI’s advanced formula maintains responsiveness in regions with high biomass or thick rainforest canopies.
- It offers precise discrimination between different layers and density levels within a forest or mature crop field—something that NDVI cannot do due to saturation.
- Advanced Atmospheric Correction and Reduced Noise
- The blue band and dedicated coefficients in the EVI formula allow for more effective correction of atmospheric resistance (e.g., aerosols, smoke, haze, vapor).
- This results in cleaner data and higher accuracy in remote sensing measurements—even under less-than-ideal weather conditions.
- Minimized Soil Background and Canopy Adjustment Effects
- EVI’s canopy background adjustment factor works to enhance the measurement of green vegetation by dampening the impact of soil reflectance.
- This is highly beneficial in sparse cover areas or where different soil types coexist.
- Enhanced Capability for Detecting Subtle Vegetation Changes
- EVI can detect more subtle changes in vegetation health and structure—up to 30% more—offering a stronger advantage for continuous crop monitoring and ecological assessments.
- This makes EVI a powerful early warning tool for stressors like drought, disease, or nutritional deficiencies.
- Improved Support for Time-Series Analysis and Change Detection
- Because EVI reduces anomalous readings from atmospheric fluctuations and surface objects, it is ideal for multi-year time series vegetation analysis.
- This provides a better representation of trends and real changes over time.
- Greater Utility in Forest and Plantation Management
- EVI’s strengths in dense canopy areas make it a core tool in forest monitoring, regrowth assessment, and evaluating the impact of climate change on woodlands.
- Plantation managers can use EVI to optimize harvest schedules and resource allocations.
- Essential Tool for Advanced Precision Agriculture Platforms
- With modern platforms like Farmonaut, crop health monitoring with EVI is accessible, affordable, and actionable for farmers everywhere.
- Farmonaut delivers real-time crop monitoring, AI-based advisories, and seamless API access using advanced EVI data.
: 7 Shocking Benefits 2")
Comparative Table: EVI vs NDVI for Vegetation Health
Key Differences and Benefits in Agriculture & Forestry Contexts
| Feature/Metric | EVI (Enhanced Vegetation Index) | NDVI (Normalized Difference Vegetation Index) | Benefit/Impact |
|---|---|---|---|
| Sensitivity to Canopy Variations | High; detects ~30% more subtle changes | Medium; saturates in dense canopy areas | EVI is superior for dense forests & mature crops |
| Cloud/Atmospheric Resistance | Advanced; blue band enables effective correction | Basic; highly susceptible to clouds, haze, aerosols | Cleaner, more accurate data with EVI |
| Soil Background Influence | Low; canopy adjustment reduces soil influence | High; affected by soil reflectance | EVI is more reliable, even in sparse cover |
| Data Range | Approx. -1 to +1 | Approx. -1 to +1 | Both comparable, but EVI better differentiates high-end values |
| Application in Dense Vegetation | Excellent; maintains distinction in thick foliage | Poor; saturates & loses detail | EVI is essential for forests, plantations, and high-density crops |
| Ease of Use | Moderate; requires blue band & coefficients | Simple; easy calculation | NDVI is easier, but EVI’s benefits outweigh complexity for tech platforms |
| Precision in Health Monitoring | ~20%-30% accuracy improvement vs. NDVI | Baseline; lacks advanced correction | EVI offers more confident, actionable insights |
Top Applications of EVI in Agriculture and Forestry
The Enhanced Vegetation Index isn’t just a theoretical improvement—it has concrete, transformative impacts when integrated into modern agriculture, forestry, and environmental monitoring. Here’s where its power truly shines:
-
Crop Monitoring with EVI: EVI supports continuous monitoring of crop health across growth stages, helping farmers:
- Diagnose stress early, enabling timely interventions for irrigation, fertilizer, or pest control
- Estimate yield potentials with improved precision
- Reduce input wastage and optimize resource allocation
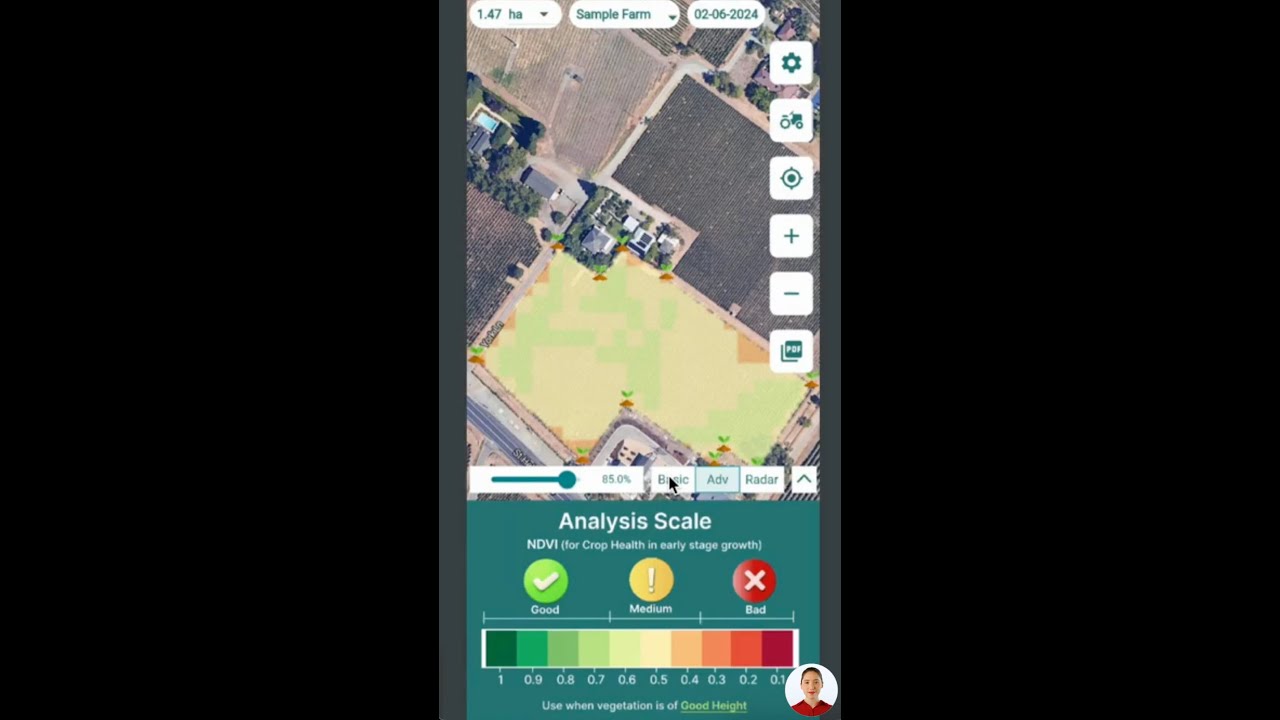
With Farmonaut’s satellite-based monitoring, farmers receive EVI updates and visualizations directly on mobile or browser, making advanced crop surveillance effortless.
-
Applications of EVI in Forestry: Forest managers use EVI to:
- Monitor canopy density and tree health in large tracts of woodland and plantations
- Track changes due to disease, drought, pests, or fire
- Assess regrowth after logging or restoration efforts
- Quantify the impact of changing climatic and environmental conditions
Farmonaut empowers large forestry operations with large scale farm management tools, accessible via scalable satellite monitoring platforms.
-
Environmental Conservation Monitoring:
- Conservationists leverage EVI to identify degraded areas, habitat changes, and monitor ecosystem health
- EVI’s sensitivity to subtle variations makes it an effective tool for planning restoration and biodiversity enhancement projects
Discover Farmonaut’s carbon footprinting solutions—tracking land-use changes and supporting sustainable stewardship efforts.
-
Supply Chain Transparency and Traceability:
- EVI-driven crop health data powers blockchain-enabled traceability, ensuring transparent supply chains from farm to market
Enable traceability with Farmonaut—for secure, verified food origins and quality assurance.
-
Credit, Insurance and Risk Assessment:
- Financial institutions utilize EVI-based analysis to assess crop loan risk, insurance coverage, and claim validation directly from remote sensing data
Explore Farmonaut’s crop loan and insurance platform—reduce fraud, streamline financing, and boost farmer access to credit!
Advanced Technology: How We Capture, Calculate, and Use EVI Data
Remote Sensing in Agriculture—The Power of Modern Data Sources
The remote sensing technology ecosystem has rapidly evolved, enabling us to harness EVI across multiple platforms and scales. Here’s how various technological channels capture and provide Enhanced Vegetation Index data for real-time, actionable insights:
-
Satellite Imagery:
- Satellites like MODIS (on NASA Terra & Aqua), Sentinel-2 (ESA), and Landsat are equipped to capture blue, red, and NIR bands necessary for EVI.
- They offer global and regional monitoring, allowing us to measure vegetation health anywhere and at frequent intervals.
- Farmonaut leverages frequent satellite updates for robust, timely data delivery.
-
Drones in Precision Agriculture:
- Drones equipped with multispectral sensors can capture EVI data at up to 2-5 cm spatial resolution—ideal for local crop management and research plots.
- They empower farm managers and advisors with granular, site-specific vegetation analysis.
-
IoT Sensors and Farm Data Integration:
- Although IoT networks do not directly calculate EVI, they provide vital context (moisture, temperature, humidity, etc.) that augments EVI analysis.
- This fusion provides a holistic understanding of vegetation responses to environmental changes.
-
Farmonaut API & Developer Access:
- Integrate EVI and satellite data directly into your business, research, or agribusiness platform with the robust Farmonaut API.
- Get technical details in our API developer docs.
Limitations and Practical Considerations with EVI
Though the Enhanced Vegetation Index brings advanced capabilities to vegetation monitoring, a few practical limitations should be kept in mind:
- Complex Calculation: EVI requires precise multispectral imagery with blue, red, and NIR bands—meaning some older or limited sensors may not be suitable.
- Data Availability: Not all satellites or sensors capture the blue band, restricting the number of data sources for EVI calculation in certain regions or time periods.
- Anomalous Values: White objects (clouds, buildings) and dark objects (water, shadow) can lead to anomalous EVI pixel values. Robust masking and processing, as implemented in Farmonaut’s platform, help maintain the accuracy and reliability of results.
No index is perfect—but EVI’s advantages far outweigh its limitations, especially when leveraged within a smart, integrated digital agriculture or forestry solution.
: 7 Shocking Benefits 3")
: 7 Shocking Benefits 4")
: 7 Shocking Benefits 5")
Farmonaut: Empowering You with Next-Gen Satellite Monitoring
At Farmonaut, our mission is to make precision agriculture affordable, accessible, and actionable for every farmer, agribusiness, and environmental manager worldwide. Our technology integrates EVI—along with several other satellite vegetation indices and advanced analytics—to deliver:
- Real-time crop health and vegetation monitoring with high spatial and temporal accuracy
- AI-powered advisory for risk management, resource optimization, and yield prediction
- Blockchain-based traceability for food system transparency
- Fleet/resource management for reduced logistical costs
- Carbon footprint analytics for truly sustainable land stewardship
Whether you’re a smallholder, large agribusiness, government planner, or tech developer, you can harness EVI for better outcomes on the ground and at scale—no costly hardware or legacy GIS expertise required.
Learn more about specific Farmonaut offerings:
- Carbon Footprinting – Monitor, manage, and offset emissions with real-time satellite data.
- Fleet Management – Streamline the logistics of agricultural vehicles and machinery.
- Crop, Plantation & Forest Advisory – Make smarter decisions with AI-driven insights for all land types.
Farmonaut Subscriptions & Pricing Table
Choose your plan and leverage the full power of satellite intelligence—EVI included—for your farm, plantation, forest, or research project:
Frequently Asked Questions
What is the Enhanced Vegetation Index (EVI), and how does it work?
The Enhanced Vegetation Index (EVI) is a remote sensing metric calculated from satellite or aerial images that uses the blue, red, and near-infrared (NIR) bands to provide a more sensitive and accurate measure of vegetation health and density than NDVI. EVI’s formula corrects for atmospheric conditions and soil background noise, making it highly effective for dense plant cover and changing conditions.
How does EVI compare to NDVI in agricultural monitoring?
Compared to NDVI, EVI offers improved sensitivity in dense crop and forest canopies, corrects for atmospheric noise such as haze or aerosols, and reduces influences from soil brightness. This means EVI produces more reliable results in advanced crop and forest monitoring applications.
Can EVI be used in all geographic areas?
EVI is applicable in most areas where satellite sensors capture the necessary spectral bands (blue, red, NIR). However, in some regions, data gaps may occur where only limited bands are available, or persistent cloud cover interferes with acquisition.
What platforms support EVI-based monitoring?
Leading satellite platforms like MODIS, Sentinel-2, and some drone sensors support EVI calculations. Farmonaut’s app, web platform, and API deliver EVI-powered vegetation monitoring for users globally.
How does Farmonaut help in using EVI for precision agriculture?
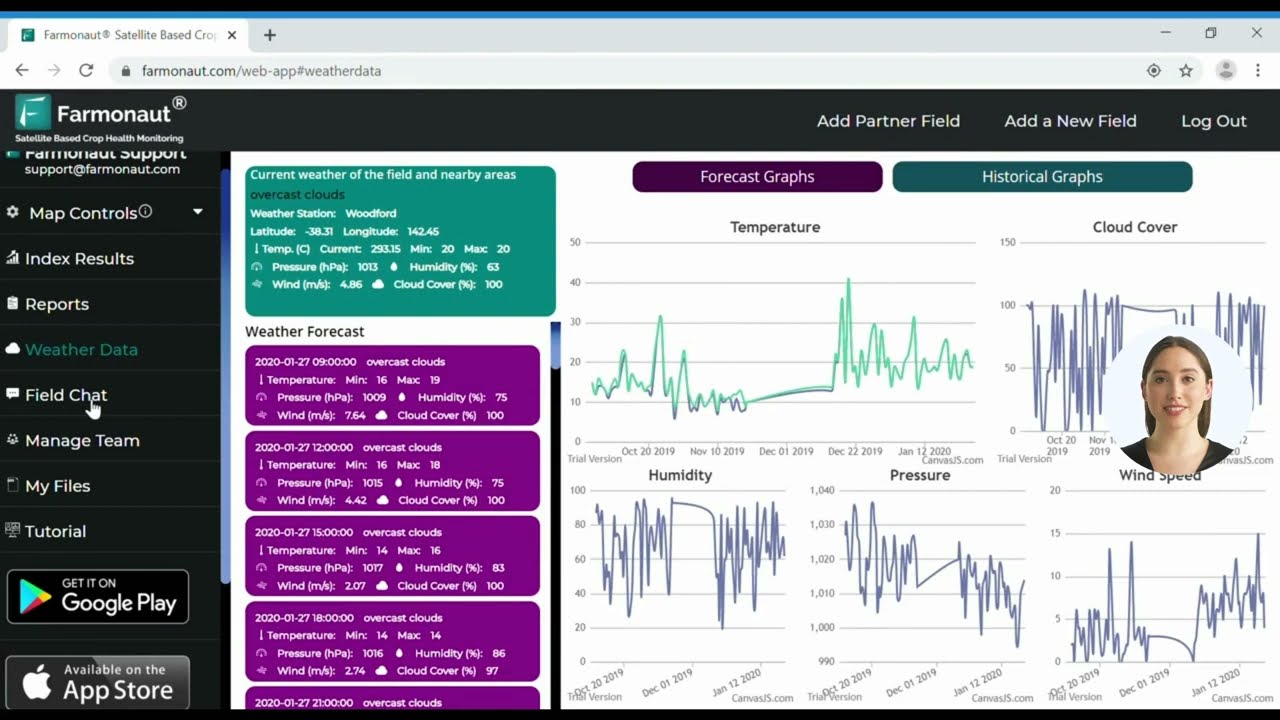
Farmonaut provides real-time EVI and other index-based maps, AI-recommendations, risk assessment, resource optimization tools, and seamless API integration, making it easy for farmers, cooperatives, insurers, researchers, and businesses to access, interpret, and act on actionable vegetation and crop health data.
Are there any drawbacks to using EVI?
EVI’s main limitations are the need for precise data (including the blue band), potential anomalous readings in the presence of clouds, snow, or water, and slightly more complex calculation compared to NDVI. However, modern platforms like Farmonaut automate these steps, delivering accessible results.
Conclusion: Powering Smart Decisions in Sustainable Land Management
The Enhanced Vegetation Index is more than a technical upgrade—it’s the future of precision vegetation health monitoring. By addressing NDVI’s limitations in saturation, atmospheric correction, and soil background effects, EVI enables us to make smarter, data-driven decisions in agriculture, forest management, conservation, and land administration.
With accessible, affordable platforms like Farmonaut, EVI’s sophisticated science is put within reach for every stakeholder—from smallholder farmers to global NGOs. Together, we can optimize crop yields, maintain forest ecosystems, ensure supply chain transparency, conserve biodiversity, and build more resilient agricultural systems.
Ready to take your farm management or research to new heights?
Start now with the Farmonaut App:
Integrate EVI into your research or business:
Visit the Farmonaut API (see our developer docs) for direct satellite data integration.
Stay ahead of the curve. Use the Enhanced Vegetation Index for your fields and forests—and unlock the future of sustainable, smart land management.


