
Remote Sensing Vegetation Index: 5 Shocking Crop Secrets
“NDVI can detect crop stress up to 10 days before visible symptoms appear, revolutionizing early intervention in agriculture.”
Introduction: Unveiling Crop Insights with Remote Sensing Vegetation Indices
We live in a world where precision agriculture is reshaping how we manage, monitor, and maximize crop yields. At the heart of this technological revolution is the remote sensing vegetation index, a collection of spectral-based tools allowing us to assess plant health, detect stress, and optimize farming practices with just a few clicks or taps. Using indices like NDVI, EVI, and others—calculated from specific reflectance measurements in the red and near-infrared (NIR) spectrum—farmers, agribusinesses, and foresters gain actionable insights for every stage of the crop life cycle.
In this blog, we unveil five shocking secrets hidden within vegetation indices. We’ll dive deep into their formulas, interpretations, real-world applications, and potential limitations. Along the way, you’ll witness how modern platforms, such as Farmonaut, are making these innovative technologies accessible and affordable to everyone—from smallholder farmers to large-scale corporations—driving higher productivity and sustainability in agriculture and forestry.

Understanding Vegetation Indices: The Science Behind the Scenes
To truly harness the power of vegetation indices in agriculture and forestry, it is crucial that we understand how these indices work and why they’re so transformative. Vegetation indices (VIs) are, in essence, mathematical calculations derived from satellite or UAV (Unmanned Aerial Vehicle) images that measure the spectral reflectance of vegetation. Using specific bands of the electromagnetic spectrum—primarily red, NIR, and sometimes green, blue, or red-edge—these indices interpret how plants absorb visible light for photosynthesis and reflect other portions of sunlight.
The equations behind vegetation indices are not arbitrary—they exploit the unique reflectance pattern of healthy plants. While healthy vegetation strongly absorbs energy in the red band (for photosynthesis), it reflects much of the energy in the NIR band due to the cellular structure of leaves. Stressed or senescing vegetation will demonstrate a different signature, allowing us to detect changes in health or growth.
Why Are Vegetation Indices Vital?
- Objective Assessment: VIs provide quantitative measures, reducing human error in crop monitoring.
- Large-Scale Monitoring: Remote sensing enables us to evaluate vast regions in a cost- and time-effective way.
- Precision Interventions: By detecting early plant stress or water deficits, interventions can be timely and precise, saving yields and resources.
- Environmental Stewardship: VIs support sustainable practices by optimizing inputs (like nitrogen) and minimizing waste.
Spectral Reflectance in Agriculture
Vegetation indices use the concept of spectral reflectance. When sunlight strikes plants, they absorb specific wavelengths (primarily blue and red) for photosynthesis, while reflecting others (notably NIR and green). By analyzing the ratio between absorbed and reflected light across specific bands, we gain insights into the chlorophyll content, biomass, water status, and general plant health.


The Five Shocking Crop Secrets: Key Remote Sensing Vegetation Indices
Now, let’s uncover the breakthrough vegetation indices used for crop monitoring, health assessment, and precision agriculture. Each index utilizes a different combination of spectral bands and offers unique insights into plant conditions—from water stress to nitrogen deficiency and beyond.
“Over 80% of precision agriculture systems now rely on remote sensing vegetation indices for real-time crop monitoring.”
-
Normalized Difference Vegetation Index (NDVI): The Industry Standard
The NDVI is the most widely used and recognized vegetation index in agriculture and forestry. It is calculated as:
NDVI = (NIR – Red) / (NIR + Red)
How does NDVI work? Healthy plants absorb most of the visible red light for photosynthesis, and reflect a significant portion in the near-infrared (NIR). Stressed or sparse vegetation reflects less NIR and more red, resulting in lower NDVI values.
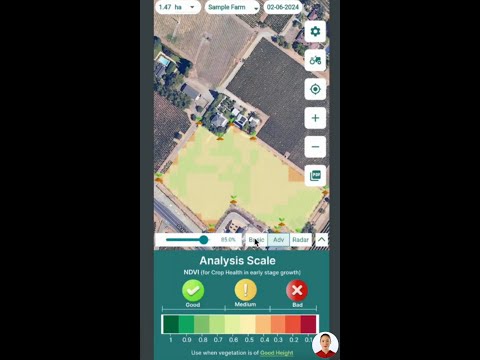
- Index Range: -1 to +1; higher values (0.6–0.9) indicate denser, healthier vegetation, while lower values suggest stressed or bare soil.
- Main Uses: Vegetation health assessment, crop growth monitoring, biomass estimation, drought detection, and forest health monitoring.
- Benefits: Fast, reliable, and interpretable at multiple scales from field to continent.
Get NDVI in agriculture through Farmonaut’s mobile and web apps, enabling you to monitor crop conditions in real-time.
-
Enhanced Vegetation Index (EVI): Cutting Through the Noise
EVI is designed to address two limitations of NDVI: atmospheric influences and soil background effects—especially important in dense or complex landscapes.
EVI = G × (NIR – Red) / (NIR + C1×Red – C2×Blue + L)
Where G (gain), C1, C2, and L are constants; Blue is the reflectance in the blue band.- Main Uses: Effective in high-biomass areas such as rainforests, where NDVI can “saturate.”
- Advantages: Reduces atmospheric and brightness influences, providing more precise values in challenging environments.
- Typical Value Range: For healthy crops, generally 0.2–0.9.
Tip: EVI is crucial for regions with lush, fast-growing vegetation or where dust and aerosols frequently alter imagery.
-
Normalized Difference Red Edge (NDRE): Revealing Hidden Nitrogen Deficiency
NDRE leverages the “red edge” band—sensitive to subtle shifts in chlorophyll content—making it ideal for early plant stress detection and managing nitrogen application.
NDRE = (NIR – Red Edge) / (NIR + Red Edge)
- Main Uses: Detecting hidden plant stress before visible symptoms, precision nitrogen management in crops like wheat, corn, and rice.
- Advantages: Highly sensitive for assessing crop vigor during key growth stages.
- Value Range: Similar scale to NDVI, but often more responsive to subtle differences.
Example: With Farmonaut’s spectral analytics, NDRE is invaluable for tailoring fertilizer strategies, reducing waste and improving yields—key for large-scale farm management.
-
Soil-Adjusted Vegetation Index (SAVI): Tackling Soil Background Effects
SAVI modifies the NDVI formula by introducing a soil brightness correction factor, L (typically 0.5), minimizing the influence of exposed soil—critical in sparse vegetation or arid regions.
SAVI = [(NIR – Red) × (1 + L)] / (NIR + Red + L)
- Primary Application: Early crop growth monitoring, arid and semi-arid agriculture, exposed field detection.
- Benefit: Delivers more accurate vegetation index values in areas where plants only sparsely cover the soil surface.
- Pro Tip: For young or recently sown crops, SAVI provides a more reliable assessment than NDVI alone.
See more: Farmonaut’s platform offers high-quality SAVI-based crop monitoring—vital for fields with variable soil exposure.
-
Normalized Difference Water Index (NDWI): Monitoring Water Stress & Drought
NDWI is a valuable tool for irrigation management and drought monitoring. By comparing reflectance in the green and NIR bands:
NDWI = (Green – NIR) / (Green + NIR)
- Main Purpose: Evaluates relative water content in vegetation, assisting in efficient irrigation scheduling and drought detection.
- Typical Interpretation: Positive NDWI values = healthy, adequately watered plants. Negative values = water deficit or stress.
- Precision Tip: Use NDWI for irrigation management to conserve water and ensure crops receive exactly what they need—reducing losses, increasing sustainability.
For drought-prone regions, integrating NDWI with Farmonaut’s satellite-based advisory gives a holistic picture of both soil and crop water status, supporting timely resource allocation for maximum productivity.


Comparative Vegetation Index Table
To help you quickly compare the core vegetation indices used in remote sensing for crop monitoring, here’s a comprehensive table summarizing formulas, main applications, sensitivity, and impact for precision agriculture. These tools inform everything from biomass estimation to plant stress detection and irrigation strategies.
| Index Name | Formula/Calculation | Primary Use Case | Sensitivity to Soil/Atmosphere | Typical Value Range | Practical Impact in Agriculture |
|---|---|---|---|---|---|
| NDVI (Normalized Difference Vegetation Index) |
(NIR – Red)/(NIR + Red) | Vegetation health, biomass estimation, crop growth, forest health | Sensitive to both soil background and atmospheric conditions | -1 to 1 (Healthy crops 0.6 – 0.9) |
Real-time crop monitoring, early stress detection, trend analysis |
| EVI (Enhanced Vegetation Index) |
G × (NIR – Red)/ (NIR + C1×Red – C2×Blue + L) | Dense forest monitoring, high-biomass crops, saturated NDVI regions | Less sensitive to soil/atmospheric influences than NDVI | 0 – 1 (Healthy: 0.2 – 0.9) |
Improved accuracy in lush/dusty areas, refined vegetation health assessment |
| NDRE (Normalized Difference Red Edge) |
(NIR – Red Edge)/(NIR + Red Edge) | Chlorophyll/nitrogen status, early plant stress, mid/late-season crops | Less affected by soil, more sensitive to biochemical changes | -1 to 1 (Higher = vigorous, healthy; lower = stressed) |
Optimize nitrogen application, precision fertilizer strategies |
| SAVI (Soil-Adjusted Vegetation Index) |
[(NIR – Red) × (1 + L)] / (NIR + Red + L) | Sparse vegetation, arid fields, early crop stages | Minimizes soil brightness/background effects | -1 to 1 (Healthy: 0.5 – 0.8) |
More accurate assessment in exposed soil areas, supports site-specific interventions |
| NDWI (Normalized Difference Water Index) |
(Green – NIR)/(Green + NIR) | Water content/status, drought, irrigation needs | Sensitive to canopy water, less soil interference | -1 to 1 (>0 = healthy/wet, <0 = water stress) |
Efficient irrigation management, early drought alert |
Applications of Vegetation Indices in Agriculture & Forestry
Let’s explore how vegetation indices drive real innovation across public and private sectors:
1. Remote Sensing for Crop Monitoring
Using NDVI, NDRE, and EVI, we can remotely monitor crop health and growth throughout the season, gaining early warnings about plant stress (whether caused by drought, pests, or nutrient deficiencies). This is revolutionizing crop management—allowing for cost savings and yield optimization.
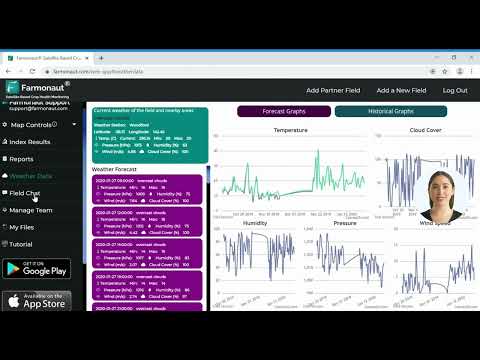
- Visual Field Maps: Platforms generate color-coded maps to highlight healthy, stressed, or drought-affected areas instantly.
- Historical Data: Track crop progression year over year to identify patterns and improve long-term management.
2. Precision Agriculture Tools for Resource Optimization
VIs enable us to apply precisely the right amount of fertilizer, pesticides, or irrigation only where it’s truly needed—driving up efficiency, minimizing environmental impact, and reducing costs.
- Variable Rate Application: Early stress detection and NDRE insights support targeted nitrogen management—avoiding both under- and over-application.
- Sustainability: Farmonaut’s technology leverages satellite analytics for optimal resource use, addressing soil, water, and chemical inputs—all accessible from your phone, browser, or via API and developer documentation.
3. NDWI for Irrigation Management
NDWI’s sensitivity to canopy water content allows for dynamic irrigation scheduling, drought mapping, and improved water conservation. By delivering alerts for negative NDWI signals, we prevent unnecessary stress and yield loss.
- Use Case: In water-scarce regions, NDWI reduces labor and guesswork, ensuring crops remain resilient—even under challenging environmental conditions.
4. Forest Health Monitoring & Biomass Estimation
Vegetation indices help foresters and conservationists monitor forest health, detect illegal logging, and estimate biomass and canopy structure—all critical for carbon tracking and sustainable forest management.
- Platform Benefit: Farmonaut’s system delivers regular forest health updates at any scale, supporting both commercial forestry and ecosystem protection initiatives.
For extended forestry support, see: Crop, Plantation & Forest Advisory on Farmonaut.
5. Crop Loan Verification & Insurance Risk Assessment
Financial institutions use satellite-based NDVI and other indices for transparent, unbiased verification of crop health before approving loans or settling insurance claims.
- Benefit: Reduces fraud and paperwork, making financing accessible to more farmers.
Learn more: Farmonaut’s Satellite-Based Crop Loan & Insurance Solutions.
Farmonaut: Affordable Precision Agriculture at Your Fingertips
As technology rapidly advances, accessibility remains a primary challenge—especially in developing regions. Farmonaut bridges this gap by delivering a suite of precision agriculture tools to farmers everywhere. Whether you have 5 or 5,000 hectares, our mission is to democratize satellite-based crop monitoring and data-driven decision-making.
- Real-Time Crop Health Monitoring: Instantly assess NDVI, NDRE, EVI, SAVI, and NDWI values for any location, down to parcel level;
- Jeevn AI Advisory System: Personalized, AI-powered recommendations delivered through an intuitive interface;
- Blockchain-Based Product Traceability: Increase the transparency and value of your agricultural products—see Farmonaut Traceability;
- Resource & Fleet Management (Fleet, Fuel, Machinery): Improve operational efficiency and cut costs via Farmonaut Fleet Management tools;
- Carbon Footprint Monitoring: Support sustainability and compliance by tracking real-time emissions—visit Farmonaut Carbon Footprinting for details.
Our solutions are platform-agnostic: access via web, Android, iOS, or integrate directly with your workflow through API access.
Farmonaut’s Technology Stack & Business Model
Let’s break down our approach to delivering actionable insights and powerful remote sensing vegetation indices to every corner of the globe:
- Satellite Imagery & AI: High-frequency, multispectral monitoring using commercial and open-access satellites—analyzed by advanced AI and machine learning models to extract field-level VIs, moisture, and more.
- Blockchain Traceability: Enables ownership and supply chain transparency, trusted by consumer-facing corporate clients in food, textiles, and commodities.
- Resource Management: Fleet, logistics, and farm resource tools with analytics dashboards for efficient planning and reduced operational risk—see Farmonaut Fleet Management.
- Environmental Impact: Carbon footprint tracking, supporting enterprises with data for sustainability initiatives and regulatory compliance.
Our subscription-based pricing model ensures you pay for what you use, scaling seamlessly from small farms to large agribusinesses and government contracts. Our open API documentation means integration for researchers and agri-enterprises is hassle-free.
- Target Audience: Individual farmers, cooperatives, agribusinesses, government agencies, NGOs, financial institutions, and large corporate plantation managers.
FAQ on Remote Sensing Vegetation Indices
- What’s the most popular remote sensing vegetation index in agriculture?
- NDVI (Normalized Difference Vegetation Index) remains the go-to for vegetation health assessment worldwide, thanks to its simplicity and proven correlation with crop vigor.
- How early can vegetation indices detect crop stress or disease?
- With indices like NDVI and NDRE, we can detect stress up to 10 days ahead of visible signs, making timely intervention and yield protection possible.
- Why do we need indices like EVI, SAVI, and NDRE in addition to NDVI?
- Each index addresses unique conditions: EVI overcomes NDVI’s limitations in dense, lush areas; SAVI corrects for soil background where vegetation is sparse; NDRE is sensitive to chlorophyll and nitrogen content, ideal for stress and nutrient management.
- How does Farmonaut make remote sensing tools accessible and affordable?
- By using satellite data instead of costly hardware and offering flexible web, mobile, and API options, Farmonaut brings high-precision, real-time crop monitoring to every scale of farmer or business.
- Which platform is best for crop health monitoring in my region?
- Farmonaut supports global agriculture, tailoring solutions for every region—from arid fields needing SAVI, to rainforests requiring EVI, to crops requiring NDRE for nutrition and health insights.
- Where can I access API documentation or try the Farmonaut app?
Conclusion: Empowering Crop Management With Vegetation Health Insights
The remote sensing vegetation index is far more than a technical formula—it’s our gateway to smarter, more resilient, and sustainable agriculture. By embracing indices like NDVI, EVI, NDRE, SAVI, and NDWI, we unlock a world where every input is optimized, every threat is detected early, and every field is monitored in real-time. Platforms like Farmonaut lead this revolution, bringing these advanced precision agriculture tools to individual farmers, large agribusinesses, NGOs, and governments alike.
Our journey demonstrates that with the right vegetation indices and digital solutions, crop management is no longer a guessing game. Instead, it becomes a data-driven strategy—empowering us to feed the world while stewarding the land for future generations. Explore Farmonaut, make informed decisions, and join the precision farming movement today.


