Soybean Crop Images: A Comprehensive Guide to Understanding and Leveraging Visual Data in Soybean Farming
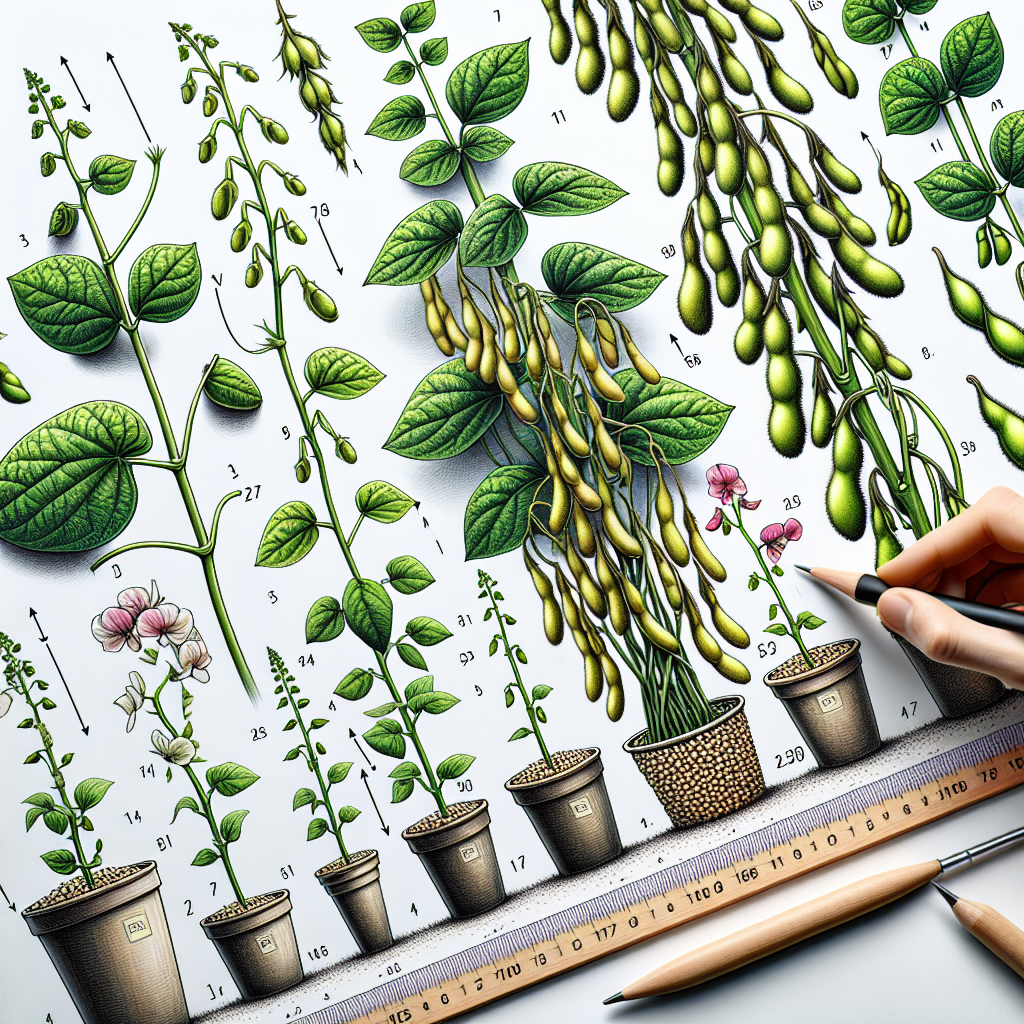
In the ever-evolving world of agriculture, visual data has become an invaluable tool for farmers, agronomists, and researchers alike. At Farmonaut, we understand the critical role that soybean crop images play in modern farming practices. This comprehensive guide will delve deep into the world of soybean crop imagery, exploring its applications, benefits, and the cutting-edge technologies that make it possible.
Table of Contents
- Introduction to Soybean Crop Imagery
- The Importance of Visual Data in Soybean Farming
- Types of Soybean Crop Images
- Interpreting Soybean Crop Images
- Farmonaut’s Satellite-Based Crop Monitoring System
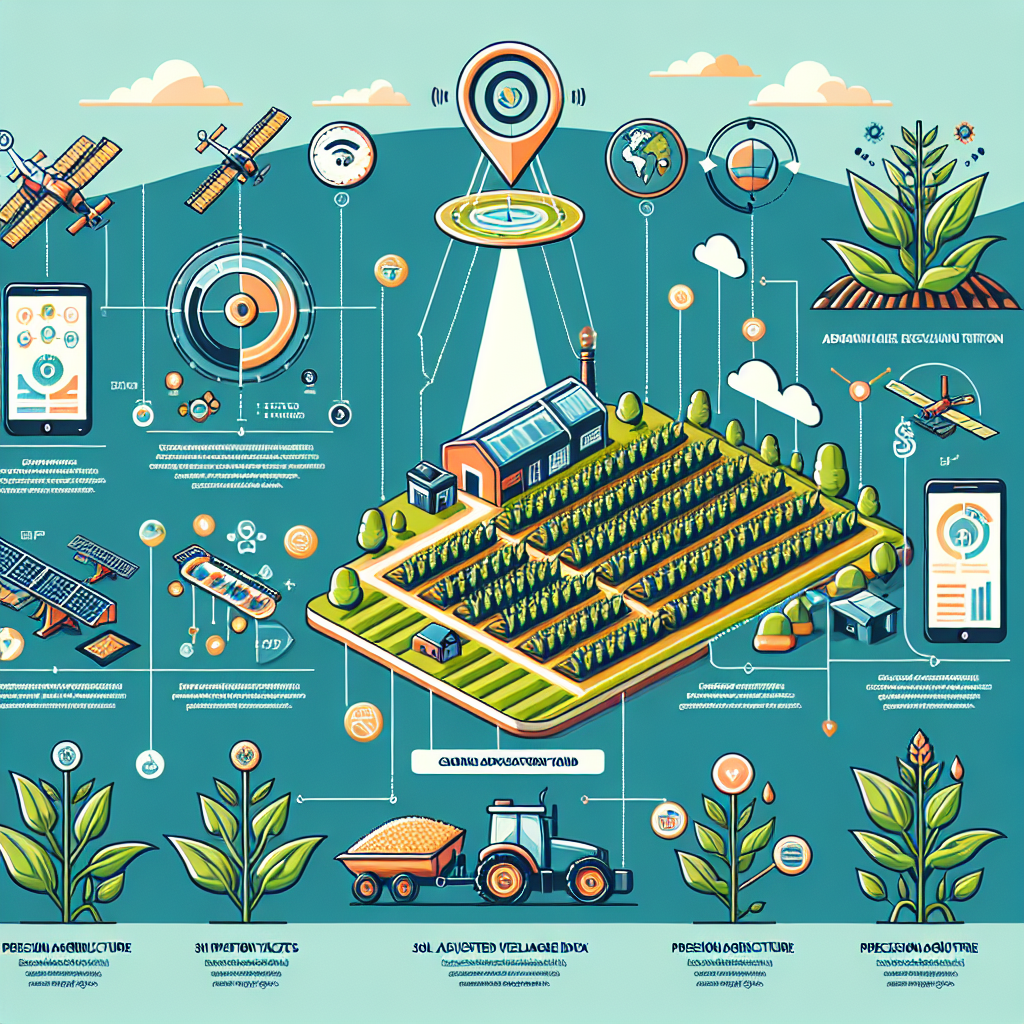
- Applications of Soybean Crop Images in Precision Agriculture
- Challenges and Limitations of Soybean Crop Imagery
- Future Trends in Soybean Crop Imaging
- FAQ Section
1. Introduction to Soybean Crop Imagery
Soybean crop images are visual representations of soybean fields captured through various means, including satellites, drones, and ground-based cameras. These images provide a wealth of information about crop health, growth stages, and potential issues that may not be visible to the naked eye.
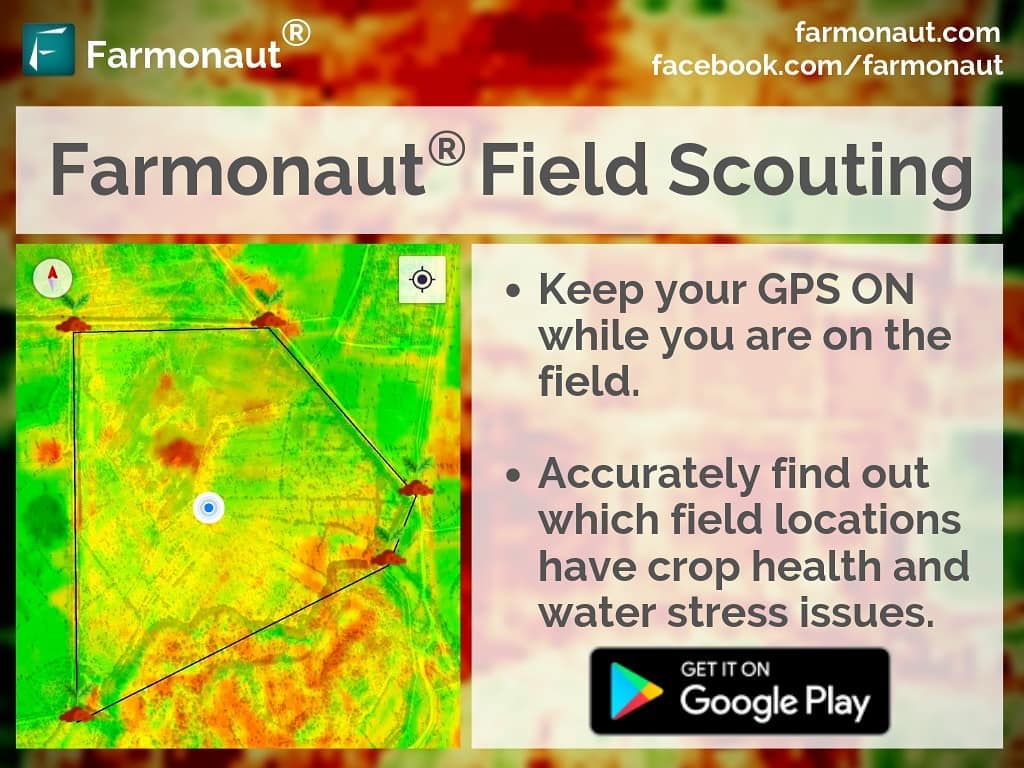
At Farmonaut, we specialize in satellite-based crop monitoring, offering farmers and agribusinesses access to high-resolution soybean crop images that can revolutionize their farming practices. Our advanced technology allows for frequent, large-scale monitoring of soybean fields, providing invaluable insights throughout the growing season.
2. The Importance of Visual Data in Soybean Farming
Visual data, particularly in the form of soybean crop images, has become a cornerstone of modern agriculture. Here’s why it’s so crucial:
- Early Problem Detection: Images can reveal issues like pest infestations, diseases, or nutrient deficiencies before they become visible to the naked eye.
- Precision Agriculture: Detailed imagery allows for targeted interventions, optimizing resource use and improving yields.
- Crop Progress Monitoring: Regular imaging helps track soybean growth stages and overall crop development.
- Yield Estimation: Advanced analysis of crop images can provide accurate yield predictions.
- Historical Data: Over time, a collection of soybean crop images creates a valuable historical record for long-term planning and analysis.
3. Types of Soybean Crop Images
There are several types of soybean crop images used in agriculture, each offering unique insights:
3.1 RGB Images
Standard color images that provide a visual representation of the field as seen by the human eye. These are useful for general assessments and identifying obvious issues like lodging or large-scale pest damage.
3.2 Multispectral Images
These images capture light from multiple bands of the electromagnetic spectrum, including visible and near-infrared light. They’re particularly useful for assessing plant health and vigor.
3.3 Thermal Images
Thermal imaging detects heat signatures, which can be useful for identifying water stress in soybean crops.
3.4 Hyperspectral Images
These provide the most detailed spectral information, capturing hundreds of narrow bands across the electromagnetic spectrum. They can provide insights into subtle changes in crop health and biochemistry.
4. Interpreting Soybean Crop Images
Interpreting soybean crop images requires a combination of agricultural knowledge and image analysis skills. Here are some key aspects to consider:
4.1 Color and Texture
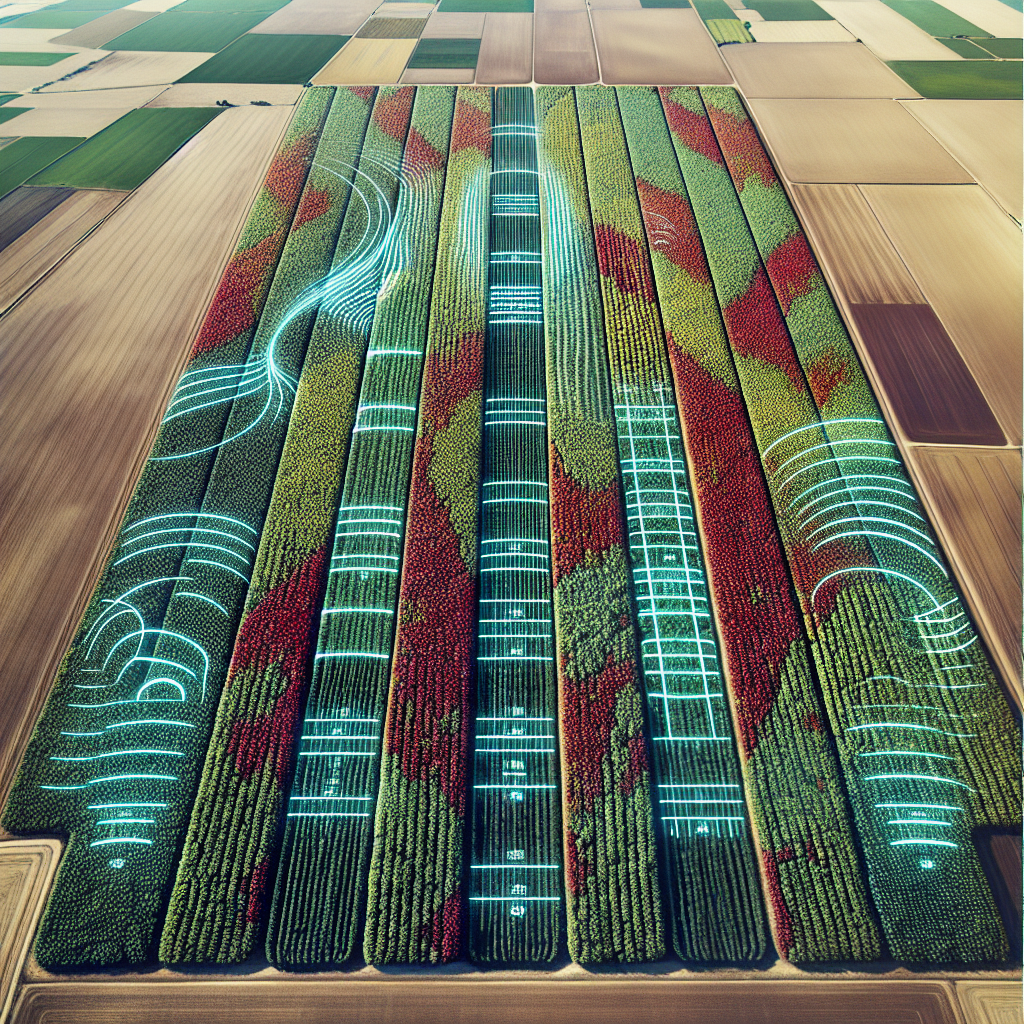
In RGB images, healthy soybean crops typically appear as a uniform green color. Variations in color or texture can indicate issues such as nutrient deficiencies, pest infestations, or disease.
4.2 Vegetation Indices
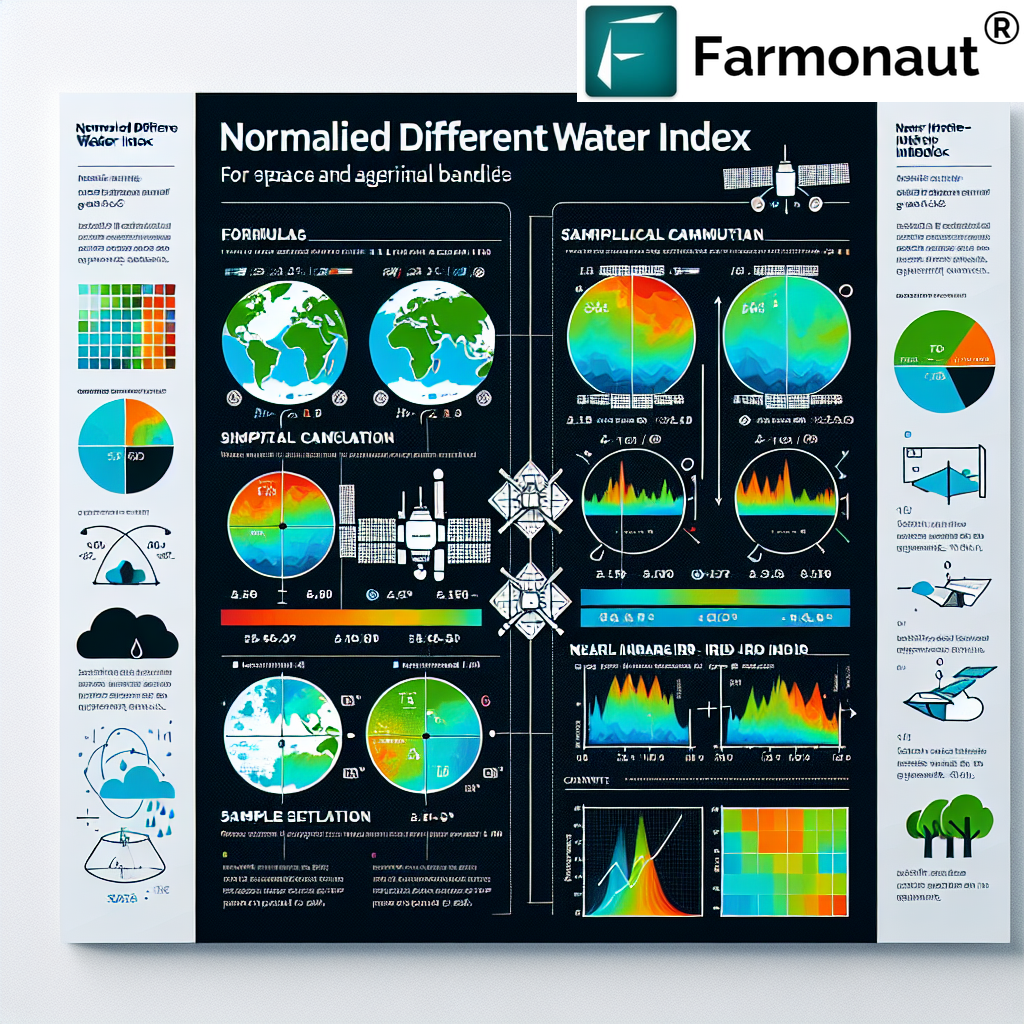
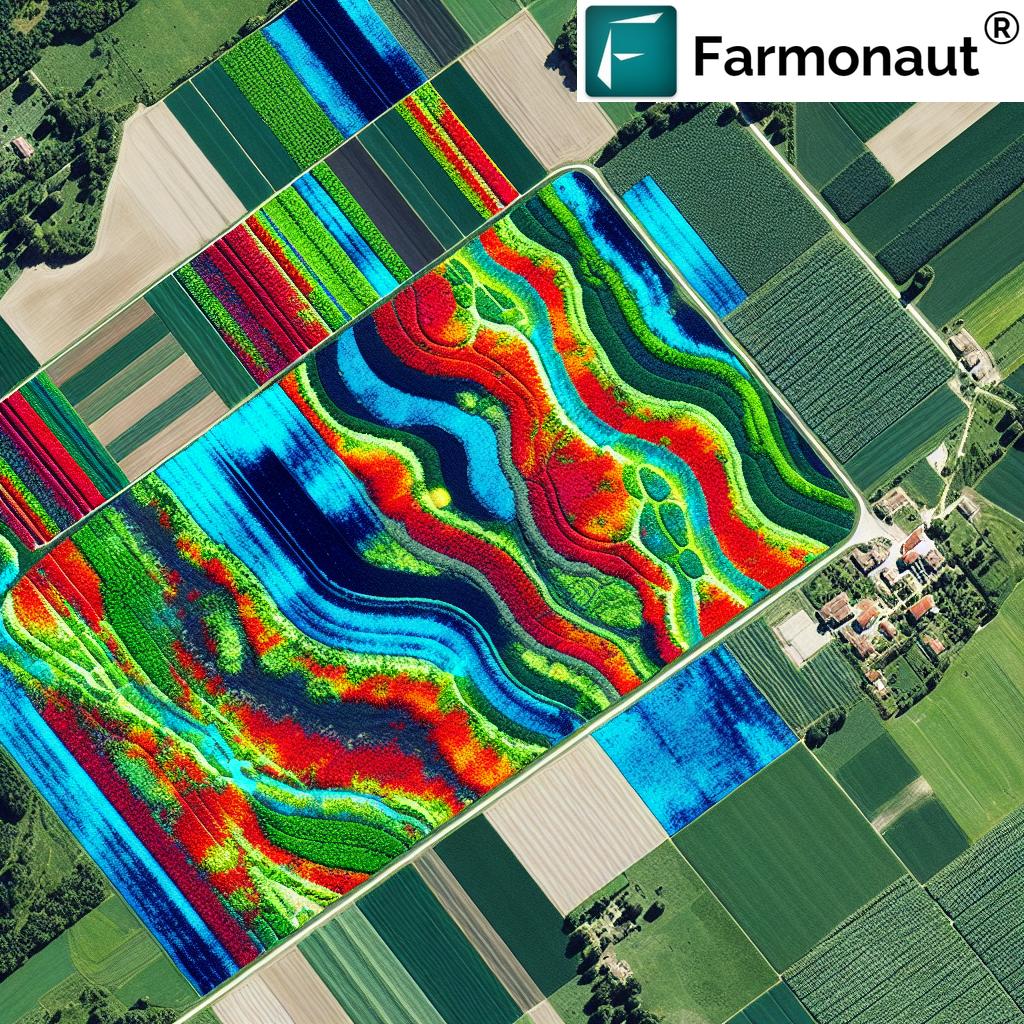
Multispectral images allow for the calculation of vegetation indices like NDVI (Normalized Difference Vegetation Index). These indices provide quantitative measures of plant health and vigor.
4.3 Spatial Patterns
The distribution of healthy and stressed areas within a field can provide clues about the underlying causes of problems. For example, stress patterns along rows might indicate equipment issues, while irregular patches could suggest soil variability or pest hotspots.
4.4 Temporal Changes
Comparing soybean crop images over time can reveal trends in crop development and highlight areas of concern that may require intervention.
5. Farmonaut’s Satellite-Based Crop Monitoring System
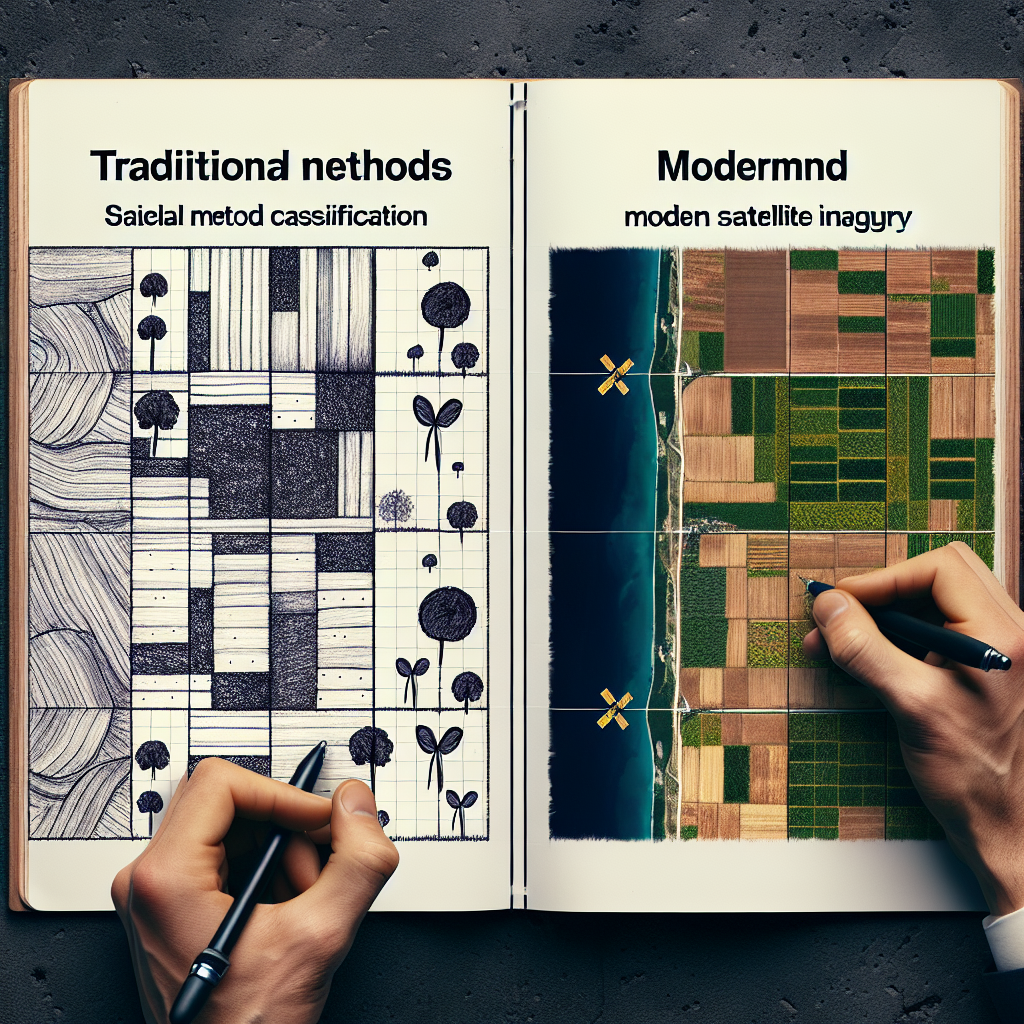
At Farmonaut, we’ve developed a state-of-the-art satellite-based crop monitoring system that provides farmers with frequent, high-resolution soybean crop images. Our system offers several advantages over traditional monitoring methods:
| Feature | Farmonaut Satellite System | Drone-based Monitoring | IoT-based Monitoring |
|---|---|---|---|
| Coverage Area | Large scale (100s to 1000s of hectares) | Limited (typically <100 hectares per flight) | Limited by sensor placement |
| Frequency of Data Collection | Every 3-5 days | As needed, but limited by operational constraints | Continuous, but point-based |
| Infrastructure Required | Minimal (web/mobile app access) | Drone equipment and trained operators | Extensive sensor network and maintenance |
| Cost | Low to moderate, scalable | High initial investment, ongoing operational costs | High initial investment, ongoing maintenance costs |
| Data Processing | Automated, AI-driven analysis | Often requires manual processing | Automated, but limited to sensor locations |
| Weather Independence | Can operate in most weather conditions | Limited by wind, rain, and visibility | Generally weather-independent |
Our satellite-based system provides comprehensive coverage of soybean fields, delivering actionable insights through our user-friendly platform. To experience the power of Farmonaut’s crop monitoring system, visit our app or explore our API documentation for integration options.
6. Applications of Soybean Crop Images in Precision Agriculture
The use of soybean crop images in precision agriculture has revolutionized farming practices. Here are some key applications:
6.1 Crop Health Monitoring
Regular analysis of soybean crop images allows farmers to track the overall health of their crops throughout the growing season. By detecting early signs of stress or disease, farmers can take prompt action to mitigate potential yield losses.
6.2 Variable Rate Applications
Using detailed crop health maps derived from soybean crop images, farmers can implement variable rate applications of fertilizers, pesticides, and other inputs. This targeted approach optimizes resource use and can lead to significant cost savings.
6.3 Irrigation Management
Thermal and multispectral images can reveal areas of water stress in soybean fields. This information allows for more precise irrigation management, ensuring that water resources are used efficiently.
6.4 Yield Prediction
Advanced analysis of soybean crop images throughout the growing season can provide accurate yield predictions. This information is valuable for harvest planning, marketing decisions, and financial forecasting.
6.5 Field Zoning
By analyzing patterns in crop health and productivity over time, farmers can create management zones within their fields. These zones can be managed differently to optimize inputs and maximize overall field productivity.
7. Challenges and Limitations of Soybean Crop Imagery
While soybean crop images offer numerous benefits, there are also challenges and limitations to consider:
7.1 Image Resolution
The resolution of satellite images may not always be sufficient for detecting small-scale issues. However, Farmonaut’s advanced technology provides high-resolution imagery that can identify problems at a detailed level.
7.2 Cloud Cover
Cloud cover can interfere with satellite imaging. Our system at Farmonaut uses a combination of satellites and advanced algorithms to minimize the impact of cloud cover on data collection.
7.3 Data Interpretation
Interpreting soybean crop images requires expertise. Farmonaut addresses this challenge by providing AI-driven analysis and user-friendly interfaces that make data interpretation accessible to all users.
7.4 Integration with Other Data Sources
For maximum benefit, crop imagery should be integrated with other data sources such as soil tests, weather data, and historical yield data. Farmonaut’s platform is designed to integrate multiple data sources for comprehensive analysis.
8. Future Trends in Soybean Crop Imaging
The field of crop imaging is rapidly evolving. Here are some trends we’re watching closely at Farmonaut:
8.1 Hyperspectral Imaging
As hyperspectral sensors become more affordable and data processing capabilities improve, we expect to see increased use of hyperspectral imaging in soybean crop monitoring.
8.2 AI and Machine Learning
Advanced AI algorithms will continue to improve the accuracy of crop health assessments and yield predictions based on soybean crop images.
8.3 Integration with IoT
The integration of satellite imagery with ground-based IoT sensors will provide even more comprehensive and accurate data for soybean farmers.
8.4 Real-time Imaging
Advancements in satellite technology may soon allow for near-real-time imaging of soybean fields, enabling even faster response to emerging issues.
9. FAQ Section
Q1: How often should I capture soybean crop images?
A1: The frequency of imaging depends on your specific needs and the growth stage of your crop. At Farmonaut, we typically provide updates every 3-5 days, which is sufficient for most soybean management needs.
Q2: Can soybean crop images detect all types of crop stress?
A2: While soybean crop images can detect many types of stress, including nutrient deficiencies, water stress, and some diseases, they may not capture all issues. It’s best to use crop imagery in conjunction with ground-truthing and other monitoring methods.
Q3: How accurate are yield predictions based on crop images?
A3: The accuracy of yield predictions based on crop images has improved significantly with advances in AI and machine learning. When combined with historical data and other factors, predictions can be quite accurate, typically within 5-10% of actual yields.
Q4: Is specialized equipment needed to use Farmonaut’s soybean crop imaging service?
A4: No specialized equipment is needed. Our satellite-based system provides soybean crop images and analysis through our web and mobile applications. You can access our services on any internet-connected device.
Q5: How does Farmonaut ensure the security of my farm data?
A5: At Farmonaut, we take data security very seriously. All farm data is encrypted and stored securely in the cloud. We adhere to strict privacy policies and never share individual farm data without explicit permission.
In conclusion, soybean crop images have become an indispensable tool in modern agriculture. At Farmonaut, we’re committed to providing farmers with the most advanced, user-friendly, and cost-effective crop monitoring solutions available. Our satellite-based system offers unparalleled coverage and frequency, empowering soybean farmers to make data-driven decisions that optimize yields and resource use.
Ready to revolutionize your soybean farming practices? Try Farmonaut today and experience the power of precision agriculture at your fingertips. Our app is available for both Android and iOS devices.
For developers interested in integrating our powerful crop monitoring capabilities into their own applications, check out our comprehensive API documentation.
Subscribe to Farmonaut’s services and take your soybean farming to the next level:
Join the precision agriculture revolution with Farmonaut and unlock the full potential of your soybean fields!


