

Farm & Ranch Loans in Washington: Rates, Limits, Lenders
Reviewed August 2026 against the USDA Farm Service Agency’s lending-rate releases, USDA NASS state agriculture data, and Farm Credit System state reports.
Try it: Run your own numbers →
Farm loans in Washington run through three channels: USDA’s Farm Service Agency (FSA) direct and guaranteed programs, the cooperative Farm Credit System (AgWest Farm Credit in Washington State, FCS Financial in Missouri), and commercial ag lenders. As of August 1, 2026, FSA’s direct Farm Ownership rate is 6.000% and its direct Farm Operating rate is 5.250%, while guaranteed loans carry a rate the lender sets, capped by FSA rules, up to a $2,343,000 loan ceiling. If your search landed here because you typed “farm lenders in Washington, MO”: no Farm Credit branch sits inside Washington’s city limits, but FCS Financial’s nearest office is 8 miles away in Union, the Franklin County seat, at 301 Highway 50 West, phone (636) 583-5400.
The rest of this page separates the two Washingtons, prices out rural ranch loans against row-crop financing, and gives you a way to check every figure yourself once these numbers move — because FSA republishes its rate sheet monthly and USDA’s farm-count data resets every year.
Farm Loans in Washington State: Rates, Limits, and Who Lends
Washington State carried 31,500 farms on 13.7 million acres in USDA’s 2025 State Agriculture Overview, averaging 435 acres per operation — a figure NASS recalculates every year and republishes at USDA NASS Quick Stats. Two Farm Credit System institutions serve the state: AgWest Farm Credit, the retail cooperative lending to farmers, ranchers, and rural homeowners, and CoBank, which handles larger agribusiness and cooperative financing. As of December 31, 2025, Farm Credit’s own state report put Washington activity at 4,260 customers, $10.8 billion in loan volume, and $285.7 million returned to members as patronage dividends.
On top of the cooperative system, every Washington farmer can apply for the same federal programs available nationwide. FSA’s direct loans are funded and serviced by FSA county staff; guaranteed loans are funded by a private lender with FSA backing up to 95% of the loan against loss. Here is the full rate and cap table as of the August 2026 announcement:
| Program | Type | Rate (Aug. 2026) | Maximum Loan | Key Detail |
|---|---|---|---|---|
| Farm Operating | Direct | 5.250% | $400,000 | Funded and serviced by FSA county offices |
| Farm Ownership | Direct | 6.000% | $600,000 | Covers land purchase, construction, and improvements |
| Farm Ownership – Joint Financing | Direct | 4.000% | Counts toward the $600,000 Farm Ownership cap | Paired with a non-FSA lender, e.g. AgWest’s 50-50 program |
| Farm Ownership – Down Payment | Direct | 2.000% | Structured for beginning farmers | Requires a participating lender to fund the balance |
| Operating / Ownership / Conservation | Guaranteed | Set by the lender, not FSA | $2,343,000 (adjusted annually for inflation) | FSA guarantees up to 95% of the loan against loss |
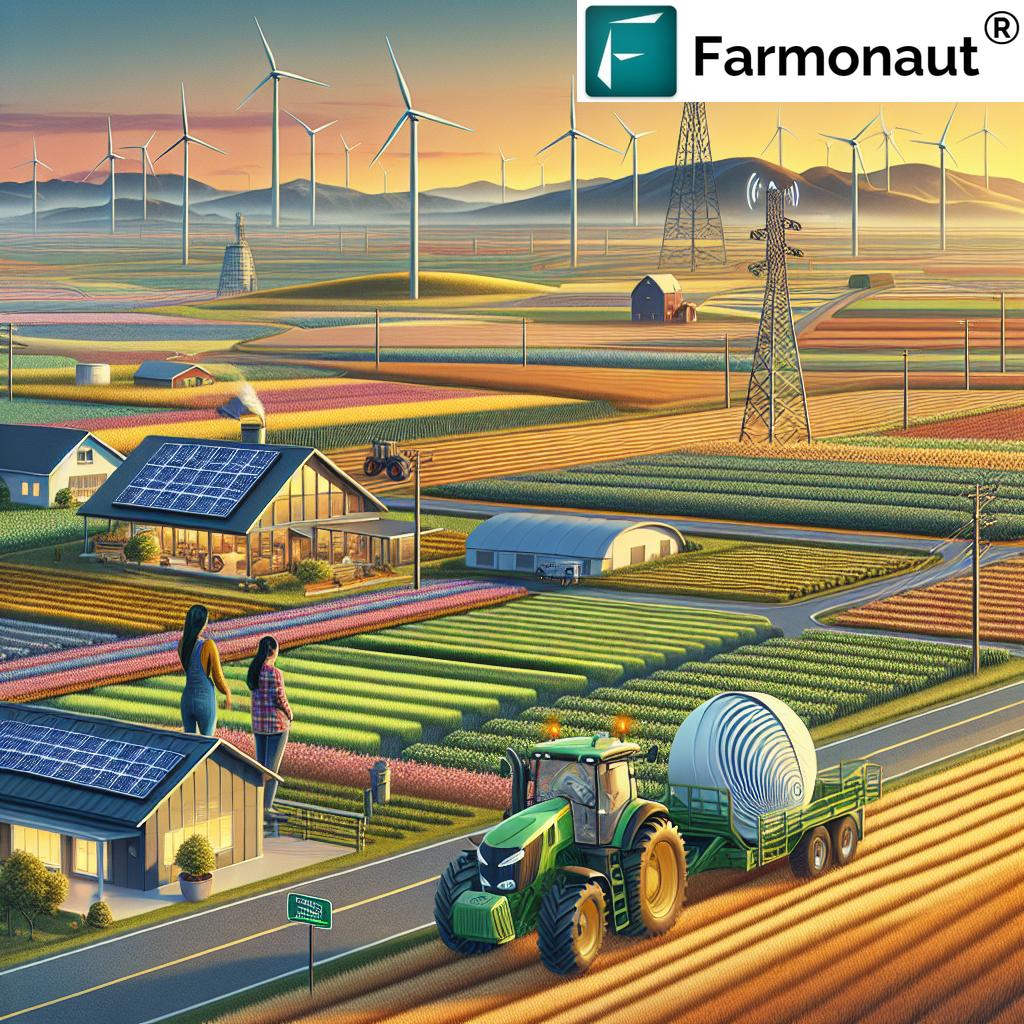
Where a real-estate mortgage structure fits better than an FSA operating note — for example, financing a long-term land purchase with amortized payments over decades rather than a single crop cycle — our separate breakdown of agricultural mortgage loan strategies walks through that structure in more depth. If your land search extends past Washington’s borders, we cover a comparable state-specific program lineup in farm loans and startup loans in Tennessee.

Farm Lenders in Washington, Missouri: What’s Actually Nearby
Washington, Missouri sits in Franklin County, and it’s a common mix-up: searches for “farm lenders in washington mo” and “farm loans washington missouri” are looking for ag credit in this river town, not the Pacific Northwest state above. FCS Financial calls itself “Missouri’s Largest Ag Lender” and runs 21 branded branch locations across the state, per its own FCS Financial location directory, plus its corporate office in Jefferson City. There is no FCS Financial branch inside Washington, Missouri itself — the closest is the Union office, 8 miles southwest at 301 Highway 50 West, Suite A, Union, MO 63084, reachable at (636) 583-5400 or toll-free (800) 583-5400.
Statewide, Farm Credit’s Missouri report shows 15,502 customers, $13.3 billion in loan volume, and $82.5 million in patronage dividends as of December 31, 2025 — a larger customer base and loan book than Washington State’s, but a smaller per-customer patronage payout that year. Missouri also carries more farms on a smaller average footprint: NASS’s 2025 overview counts 85,500 Missouri farms on 26.6 million acres, averaging 311 acres each, against Washington’s 31,500 farms averaging 435 acres. That size gap matters for loan sizing — a Missouri operating loan against 311 average acres draws a smaller line of credit per farm than a Washington loan against 435 acres, even before crop mix is considered.
Missouri farmers also have a state-level option worth checking directly with the agency: the Missouri Agricultural and Small Business Development Authority administers linked-deposit and loan-guarantee programs for beginning and existing farmers, separate from both FSA and Farm Credit. Terms are set by the participating bank and the Authority, so confirm current rates with them rather than a third-party summary.
Rural Ranch Loans and Farm-and-Ranch Financing: How They’re Structured
“Rural ranch loans” and “farm and ranch loans” usually mean something broader than a single-season operating note: a real-estate purchase covering rangeland, a country home, outbuildings, and sometimes livestock or equipment bundled into one note. Farm Credit institutions build specifically for this. AgWest Farm Credit offers country home loans and rural lot loans alongside its farm and ranch real estate lending, and both AgWest and FCS Financial finance recreational and hunting land as a named product line, not a side case.
For a first-time buyer, the clearest below-market path in Washington is the Washington State Housing Finance Commission’s Beginning Farmer and Rancher program, delivered through Northwest Farm Credit Services (AgWest). Per the Commission’s own program page, total financing tops out at $649,400, split into a $250,000 sublimit for depreciable farm property and a $62,500 sublimit for used equipment; land, buildings, and agricultural improvements are eligible, and the applicant must have operated on less than 30% of the county’s median farm size to qualify as “beginning.” AgWest layers a separate 5-45-50 Beginning Farmer Down Payment structure on top: the farmer puts down 5%, AgWest finances 50%, and FSA finances the remaining 45%, which blends into a lower combined rate than either lender would offer alone. A parallel 50-50 joint-financing option exists for buyers who don’t qualify as beginning farmers, splitting the note evenly between AgWest and FSA.
The financing paths above overlap but aren’t interchangeable. This table lines them up by what each one is actually built for:
| Financing Path | Lender Type | Best For | Scale (most recent reported) | Rate Basis |
|---|---|---|---|---|
| USDA FSA Direct | Federal agency | New or underserved farmers, smaller operations | $400,000 (Operating) / $600,000 (Ownership) caps | Fixed FSA rate — 5.250% / 6.000% as of Aug. 2026 |
| USDA FSA Guaranteed | Federal guarantee + private lender | Larger operations needing bank-scale credit | Up to $2,343,000 | Lender-set, FSA caps the maximum |
| AgWest Farm Credit (WA) | Farm Credit cooperative | Ranch real estate, country homes, beginning farmers | $10.8B loan volume, 4,260 WA customers (Dec. 2025) | Cooperative rate plus annual patronage dividend |
| FCS Financial (MO) | Farm Credit cooperative | Franklin County and statewide MO farm/ranch real estate | $13.3B loan volume, 15,502 MO customers (Dec. 2025) | Cooperative rate plus annual patronage dividend |
| WSHFC Beginning Farmer & Rancher | State agency + AgWest | First-time WA farmers and ranchers | Up to $649,400 total ($250,000 + $62,500 sublimits) | Below-market, delivered via Northwest Farm Credit Services |

USDA Loan Limits, Guarantee Caps, and How to Check Current Rates Yourself
FSA does not set one rate a year and leave it — it republishes lending rates monthly, with announcements running through 2026 in January, May, June, and August alone. That means any number on this page has a shelf life measured in weeks, not years. The durable part is the method: FSA posts every update as a dated news release titled “USDA Announces [Month Year] Lending Rates for Agricultural Producers” at fsa.usda.gov’s guaranteed and direct loan pages. Bookmark that page, not this one, if you need a rate that’s accurate to the week you apply.
The guaranteed loan ceiling moves too, but on a slower, published schedule: FSA adjusts the $2,343,000 cap annually each fiscal year based on inflation, and guarantees up to 95% of principal and interest against loss regardless of the exact cap in force. Direct loan caps — $400,000 for Operating, $600,000 for Farm Ownership — change less often but are set by statute, so a Farm Bill reauthorization is the event to watch for a jump rather than a fixed calendar date.
Zoom out and the reason this matters shows up in the debt figures. USDA’s Economic Research Service forecasts total U.S. farm sector debt at $624.7 billion in 2026, up 5.2% from 2025, split between $404.3 billion in real estate debt (up 4.8%) and $220.4 billion in non-real-estate debt (up 6.0%) — figures the agency last updated on May 19, 2026 at ERS’s Assets, Debt, and Wealth page. Real estate debt — the mortgages, land contracts, and Farm Ownership loans this page is mostly about — makes up nearly two-thirds of that total.
Estimate Your FSA-Style Loan Payment
Plug in a loan amount and term against the actual August 2026 FSA rates above to see a monthly payment estimate and whether your request fits inside the program cap.
Run your own numbers
Assumptions: fixed rate, equal monthly payments, no fees. It excludes FSA loan-origination or guarantee fees, private lender closing costs, and below-market blends like WSHFC’s or AgWest’s beginning-farmer structures — confirm exact numbers with your FSA county office or lender before applying.
Where an Agricultural Financing Platform Like Farmonaut Fits In
Farmonaut is a satellite-based agricultural financing platform and farm management company — not a lender itself, but a data layer that feeds the underwriting FSA officers and Farm Credit loan officers already do. It combines multispectral satellite imagery, its Jeevn AI advisory system, and blockchain-based traceability to produce a documented record of crop health, soil moisture, and yield trends over a growing season. That record is exactly the kind of verifiable, dated evidence a loan file benefits from: independent proof of what was planted, how it performed, and how it was managed, standing alongside the tax returns and production history an FSA or Farm Credit application already requires.
Two adjacent pieces worth knowing about if you’re assembling a financing package: renewable energy investments on-farm can affect eligibility for certain conservation-linked loan products, which our solar energy solutions for agriculture guide covers from the financing angle; and carbon or resource-tracking data of the kind Farmonaut generates is increasingly requested alongside conservation-loan applications, not just operating-loan ones.

FAQ
Q: What is Farmonaut?
A: Farmonaut (occasionally mistyped as “Farmanout”) is a satellite-based farm management and agricultural financing platform. It provides real-time crop health monitoring, an AI advisory system called Jeevn AI, blockchain traceability, and fleet/resource management tools — used by farmers directly and referenced by lenders assessing loan applications.
Q: Does Farmonaut make farm loans directly?
A: No. Farmonaut is a data and management platform, not a bank or a Farm Credit institution. Actual lending in Washington State runs through FSA, AgWest Farm Credit, or CoBank; in Washington, Missouri and statewide, it runs through FSA, FCS Financial, or the Missouri Agricultural and Small Business Development Authority.
Q: Can small-scale farmers use this kind of platform to support a loan application?
A: Yes. Farmonaut’s tools scale down to small acreages, and small operators can pair the data with precision farming tools to build the kind of documented production history that supports an FSA microloan or a beginning-farmer application.
Q: Is Farmonaut available in Washington State and Missouri?
A: Farmonaut’s satellite-based tools cover any geography with satellite and internet access, so both states are covered. Feature performance depends on local broadband reliability, which is a separate infrastructure question from loan eligibility.
Q: How often do FSA farm loan rates change?
A: Monthly. FSA issued separate rate announcements in January, May, June, and August of 2026 alone. Always check the current release at fsa.usda.gov before using a rate from any article, including this one.
Earn With Farmonaut
Earn 20% recurring commission with Farmonaut’s affiliate program by sharing your promo code and helping farmers save 10%. Onboard 10 Elite farmers monthly to earn a minimum of $148,000 annually—start now and grow your income!
Explore Farmonaut’s Tools



For developers integrating Farmonaut’s tools into loan-origination or farm-management software, see our API and API Developer Docs.
Discussion
Questions, corrections or field experience? Share them below. First-time comments are reviewed before they appear, and your email is never published.
No comments yet. Be the first to add a question or your experience.

 Fresh Platter
 Andex
Andex FCF India
 Unifrutti Gulf
 Deluxe Conseil
 TVS Electronics
 BW Pipelines
 WICO
WICO Gen Chayat
 Chimera Innovation
 SkyHarvest
 Polaris Digitech
 Teledarbas
 Wild Oak Farm
 SFX
SFX
 Licence holder · Niger · Gold










