Amazon Rainforest Map: 2025 Location & Conservation Guide
Meta Description: Explore the Amazon Rainforest map and location in 2025—discover conservation, sustainable agriculture, biodiversity, and the importance of mapping for protection efforts.
“The Amazon rainforest contains over 390 billion individual trees across more than 16,000 species, making it Earth’s largest biodiversity hotspot.”
Geographical Overview: Amazon Rainforest Map 2025
The Amazon rainforest map, often dubbed the “lungs of the Earth,” is a graphical window into the world’s largest contiguous span of tropical forest. As of 2025, this sprawling ecosystem covers approximately 5.5 million square kilometers (2.1 million square miles), stretching across nine South American countries—Brazil, Peru, Colombia, Venezuela, Ecuador, Bolivia, Guyana, Suriname, and French Guiana. A vital portion (almost 60%) lies within the boundaries of Brazil, underscoring the country’s critical role in Amazon conservation and management.
The Amazon rainforest location map 2025 reveals a landscape situated around the Equator, between the latitudes of approximately 5°N and 15°S. The forest features a dense canopy, extensive river systems (notably the Amazon River, the world’s largest river by volume), and is renowned as an incredible biodiversity hotspot.
- Location: Equatorial South America
- Main Countries: Brazil (60%), Peru (13%), Colombia (10%), plus Venezuela, Ecuador, Bolivia, Guyana, Suriname, French Guiana
- Area: ~5.5 million km²
The Importance of Mapping Amazon Rainforest Locations
With ongoing economic and infrastructure development—including agriculture, forestry, mining, and urban expansion—the 2025 Amazon rainforest map serves as a critical tool for balancing human activities with ecological preservation. High-resolution, precise satellite-based maps enable us to target conservation interventions, manage resources, and monitor the health of habitats.
Biodiversity on the Amazon Rainforest Location Map
As the Amazon rainforest map illustrates, this region—spanning from the Andean foothills in Peru and Ecuador to the floodplains of Brazil—is a repository of global biodiversity:
- Home to over 16,000 tree species and 390 billion individual trees.
- Hosts up to 10% of all known plant and animal species worldwide.
- Vast array of habitats: flooded forests, terra firme forests, rivers, wetlands, and savannas.
- Critical habitat for iconic wildlife: Jaguars, Harpy Eagles, Poison Dart Frogs, Piranhas, Anacondas, Pink River Dolphins, and more.
The biodiversity significance mapped across the Amazon rainforest location map is not just a matter of scientific wonder—it is an ecological cornerstone for climate stability, global hydrological cycles, and the resilience of terrestrial ecosystems. The species interactions, root-soil networks, and riverine corridors mapped within the Amazon help sustain carbon storage, water purification, and resilient food webs.
“In 2025, protected areas and Indigenous lands will cover over 50% of the Amazon, supporting vital conservation and sustainability efforts.”
Mapping Biodiversity Hotspots for 2025 and Beyond
The 2025 Amazon Rainforest map enables scientists and conservationists to:
- Identify priority hotspots for protection and restoration.
- Monitor species movements, migrations, and habitats with real-time data.
- Target interventions in areas facing critical deforestation.
- Locate rare or threatened species populations and design tailored conservation measures.
Amazon Rainforest Map 2025 for Sustainable Agriculture & Forestry
The challenge of 2025 is clear: How do we balance agricultural production and economic growth with sustainable forest management?
Amazon Rainforest Location Map: The Key to Balancing Agriculture & Ecosystems
Detailed maps are fundamental for modern farmers and planners. With precise geospatial data, we can:
- Identify agricultural zones outside of the most sensitive habitats.
- Plan sustainable agroforestry systems that combine trees with crops to support soil health, maintain water systems, and enhance productivity—without degrading the rainforest ecosystem.
- Monitor the results of prior land-use practices, including areas resulted from harmful slash-and-burn agriculture.
Modern management harnesses high-resolution satellite data, empowering targeted and efficient actions for both large-scale farm management and community-scale operations.
Forestry, Deforestation Monitoring & Sustainable Logging
Unsustainable logging is a major driver of forest loss. Here’s how the Amazon rainforest location map in 2025 is central to sustainable forestry:
- Identify legal vs. illegal logging zones with up-to-date satellite imagery.
- Enforce logging quotas to minimize deforestation and safeguard critical habitats.
- Support community forestry operations that maintain forest cover and protect biodiversity.
- Enable sustainable extraction of non-timber forest products (nuts, fruits, medicinal plants) mapped to avoid damaging tree populations or wildlife.
At every step, mapping improves decision-making, ensuring that economic activity remains compatible with long-term rainforest preservation.
Precision Agriculture, Soil Monitoring, and Water Systems
Mapping technology allows farmers and agronomists to:
- Optimize farming practices using NDVI and soil data.
- Reduce fertilizer and pesticide inputs, minimizing runoff into sensitive river systems.
- Maintain water resources and identify areas prone to soil degradation.
- Support sustainable water management for irrigation and climate resilience.
Our satellite-based monitoring tools at Farmonaut empower users to access carbon footprinting and environmental impact tracking, crucial for sustainable land management.
Mapping Agroforestry: Combating Soil Degradation
The movement from traditional slash-and-burn methods to integrated agroforestry in 2025 relies on detailed location maps. This integrated approach, combining trees and crops, is vital for:
- Restoring degraded soils
- Improving food production without further forest loss
- Enhancing biodiversity within agricultural zones
Check out our platform’s use in monitoring transition phases in crop plantation forest advisory operations.
Conservation and Mapping Critical Areas for 2025
The Amazon rainforest map in 2025 is integral to conservation efforts. Real-time maps, remote sensing, and community participatory mapping play a central role in:
- Detecting illegal deforestation and encroachment within protected zones.
- Assessing ecosystem health in vulnerable or at-risk sectors.
- Guiding reforestation projects and habitat corridor design.
- Supporting biodiversity monitoring and wildlife protection.
Types of Protected Areas on the Amazon Rainforest Location Map
- National Parks: Strictly protected for biodiversity and ecosystem services
- Indigenous territories: Managed by Indigenous peoples—crucial for sustainability
- Sustainable use reserves: Allow local, low-impact livelihood activities
- Ecological corridors: Connecting fragmented habitats
These conservation designations are visually evident on any modern Amazon rainforest location map, supporting planners, NGOs, and governments in prioritizing resource allocation and monitoring activities.
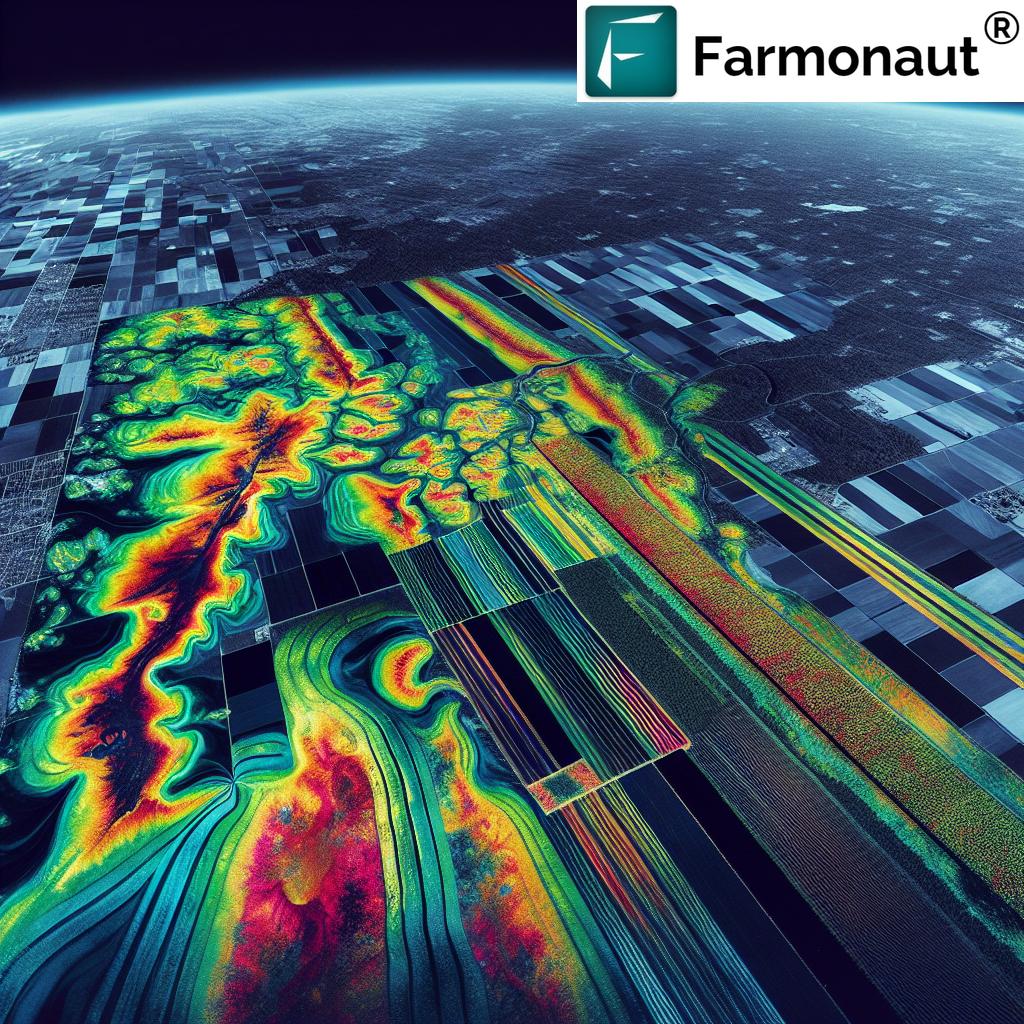
Satellite Mapping: Enhancing Real-Time Conservation in 2025
Thanks to satellite-based monitoring and AI-driven data analysis tools, 2025 brings:
- Immediate detection of unlawful clearing and illicit mining operations
- Enforcement agencies empowered with live deforestation alerts
- Improved coverage of wildlife and ecosystem habitats
- Data-driven approaches to minimize human impacts in the most vulnerable sectors
For research, government oversight, and NGO deployment, using our Farmonaut Satellite Data API and the comprehensive API developer documentation enables seamless integration with conservation systems and dashboards.


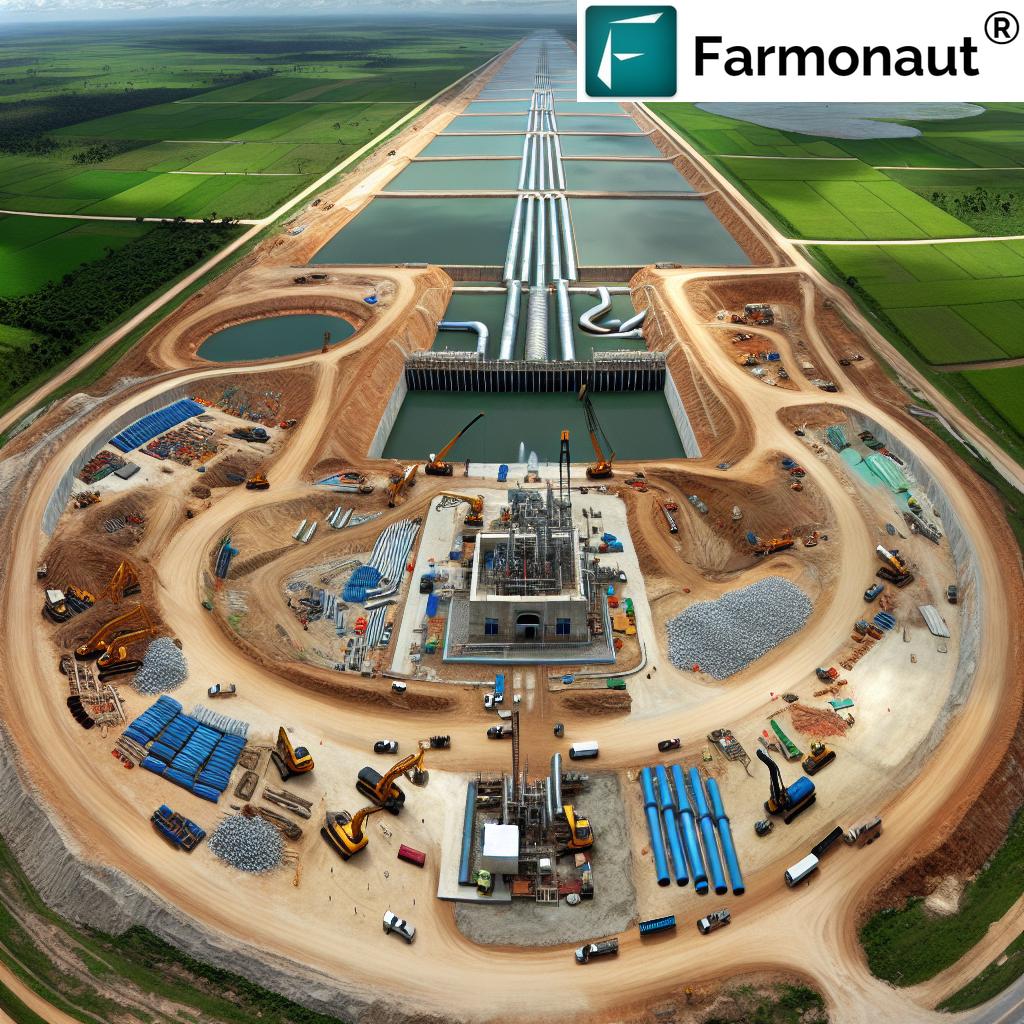
Land Use, Development & Infrastructure Challenges in 2025
As South American countries continue to pursue economic growth and infrastructure development—road construction, mining operations, and new energy projects—the Amazon rainforest location map in 2025 is a mandatory planning instrument.
- Infrastructure projects (highways, railways) can cause fragmentation and introduce invasive species.
- Mining activities threaten areas with pollution and sedimentation.
- New settlements may encroach on critical forest zones.
Before any major project, agencies require an environmental impact assessment tied to precise maps. This assessment identifies river basins, wildlife corridors, and buffer zones—all mapped to minimize habitat disruption.
Our fleet management tools help optimize logistics for sustainable operations across vast, remote rainforest regions, reducing operational footprints and enhancing resource efficiency.
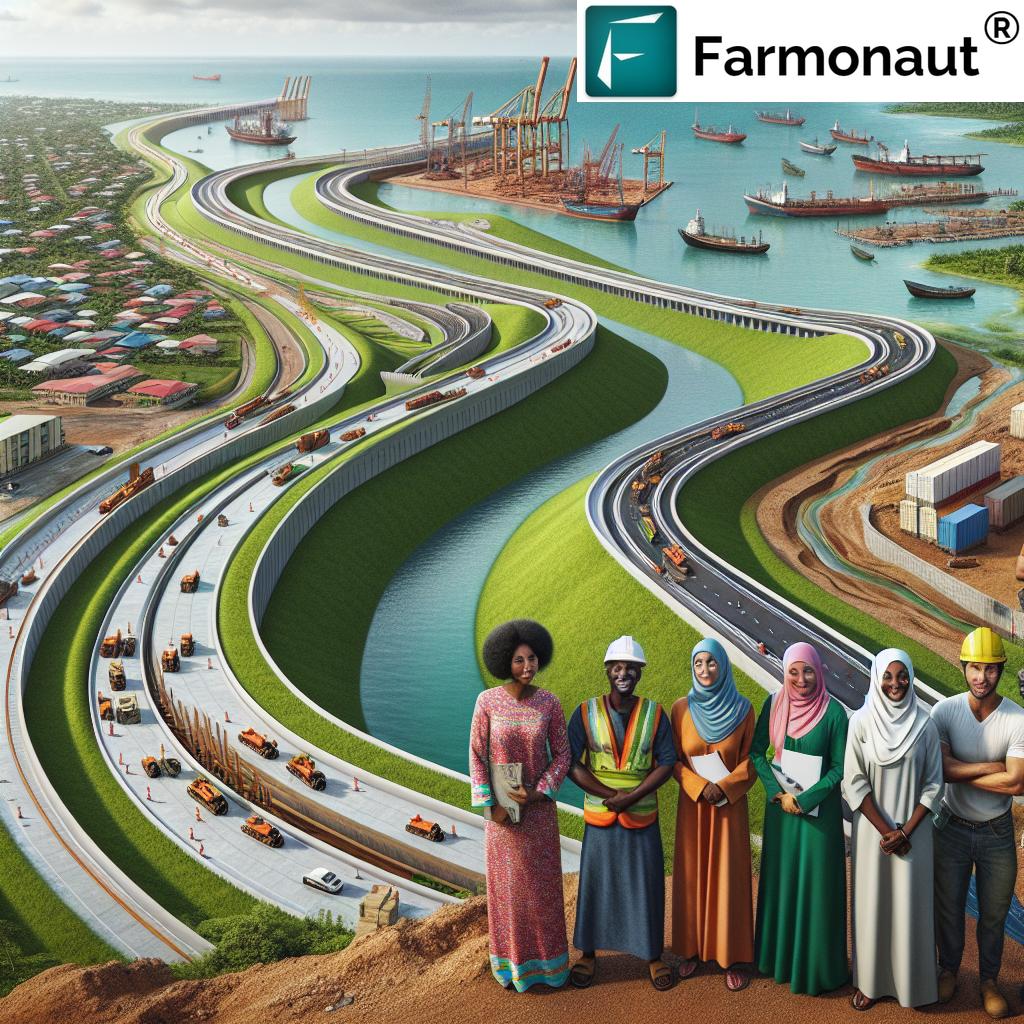
Minimizing Impacts: Mapping Green Development Solutions
- Mapping wildlife corridors for vehicle and animal safety
- Designating ecological buffer zones around sensitive watersheds
- Using satellite imagery to monitor compliance in real time
- Facilitating rapid response to illegal activities or environmental incidents
Adopting Blockchain-Based Traceability and Supply Chain Integrity
In 2025, transparency in Amazon land use is more vital than ever. Our solution for blockchain-based traceability ensures that the origin of agricultural, forestry, and mining products can be traced back to their source, increasing trust and helping enforce sustainability standards across global supply chains.
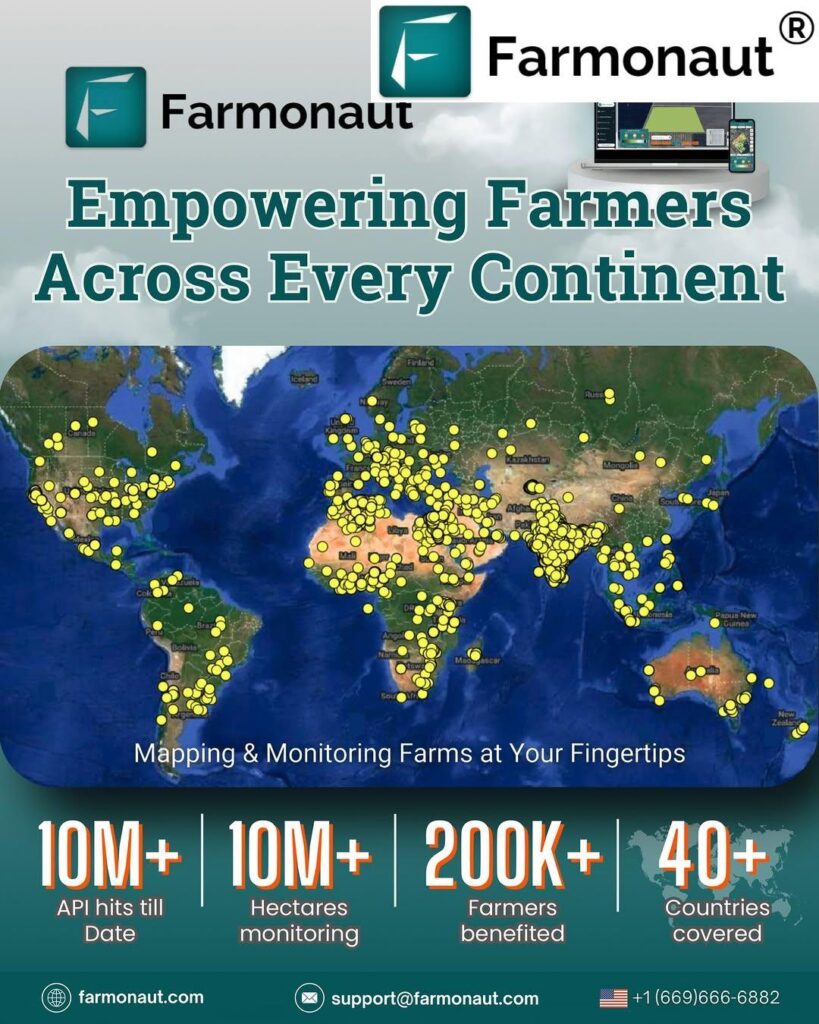
Advanced Tools: Farmonaut & Satellite Solutions
We at Farmonaut empower decision-makers, farmers, conservationists, researchers, and governments with advanced tools tailored to Amazon rainforest map analysis and real-time location intelligence in 2025:
- Real-time satellite monitoring (NDVI, soil moisture, vegetation health) across vast, rugged, and inaccessible rainforest regions.
- AI-driven advisory through our Jeevn AI System, enhancing agriculture, forestry, and mining planning with actionable, personalized data insights.
- Blockchain-enabled product traceability, supporting transparent, fraud-resistant supply chains for Amazon agricultural and resource products.
- Fleet and resource management modules to optimize logistics and boost operational efficiency.
- Environmental impact monitoring, including carbon footprinting that helps businesses and agencies track—and minimize—their environmental impact in Amazon projects.
Accessibility: Our tools are available via web, Android, and iOS apps, as well as API for custom, large-scale integrations.
Subscription Solutions for Diverse Stakeholders
Individuals, enterprises, and governments can subscribe to Farmonaut’s services with flexible, scalable packages. For a direct look at our offerings:
Amazon Rainforest Conservation & Land Use Overview 2025
Below is an at-a-glance table summarizing the major Amazon Rainforest map regions, their estimated size, conservation status, biodiversity highlights, and the most important conservation measures as of 2025.
| Region/Area | Estimated Size (km²) | Conservation Status | Major Biodiversity Highlights | Key Conservation Measures |
|---|---|---|---|---|
| Central Amazon (Brazil) | 1,700,000 | Protected / National Parks | Jaguar, Harpy Eagle, Brazil-nut tree, Pink River Dolphin | Strict park protection, anti-deforestation satellite monitoring |
| Western Amazon (Peru, Ecuador, Colombia) | 950,000 | Partially Protected, At Risk | Poison Dart Frogs, Giant Otter, Mahogany, diverse orchids | Community conservation, Indigenous reserves, sustainable agriculture |
| Southern Amazon (Brazil, Bolivia) | 800,000 | At Risk | Giant Anteater, Tapir, numerous palm species | Agroforestry expansion, restoration, illegal logging prevention |
| Eastern Amazon (Brazil, French Guiana, Suriname, Guyana) | 600,000 | Protected / Mixed Use | Scarlet Macaw, Hardwood trees, rare orchids | Sustainable forestry, buffer zones, eco-tourism initiatives |
| Indigenous Territories (Cross-border) | 1,000,000+ | Protected / Managed | Wide-ranging, includes endemic and culturally significant species | Indigenous rights, participative mapping, traditional management |
| Agricultural Zones (Legal Amazon, Brazil) | 600,000 | Sustainable / At Risk | Agroforestry mosaics, mixed-crop polyculture | Precision agriculture, traceability, satellite monitoring |
Amazon Rainforest Map 2025: Outlook for the Future
Looking beyond 2025, the Amazon rainforest location map remains a pillar of our understanding, conservation, and sustainable management strategies. With continued advances in satellite-based mapping, AI-powered analysis, and data integration, stakeholders can:
- Rapidly respond to illegal deforestation incidents
- Empower local communities and Indigenous groups with mapping tools for stewardship
- Maintain biodiversity and natural carbon sinks to counter climate change
- Integrate sustainable agricultural practices at scale
- Balance human development needs with the Amazon’s critical ecological functions
The future of the world’s largest rainforest depends on integrated mapping approaches, innovative technology, and the will to prioritize both economic development and preservation.
Access Amazon Rainforest Map Insights—Anytime, Anywhere
Whether you’re a policymaker, land manager, conservation scientist, or agricultural professional, using current Amazon rainforest maps and data is essential.
-
Get started with precision monitoring and land management:
Try the Farmonaut Web App -
Develop or integrate custom monitoring systems:
Use the Farmonaut API
Frequently Asked Questions (FAQ)
What is shown on the Amazon rainforest map as of 2025?
The Amazon rainforest map 2025 shows protected areas, Indigenous territories, zones of active agriculture, forestry operations, infrastructure corridors, major river systems, biodiversity hotspots, and regions facing critical deforestation. Modern maps also integrate real-time monitoring via satellite, providing actionable data for resource management and policy-making.
Which countries are part of the Amazon rainforest?
The Amazon rainforest covers nine South American countries: Brazil, Peru, Colombia, Venezuela, Ecuador, Bolivia, Guyana, Suriname, and French Guiana. The majority (about 60%) is in Brazil, with significant tracts in Peru and Colombia.
How does mapping help with Amazon rainforest conservation?
Mapping in 2025 supports conservation by quickly detecting illegal deforestation, guiding land-use planning to balance economic and ecological goals, aiding biodiversity protection, informing restoration efforts, and ensuring that agricultural development can proceed without damaging sensitive habitats. Integration with AI, blockchain, and real-time data makes this process faster and more reliable than ever.
How do Farmonaut’s solutions support Amazon mapping and conservation?
We at Farmonaut offer satellite-based monitoring, AI-powered advisory, blockchain product traceability, real-time deforestation alerts, fleet and resource management, and environmental impact tracking. Our goal is to make advanced location intelligence accessible to all stakeholders working toward sustainable agriculture, forestry, mining, and conservation in the Amazon and similar critical ecosystems.
Why is the Amazon rainforest often called the “lungs of the earth”?
The Amazon’s vast area of living vegetation absorbs and stores enormous amounts of carbon dioxide while producing oxygen, playing a key role in global climate regulation and air quality—hence its nickname as the “lungs of the earth”.
What is the outlook for the Amazon rainforest beyond 2025?
The future will depend on how well we use tools like precise mapping, satellite monitoring, and AI analytics to balance economic development with ecological integrity—protecting biodiversity, water resources, and the carbon functions that are vital to planetary health.
Summary
The Amazon Rainforest is a vital global resource often referred to as the “lungs of the Earth.” Its map and location data are central to understanding regional biodiversity, guiding sustainable agriculture and forestry, and prioritizing conservation across nine South American countries. In 2025 and beyond, advanced satellite-driven mapping, monitoring, and analytical technologies—accessible via platforms such as Farmonaut—empower all stakeholders to strike a balance between development and ecological preservation. Through precise mapping and data-driven insights, we can collectively secure this sprawling, tropical marvel for generations to come.