Understanding NDVI for Water Detection and Monitoring: A Comprehensive Guide
In the realm of remote sensing and precision agriculture, the Normalized Difference Vegetation Index (NDVI) has long been a vital tool for assessing vegetation health and density. However, its applications extend beyond just vegetation analysis. At Farmonaut, we’ve been exploring and implementing innovative ways to use NDVI for water detection and monitoring, providing our users with comprehensive insights into their agricultural landscapes.
What is NDVI and How Does it Relate to Water?
Before we delve into the specifics of NDVI for water detection, let’s refresh our understanding of NDVI itself:
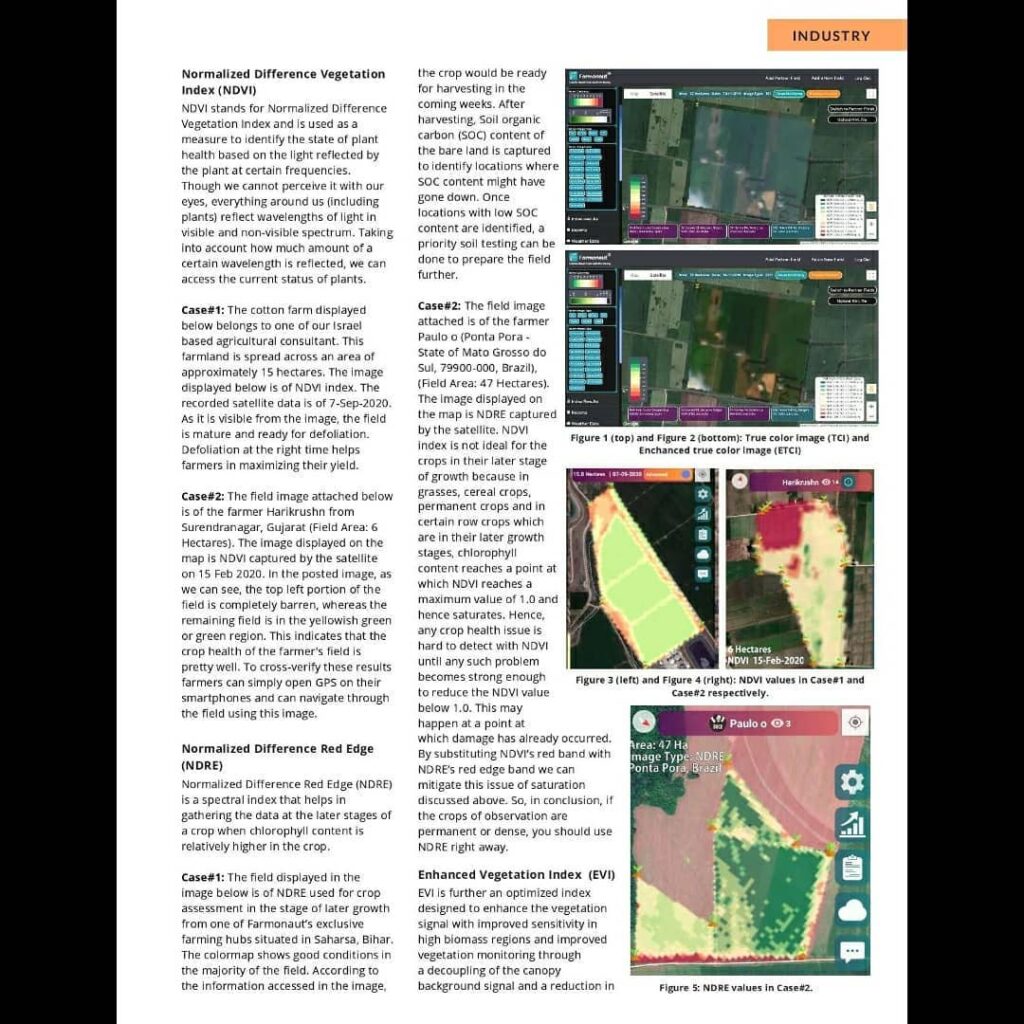
- NDVI is a numerical indicator that uses the visible and near-infrared bands of the electromagnetic spectrum to analyze remote sensing measurements.
- It’s primarily used to assess whether the target being observed contains live green vegetation or not.
- The NDVI formula is: NDVI = (NIR – RED) / (NIR + RED), where NIR is the near-infrared reflection and RED is the red reflection.
When it comes to water, NDVI values behave differently compared to vegetation or soil. This unique behavior allows us to use NDVI for water detection and monitoring.
NDVI Water Values: What You Need to Know
Understanding NDVI water values is crucial for accurate water detection and monitoring. Here’s what we’ve learned through our research and implementation at Farmonaut:
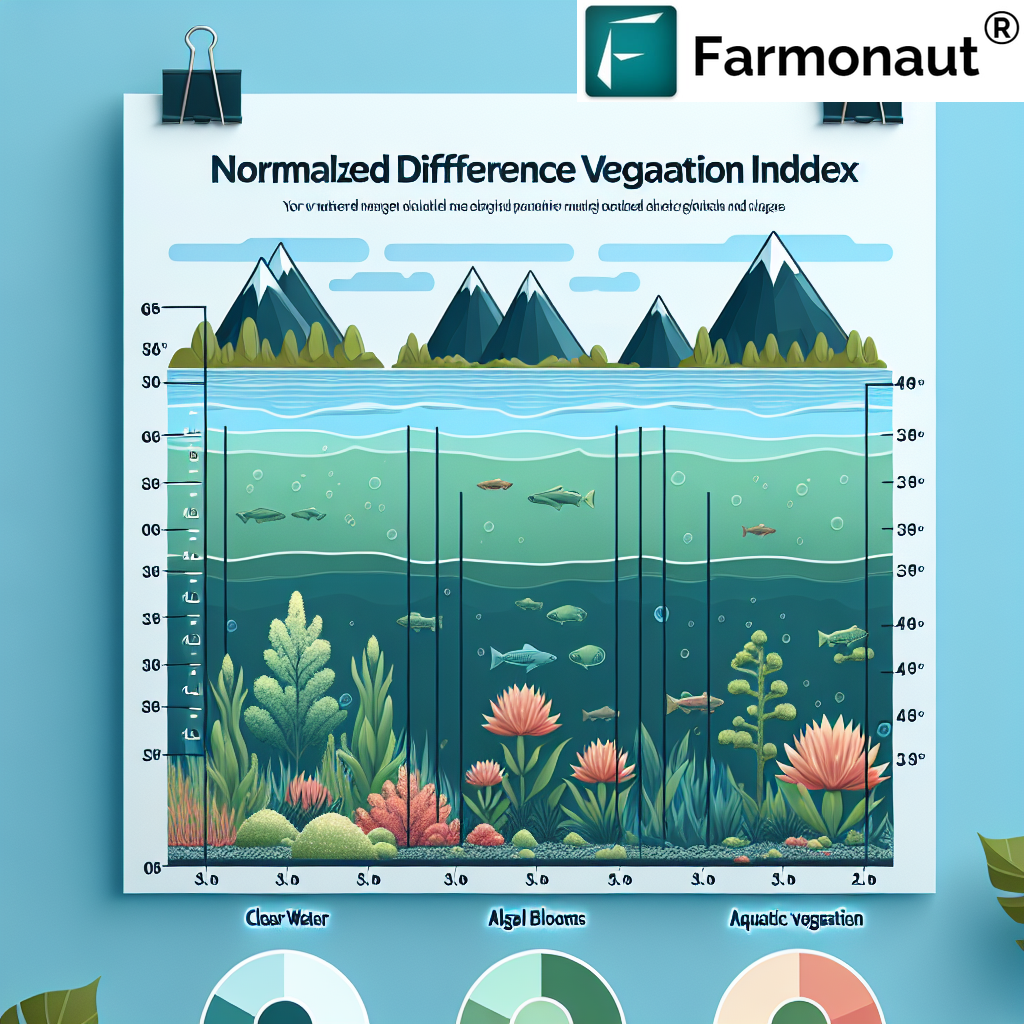
- NDVI of water typically ranges from -1 to 0.
- Clear, deep water bodies usually have very low NDVI values, often close to -1.
- Shallow or turbid water may have slightly higher NDVI values, but they generally remain negative.
- The NDVI water value can vary based on factors such as water depth, turbidity, and the presence of algae or other aquatic vegetation.
How We Use NDVI for Water Detection at Farmonaut
At Farmonaut, we’ve integrated NDVI-based water detection into our satellite-based farm management solutions. Here’s how we utilize NDVI for water detection and monitoring:
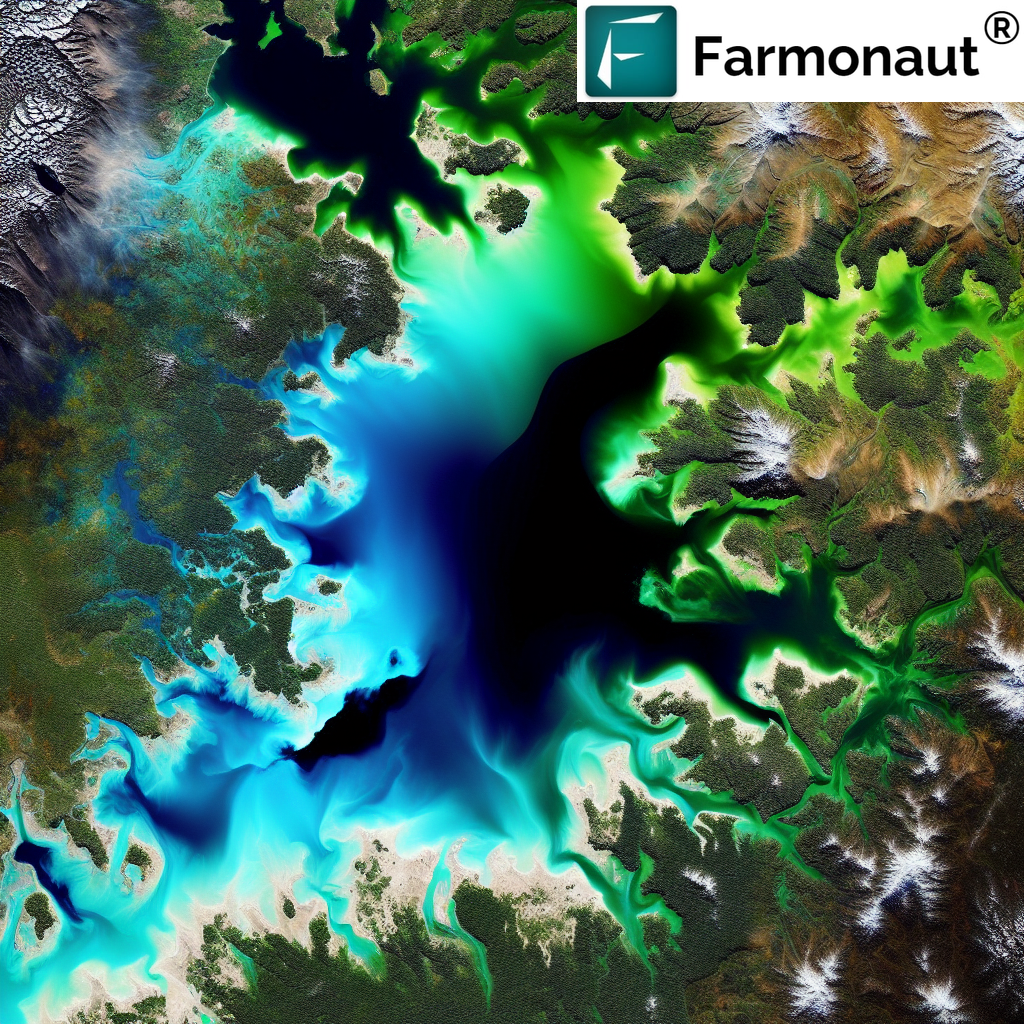
- Satellite Imagery Analysis: We analyze multispectral satellite images to calculate NDVI values across the entire area of interest.
- Water Body Identification: Areas with consistently low NDVI values (typically below 0) are identified as potential water bodies.
- Temporal Analysis: We compare NDVI values over time to detect changes in water extent, which can indicate flooding or drought conditions.
- Integration with Other Indices: We combine NDVI with other water-specific indices like the Normalized Difference Water Index (NDWI) for more accurate results.
- Machine Learning Enhancement: Our AI algorithms learn from historical data to improve water detection accuracy over time.
Benefits of Using NDVI for Water Detection in Agriculture
Implementing NDVI-based water detection in our agricultural solutions offers several benefits to our users:
- Irrigation Management: Farmers can better manage their irrigation systems by identifying areas with excess or insufficient water.
- Flood Monitoring: Early detection of flooding allows for timely interventions to protect crops and infrastructure.
- Drought Assessment: Monitoring changes in water bodies helps in assessing drought conditions and planning appropriate responses.
- Wetland Conservation: Accurate mapping of wetlands aids in conservation efforts and compliance with environmental regulations.
- Water Resource Planning: Understanding water distribution across the landscape supports better long-term water resource management.
Challenges and Limitations of NDVI Water Detection
While NDVI is a powerful tool for water detection, it’s important to acknowledge its limitations:
- Shallow Water: Very shallow water or water with high sediment content may not be accurately detected using NDVI alone.
- Aquatic Vegetation: Dense aquatic vegetation can mask the water signature in NDVI calculations.
- Atmospheric Effects: Cloud cover and atmospheric conditions can affect NDVI calculations, requiring careful data preprocessing.
- Temporal Resolution: The frequency of available satellite imagery may limit the ability to detect rapid changes in water bodies.
At Farmonaut, we address these challenges through a combination of advanced data processing techniques, multi-index analysis, and machine learning algorithms.
Farmonaut’s Approach to Overcoming NDVI Water Detection Limitations
To provide our users with the most accurate and reliable water detection results, we’ve implemented several strategies:
- Multi-Index Analysis: We combine NDVI with other water-specific indices like NDWI and the Modified Normalized Difference Water Index (MNDWI) to improve accuracy.
- Time Series Analysis: By analyzing NDVI data over time, we can detect seasonal patterns and anomalies in water bodies.
- High-Resolution Imagery: We utilize high-resolution satellite imagery to detect even small water bodies and subtle changes in water extent.
- Machine Learning Classification: Our AI algorithms classify land cover types, helping to distinguish between water and other low-NDVI surfaces.
- Ground Truth Validation: We continuously validate our results against ground-based observations to improve our detection algorithms.
Case Studies: NDVI Water Detection in Action
At Farmonaut, we’ve seen numerous examples of how NDVI-based water detection has benefited our users. Here are a few anonymized case studies:
1. Flood Risk Assessment in Rice Paddies
A large-scale rice farmer in Southeast Asia used our NDVI water detection to monitor flood risks during the monsoon season. By tracking changes in NDVI values, they were able to:
- Identify areas prone to flooding before planting
- Implement targeted drainage improvements
- Reduce crop losses by 30% compared to previous years
2. Irrigation Efficiency in Arid Regions
A fruit orchard in a water-scarce region of North Africa implemented our NDVI-based irrigation management system. The results included:
- 20% reduction in water usage
- Improved fruit quality due to optimized irrigation
- Early detection of irrigation system leaks and malfunctions
3. Wetland Conservation Monitoring
An environmental agency used our NDVI water detection to monitor protected wetlands. This allowed them to:
- Track seasonal changes in wetland extent
- Identify unauthorized drainage or land use changes
- Provide data-driven reports for conservation policy-making
The Future of NDVI Water Detection at Farmonaut
As we continue to innovate and improve our technologies, we’re excited about the future possibilities for NDVI-based water detection:
- Integration with IoT Sensors: Combining satellite-based NDVI data with ground-based IoT sensors for even more accurate water monitoring.
- AI-Powered Predictive Analytics: Developing models to predict future water availability based on historical NDVI patterns and climate data.
- Hyperspectral Imaging: Exploring the use of hyperspectral satellite data for more detailed water quality assessment.
- Blockchain-Based Water Rights Management: Utilizing our blockchain technology to create transparent and efficient water rights allocation systems based on NDVI-derived water availability data.
How Farmonaut’s Satellite System Compares to Drone and IoT-Based Monitoring
While drones and IoT devices offer valuable data for farm monitoring, our satellite-based system provides unique advantages. Here’s a comparison:
| Feature | Farmonaut Satellite System | Drone-Based Monitoring | IoT-Based Monitoring |
|---|---|---|---|
| Coverage Area | Large scale (regional to global) | Limited (local) | Very limited (point-based) |
| Frequency of Data Collection | Regular (based on satellite revisit time) | On-demand (requires manual flights) | Continuous (real-time possible) |
| Initial Setup Cost | Low (subscription-based) | High (equipment purchase required) | Medium to High (device installation required) |
| Maintenance | Minimal (managed by Farmonaut) | Regular (equipment maintenance needed) | Regular (device maintenance and battery replacement) |
| Data Processing | Automated (AI-powered) | Often requires manual processing | Automated but limited in scope |
| Scalability | Highly scalable (global coverage) | Limited by equipment and manpower | Scalable but requires significant infrastructure |
| Weather Independence | Moderate (some cloud limitations) | Low (affected by wind and rain) | High (but may be affected by extreme conditions) |
| Historical Data Analysis | Extensive (years of archived data) | Limited (depends on flight history) | Limited to installation period |
Integrating Farmonaut’s NDVI Water Detection into Your Operations
Ready to harness the power of NDVI-based water detection for your agricultural or environmental monitoring needs? Here’s how you can get started with Farmonaut:
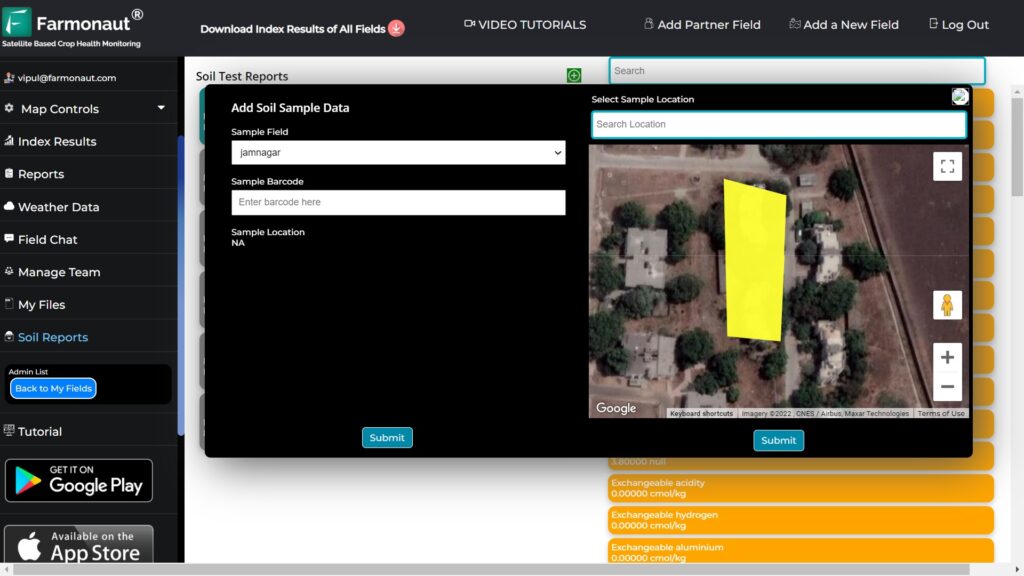
- Sign Up for Farmonaut: Visit our web application or download our mobile app for Android or iOS.
- Define Your Area of Interest: Use our intuitive interface to outline the areas you want to monitor.
- Access NDVI Water Detection Data: Our system will automatically process satellite imagery and provide you with NDVI-based water detection results.
- Integrate with Your Systems: For advanced users, our API allows seamless integration of our data into your existing farm management or GIS systems. Check out our API documentation for more details.
- Receive Alerts and Insights: Set up custom alerts for changes in water bodies, potential flooding, or drought conditions.
Subscription Options
Choose the Farmonaut subscription that best fits your needs:
Frequently Asked Questions (FAQ)
Q: How accurate is NDVI for water detection?
A: NDVI is generally very accurate for detecting large water bodies. However, its accuracy can be affected by factors such as water depth, turbidity, and the presence of aquatic vegetation. At Farmonaut, we combine NDVI with other indices and machine learning techniques to improve accuracy.
Q: Can NDVI detect underground water?
A: NDVI primarily detects surface water. It cannot directly detect underground water. However, it can sometimes indicate the presence of shallow groundwater through its effects on surface vegetation.
Q: How often is the NDVI water data updated?
A: The update frequency depends on the satellite revisit time and cloud cover. Generally, we provide updates every 5-10 days, but this can vary based on your subscription level and location.
Q: Can Farmonaut’s NDVI water detection be used for non-agricultural purposes?
A: Absolutely! While our primary focus is agriculture, our NDVI water detection can be used for various applications, including environmental monitoring, urban planning, and disaster management.
Q: How does Farmonaut handle cloud cover in NDVI calculations?
A: We use advanced cloud masking techniques and time series analysis to minimize the impact of cloud cover on our NDVI calculations. When persistent cloud cover is an issue, we may use radar satellite data as a supplement.
Conclusion
NDVI-based water detection is a powerful tool for agricultural and environmental monitoring. At Farmonaut, we’re committed to providing our users with the most accurate, reliable, and user-friendly water detection solutions. By leveraging the power of satellite imagery, artificial intelligence, and our deep understanding of agricultural needs, we’re helping farmers and environmental managers make better decisions about water resource management.
Whether you’re managing a small farm or overseeing large-scale agricultural operations, our NDVI water detection capabilities can provide valuable insights to improve your water management strategies. Join us at Farmonaut and experience the future of precision agriculture and environmental monitoring.
Ready to get started? Sign up for Farmonaut today and discover how our NDVI water detection can transform your operations!


