

Reviewed September 2026 against USDA NASS (Iowa Crop Production Annual Report) and the Iowa Department of Agriculture’s organic certification program.
Try it: Run your own numbers →
What Crops Are Grown in Iowa: 2024 Yields by the Numbers
What Crops Are Grown in Iowa — the Short Answer
Corn and soybeans dominate Iowa’s cropland. In 2024, Iowa farmers harvested corn for grain on 12.5 million acres at 211.0 bushels per acre, totaling 2.63 billion bushels, and soybeans on 9.96 million acres at 60.0 bushels per acre, totaling 598 million bushels, according to USDA NASS’s Iowa Crop Production Annual Report. Hay — mostly alfalfa — is a distant third, with 3.49 million tons of all hay produced in 2024, of which 2.74 million tons was alfalfa hay.
Beyond those top three, Iowa’s cropland is thin on diversity compared with states that grow wheat, cotton, or specialty vegetables at scale. That concentration matters for the “biological crop inputs” question too: with over 22 million acres split almost entirely between two row crops, Iowa is one of the largest single addressable markets in the country for biologicals aimed at corn and soybean systems specifically.
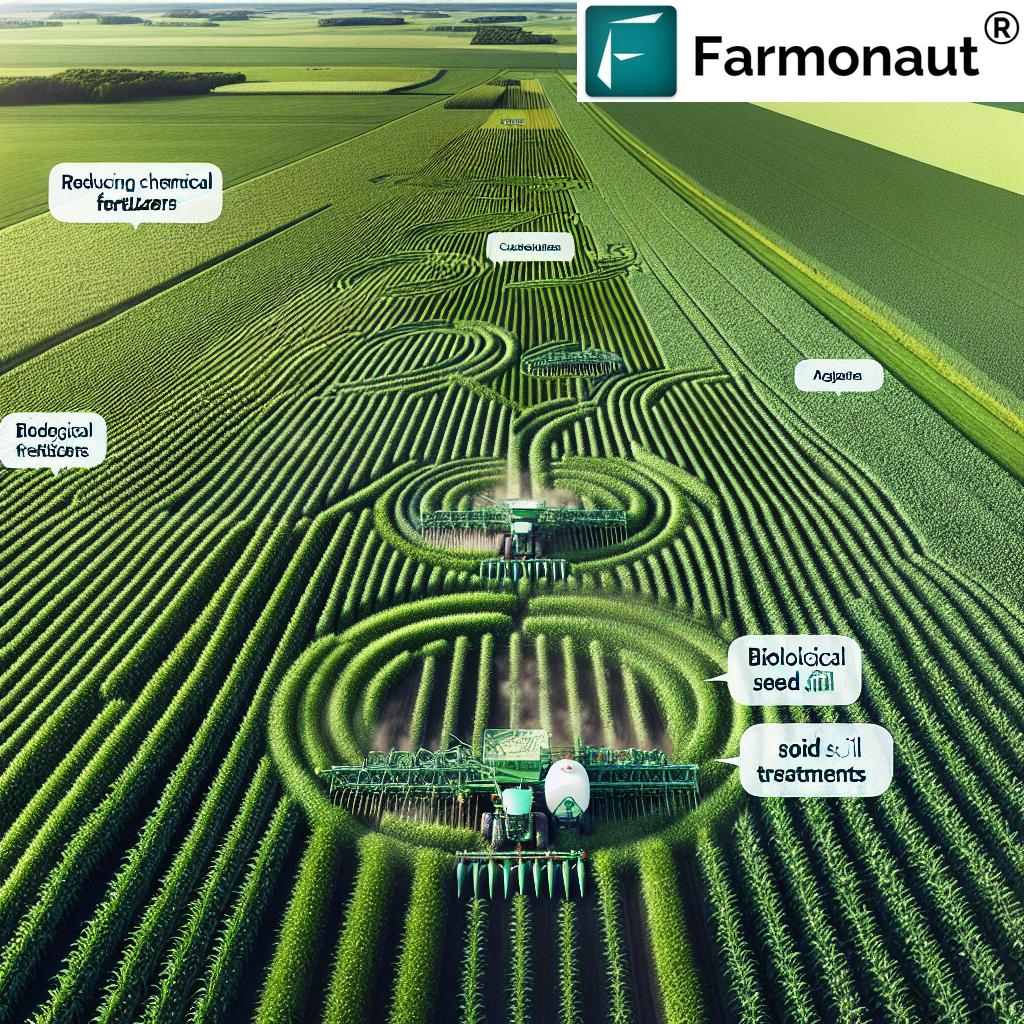

Top Crops in Iowa: Yield, Acreage, Production
Here is the full picture behind “top 5 crops in Iowa,” “top 10 crops in Iowa,” and “iowa top crops” queries, using the same source throughout so the numbers are comparable.
1. Corn for grain
Iowa’s largest crop by far. 2024 harvested area was 12.5 million acres, yield averaged 211.0 bushels per acre, and total production reached 2.63 billion bushels (USDA NASS, 2025 Iowa Crop Production Annual Report). Iowa is consistently the top or near-top corn-producing state in the country by volume.
2. Soybeans
The second row crop in Iowa’s rotation. 2024 harvested area was 9.96 million acres, yield averaged 60.0 bushels per acre, and total production was 598 million bushels (USDA NASS, 2025 Iowa Crop Production Annual Report).
3. Hay (all hay, including alfalfa)
Iowa produced 3.49 million tons of all hay in 2024, with alfalfa hay accounting for 2.74 million tons of that total (USDA NASS, 2025 Iowa Crop Production Annual Report). Hay supports Iowa’s livestock sector and is grown on a fraction of the acreage corn and soybeans occupy.
4–5. What’s not in the USDA NASS Iowa report
USDA NASS’s Iowa Crop Production Annual Report — the same document behind the figures above — does not break out a fourth or fifth row crop for Iowa the way it does corn, soybeans, and hay; wheat acreage in Iowa is minimal enough that it isn’t itemized in this state report the way it would be for Kansas or North Dakota. If you need a specific fourth-crop figure (oats, specialty grains, or vegetables grown at smaller scale in Iowa), the NASS QuickStats database at nass.usda.gov lets you query any commodity by state and year directly — that’s the authoritative source rather than a secondary estimate.
For readers landing on “top 5 crops in Iowa” or “top 10 crops in Iowa” expecting a long list: the honest answer is that Iowa’s cropland is concentrated, not diverse. Corn and soybeans together occupy roughly 22.5 million of Iowa’s approximately 30 million acres of farmland, leaving comparatively little room for a genuine top-5 or top-10 spread the way a state like California would show.
Biological Crop Inputs: Where Iowa Stands
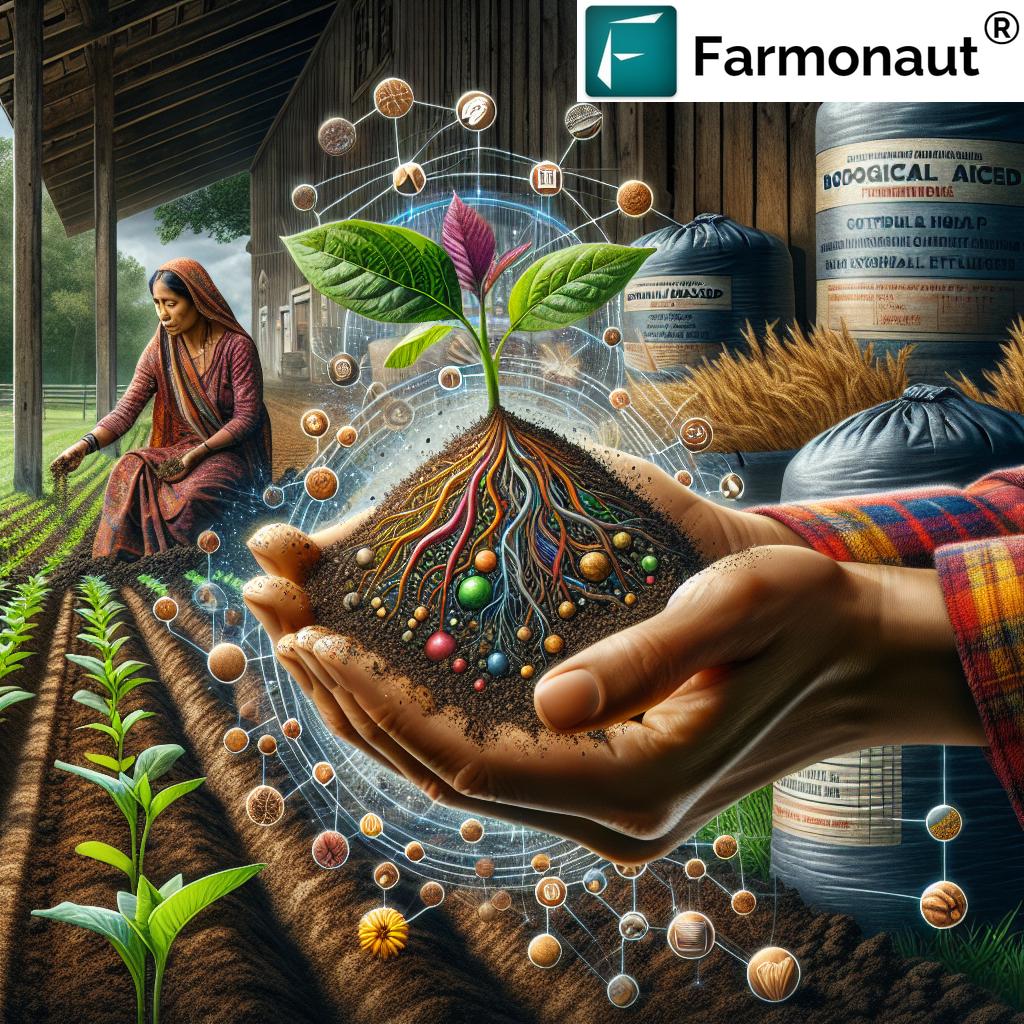
“Biological crop inputs” covers products like microbial inoculants, biofertilizers, and biostimulants — living organisms or their derivatives applied to seed or soil instead of, or alongside, synthetic chemistry. Nationally, 37% of US row-crop producers reported using biological crop products according to CropLife’s 2022 Biologicals Survey. That figure is national, not Iowa-specific — USDA and university extension sources do not publish a separate adoption percentage for Iowa alone, so if you need a state-level number for a specific claim, the closest defensible move is to note the national 37% figure and independently verify with a regional agronomy retailer or extension office rather than assume Iowa mirrors the national rate exactly.
Certified organic production — the strictest, most regulated end of “biological” farming — is well documented for Iowa. As of the 2021 USDA Census of Agriculture, Iowa had 169,000 acres of certified organic cropland across 800 certified organic farms (Iowa Department of Agriculture Organic Certification Program). Set against Iowa’s roughly 30 million total farmland acres, that’s a small share, and it shows up sharply at the crop level: organic corn made up just 0.28% of Iowa’s total corn production and organic soybeans just 0.22% of total soybean production over 2021–2023, per a peer-reviewed study on organic grain adoption in Iowa.
Read those two numbers side by side and the gap for “bio Iowa” searches becomes clear: biological inputs (microbial seed treatments, biofertilizers) are used within conventional row-crop systems at a national rate of 37%, while certified organic production — a separate, stricter regulatory category — remains under 1% of Iowa’s corn and soybean acreage. These are not the same market, and conflating them overstates how much of Iowa is “going organic.”
A durable way to track this yourself: certified organic acreage and farm counts are reported by the Iowa Department of Agriculture’s Organic Certification Program and refreshed against each USDA Census of Agriculture cycle (the census runs every five years), while biological-input adoption rates are tracked by industry surveys like CropLife’s, which are not on a fixed public schedule — check both sources directly before citing a number more than a year or two old.

How Iowa Compares: Wisconsin and Chile
Crops grown in Wisconsin
Wisconsin’s cropland tells a different story than Iowa’s. Where Iowa is overwhelmingly corn-and-soybean row-crop country, Wisconsin’s agriculture is anchored by its dairy industry, which shifts acreage toward forage: corn silage, alfalfa hay, and pasture carry more relative weight in Wisconsin than in Iowa, alongside corn for grain and soybeans. Wisconsin is also a leading cranberry-producing state, a crop Iowa does not grow commercially at any scale. For current Wisconsin-specific acreage and yield figures, USDA NASS publishes a Wisconsin Crop Production Annual Report structured the same way as the Iowa report cited throughout this piece — the same agency, the same report format, comparable numbers.
What crops are grown in Chile
Chile’s crop mix is shaped by its Mediterranean-to-arid climate gradient running the length of the country, and it competes globally in fruit exports rather than row-crop grain. Table grapes, apples, and avocados are major Chilean export crops, alongside wine grapes concentrated in the central valleys. Chile’s counter-seasonal position in the Southern Hemisphere — harvesting when North America is in winter — is a structural reason it exports fresh fruit to US and European markets rather than the corn-soybean commodity trade Iowa is built around. For sourced Chilean production figures, FAO’s statistical database and the World Bank’s agriculture data are the standard references for national-level crop statistics outside the US.
Comparative Table: Iowa’s Crops at a Glance
All figures below are 2024 data from USDA NASS’s Iowa Crop Production Annual Report, the single source used throughout this article so the numbers are directly comparable.
| Crop | Harvested Acreage (2024) | Yield (2024) | Total Production (2024) |
|---|---|---|---|
| Corn for grain | 12.5 million acres | 211.0 bu/acre | 2.63 billion bushels |
| Soybeans | 9.96 million acres | 60.0 bu/acre | 598 million bushels |
| All hay | Not itemized separately | Not itemized separately | 3.49 million tons |
| Alfalfa hay | Not itemized separately | Not itemized separately | 2.74 million tons |
| Certified organic cropland (2021) | 169,000 acres, 800 farms | — | 0.28% of corn / 0.22% of soybean production (2021–2023) |

Biological Input Cost Calculator
Estimate what treating your Iowa corn or soybean acres with a biological input would cost against your own acreage and per-acre price, and see it as a share of the 37% national adoption benchmark for context.
Run your own numbers
Assumes a flat per-acre input cost you supply and does not include application labor, equipment, seed cost, or any yield-response estimate — biological input yield effects are not published at the Iowa state level (see the Biological Crop Inputs section above), so this tool only totals your input spend, it does not forecast a return.

Farmonaut: Monitoring Iowa Fields by Satellite
Whichever mix of corn, soybeans, or biological inputs a farm runs, tracking field-level performance against county and state averages is where satellite monitoring earns its keep. Farmonaut delivers real-time NDVI (Normalized Difference Vegetation Index) maps, soil moisture readings, and stress alerts, letting growers compare their own yield trajectory against the USDA NASS benchmarks cited throughout this article — 211.0 bu/acre corn, 60.0 bu/acre soybeans — at the field level rather than the county level.
Large-Scale Farm Management
Farmonaut Large Scale Farm Management streamlines data analysis and logistical planning across multiple fields, useful for Iowa operations running corn-soybean rotations across thousands of acres and needing to track input costs — including biological treatments — plot by plot.
Carbon Footprinting and Traceability
Farmonaut Carbon Footprinting tracks farm emissions, useful for growers documenting the effect of reduced synthetic fertilizer use when substituting biological inputs. Farmonaut Product Traceability gives buyers and regulators a transparent record of how corn or soybeans moved from field to sale.
Fleet Management and Financial Tools
Fleet Management coordinates machinery across large row-crop operations, while Crop Loan and Insurance Verification helps growers document field conditions for lenders and insurers.
API Access
Developers and research institutions can integrate Farmonaut’s satellite and weather data directly via the Farmonaut API and Developer Docs.
How to Access Farmonaut’s Solutions



Frequently Asked Questions
What crops are grown in Iowa?
Corn for grain and soybeans dominate, at 12.5 million and 9.96 million harvested acres respectively in 2024. Hay, mostly alfalfa, is grown at much smaller scale (USDA NASS, 2025 Iowa Crop Production Annual Report).
What are the top 5 crops in Iowa?
USDA NASS’s Iowa report itemizes three: corn for grain, soybeans, and hay (including alfalfa as a subcategory). It does not publish a fourth or fifth Iowa row crop at comparable detail — for smaller-acreage crops, query USDA NASS QuickStats directly by commodity and state.
What are biological crop inputs?
Biological crop inputs are microbial inoculants, biofertilizers, and biostimulants — living organisms or biology-derived products applied to seed or soil to support nutrient uptake and plant health, used alongside or instead of synthetic fertilizer. CropLife’s 2022 Biologicals Survey found 37% of US row-crop producers had adopted them.
How much of Iowa’s corn and soybean production is organic?
Very little: 0.28% of Iowa corn and 0.22% of Iowa soybean production was certified organic over 2021–2023, against 169,000 certified organic acres across 800 Iowa farms as of the 2021 USDA Census of Agriculture.
How does Farmonaut help Iowa farmers track crop performance?
Farmonaut offers real-time satellite NDVI analytics, AI-powered farm advisory, and blockchain traceability through its apps and API, letting growers compare field-level performance against published state averages like the ones cited throughout this article.
Further reading:
Conclusion
Iowa’s crop story is concentrated, not diverse: corn and soybeans account for the overwhelming majority of its roughly 30 million farmland acres, with 2024 production at 2.63 billion bushels of corn and 598 million bushels of soybeans (USDA NASS). Biological crop inputs sit inside that system at a national adoption rate of 37% among row-crop producers, while certified organic production remains under 1% of Iowa’s corn and soybean output — two different categories worth keeping separate when you’re evaluating either.
USDA NASS republishes Iowa’s crop production report each January for the prior calendar year — check USDA NASS’s Iowa Crop Report page for the current figures before citing these numbers past their vintage.
Ready to track your own fields against these benchmarks? Explore Farmonaut’s Crop Plantation & Forest Advisory, or connect directly via API integration for deeper analytics.

 Raketla
 Polaris Digitech
 Teledarbas
 Wild Oak Farm
 SFX
SFX BACF Africa
 Doodlakine
 Exurbia Geospatial
 FieldZero
 Indico Company
 Kubota
 FFBS
FFBS Jontra
 Tucor
Tucor
