

Reviewed August 2026 against USDA’s Economic Research Service, the U.S. EPA, and market-research trackers Data Bridge Market Research, ResearchAndMarkets and Fortune Business Insights.
Try it: Run your own numbers →
Table of Contents
- Introduction: What “Imaging Technology for Precision Agriculture” Actually Means
- Market Size: Mapping, Imaging and Sensing Systems
- Five Trends Behind the Growth Numbers
- Technology Snapshot: Multispectral, Hyperspectral, LiDAR, Satellite, Seismic
- Deep Dive: Each Imaging Method, and What It Actually Sees
- Calculator: Estimate Your Own Multispectral vs. Hyperspectral Data Load
- Real-World Adoption: What USDA’s Own Farm Data Shows
- Farmonaut’s Role: Making This Imaging Affordable and Accessible
- Challenges and Open Questions
- What Would Change This Picture
- Frequently Asked Questions
- Try it: Run your own numbers
Agricultural Mapping and Imaging Market: Size, Tools, and What the Numbers Actually Show
The agricultural mapping and imaging market was sized at $9.57 billion in 2024 and is projected to reach $24.71 billion by 2032, a 12.58% compound annual growth rate, according to Data Bridge Market Research. A narrower slice — imaging technology built specifically for precision agriculture (multispectral, hyperspectral, LiDAR and thermal cameras) — is separately sized at $596.61 million for 2026, rising to $1.25 billion by 2032 at a 12.96% CAGR, per ResearchAndMarkets. These are different market definitions measuring overlapping but not identical things, which is exactly why so many searches for this topic land on generic pages that blur the two together.
This page treats them as separate, sources every figure to the firm that published it, and then goes further than a market-size roundup: it covers what multispectral and hyperspectral cameras physically capture, where seismic and other geophysical methods fit into “agricultural imaging” (a smaller, subsurface-focused corner of the field most market reports skip), and what USDA’s own farm survey data — not a market forecaster’s model — says about how many U.S. farms actually use any of this.

Market Size: Agricultural Mapping, Imaging and Sensing Systems
“Agricultural mapping and imaging market,” “imaging technology for precision agriculture market,” and “hyperspectral imaging in agriculture market” are three distinct research categories with three distinct price tags. None of them is wrong — they’re scoped differently, and conflating them is how a lot of coverage of this space ends up vague. The table below lines them up side by side.
| Market segment | Base year value | Forecast value | CAGR | Source |
|---|---|---|---|---|
| Agricultural mapping & imaging (broad) | $9.57B (2024) | $24.71B (2032) | 12.58% | Data Bridge Market Research |
| Imaging technology for precision agriculture | $596.61M (2026) | $1.25B (2032) | 12.96% | ResearchAndMarkets |
| Imaging technologies for precision agriculture (earlier estimate, overall market) | $631M (2022, crop-monitoring segment) | $1.238B (2028, crop-monitoring); $1.691B (2028, overall) | 11.3% | Businesswire / ResearchAndMarkets |
| Hyperspectral imaging in agriculture | $970.29M (2025) | $2.868B (2034) | 12.8% | Fortune Business Insights |
The overlap across firms and vintages is normal for market research — each report draws its own boundary around what counts as “imaging,” which platforms it includes, and which years it treats as historical versus forecast. What’s consistent across all four is the direction: double-digit CAGRs in the 11–13% range, driven by the same underlying forces — cheaper sensors, cloud processing, and farms substituting data collection for manual scouting.
Each line’s own base-to-forecast span; slopes are illustrative, not on a shared dollar axis. Source: Data Bridge Market Research (2025 report); ResearchAndMarkets (2026 listing); Fortune Business Insights (2026 listing).
Five Trends Behind the Growth Numbers
Every one of the market forecasts above is built on the same underlying shifts. None of these is new in the sense of appearing this year — they’re multi-year structural changes still working through the industry:
- Multispectral and hyperspectral sensor costs keep dropping, pulling imaging down from research-station budgets to individual farm operations.
- Drone-based monitoring has become routine on row-crop and specialty farms, not just a demo at a trade show.
- AI models now do the interpretation that used to require an agronomist reading raw spectral output by eye.
- Satellite revisit rates have shortened, so field-scale monitoring no longer waits weeks for a clear pass.
- Subsurface geophysical methods — including seismic imaging — are being tested as a complement to canopy-level optical imaging, for questions optical sensors can’t answer, like soil compaction depth.
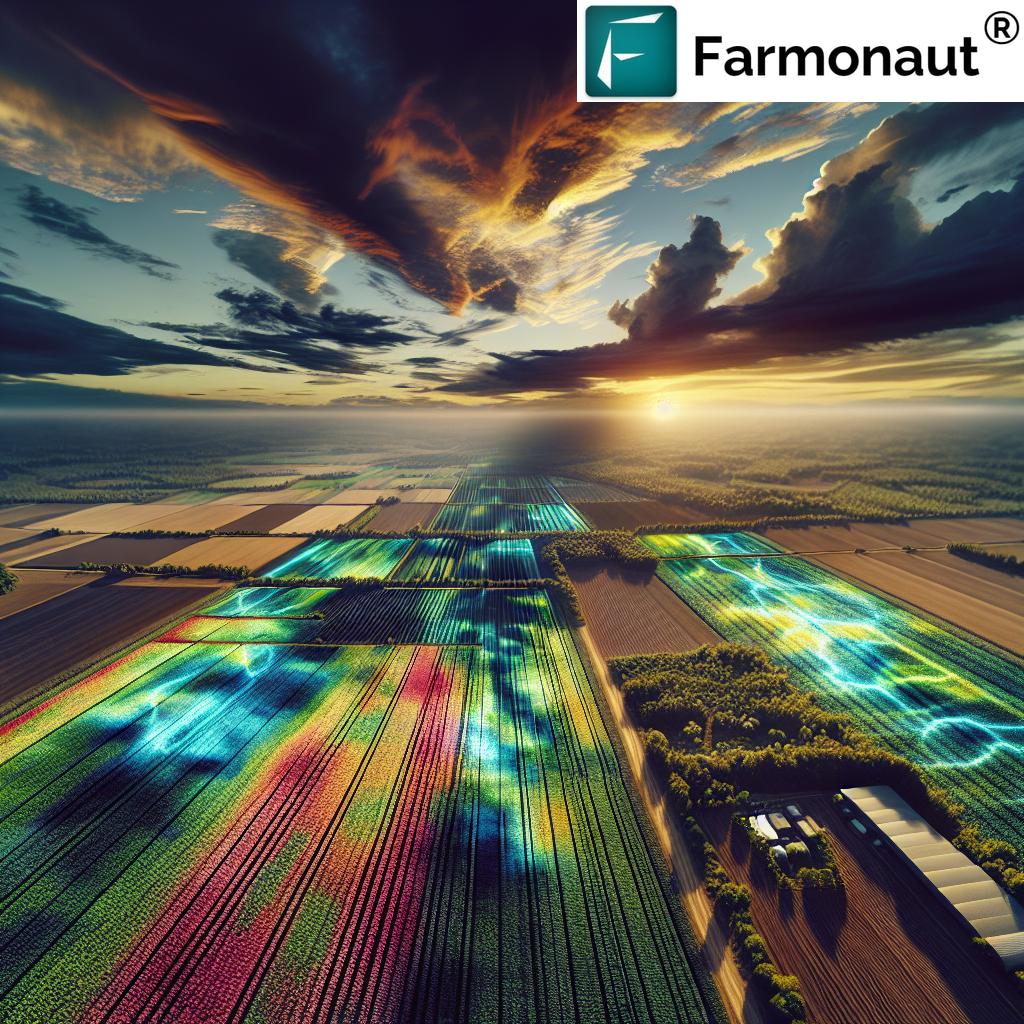



Technology Snapshot: Multispectral, Hyperspectral, LiDAR, Satellite and Seismic Imaging
Rather than assign each technology an invented “adoption percentage” — most aren’t tracked as standalone categories by any government survey — this table compares what each method physically measures, at what scale, and states plainly where a real U.S. adoption figure does or doesn’t exist.
| Technology | What it physically measures | Typical spatial scale | Adoption figure available? |
|---|---|---|---|
| Multispectral imaging | Reflectance in ~4–10 discrete bands, usually including near-infrared, for indices like NDVI | Field to farm (drone or satellite) | Not tracked alone; folded into ResearchAndMarkets’ “Imaging Technology for Precision Agriculture” segment |
| Hyperspectral imaging | Reflectance across hundreds of narrow, contiguous bands | Plot to field | Market share tracked (North America = 36% of a $970.29M 2025 global market, per Fortune Business Insights) |
| LiDAR | 3D point clouds from laser time-of-flight, giving canopy height and terrain elevation | Field to farm | Tracked as a technology-type segment by ResearchAndMarkets; no standalone U.S. farm-count figure published |
| Satellite imaging | Multispectral reflectance at fixed revisit intervals, no flight required | Field to national | USDA ERS tracks related practices (yield/soil maps) but not satellite imagery use specifically — see the adoption section below |
| Seismic / geophysical imaging | Elastic-wave travel time and reflection, revealing subsurface density, compaction and layering | Point survey lines, tens to ~80m deep | No adoption figure exists — it remains a specialty survey method, not a row-crop monitoring practice (see below) |
Deep Dive: Each Imaging Method, and What It Actually Sees
1. Multispectral and Hyperspectral Imaging in Agriculture
Multispectral imaging captures reflected light across a handful of discrete bands — typically red, green, blue, red-edge and near-infrared — and combines them into indices like NDVI to flag chlorophyll loss, water stress or nutrient deficiency before it’s visible to a person walking the field. Hyperspectral imaging does the same job with far more resolution: hundreds of narrow, contiguous spectral bands instead of a handful of discrete ones, which is why Fortune Business Insights tracks it as its own $970.29 million (2025) global market rather than folding it into general multispectral figures. That market is forecast to reach $2.868 billion by 2034 at a 12.8% CAGR, with North America holding a 36% share as of the firm’s 2026 report — the largest single region.
The practical trade-off is cost versus granularity. A near-infrared camera suitable for multispectral crop imaging costs about $5,000, according to University of Illinois Extension researchers testing lower-cost alternatives; they found that training an AI model to generate NDVI-like output from a standard RGB camera on a roughly $600 drone can approximate the more expensive sensor’s output for some applications. Hyperspectral sensors sit well above the $5,000 NIR-camera price point and are still concentrated in research institutions and specialty crop operations rather than general row-crop use — a gap that shows up directly in the adoption data further down this page.
Calculator: Estimate Your Own Multispectral vs. Hyperspectral Data Load
Band count is the single biggest reason hyperspectral imaging generates so much more data than multispectral imaging for the same field — use the fields below to see how much raw data your own acreage would produce at each resolution and band count before you commit to a storage or bandwidth plan.
Run your own numbers
Assumes uncompressed raw pixel data only (no on-board compression, geotagging, or overlap between flight passes) — real captured file sizes will differ, usually lower after compression. This estimates raw sensor output, not storage cost or transfer time.
2. Drone Technology and Multispectral Cameras: Eyes in the Sky
Drones carrying multispectral cameras cover a field in minutes rather than the hours a walked survey takes, and they fly under the cloud layer that can delay a satellite pass for days. The camera hardware, as noted above, remains the main cost barrier: a dedicated NIR/multispectral sensor payload runs about $5,000, which is why University of Illinois Extension researchers have been testing whether AI-generated NDVI approximations from a standard RGB camera on a low-cost drone can close that gap for smaller operations.
- Map field-scale areas with spatially precise, geotagged imagery in a single flight
- Assess plant density, moisture stress and early pest or disease signs at a resolution satellites can't match
- Feed directly into variable rate fertilizer application maps
Drone-based monitoring is spreading well beyond large operations as camera and airframe prices fall, but flight-time limits and FAA Part 107 rules still cap how much acreage one drone can cover in a day, which is part of why satellite imaging remains the default for anything beyond a few hundred acres.
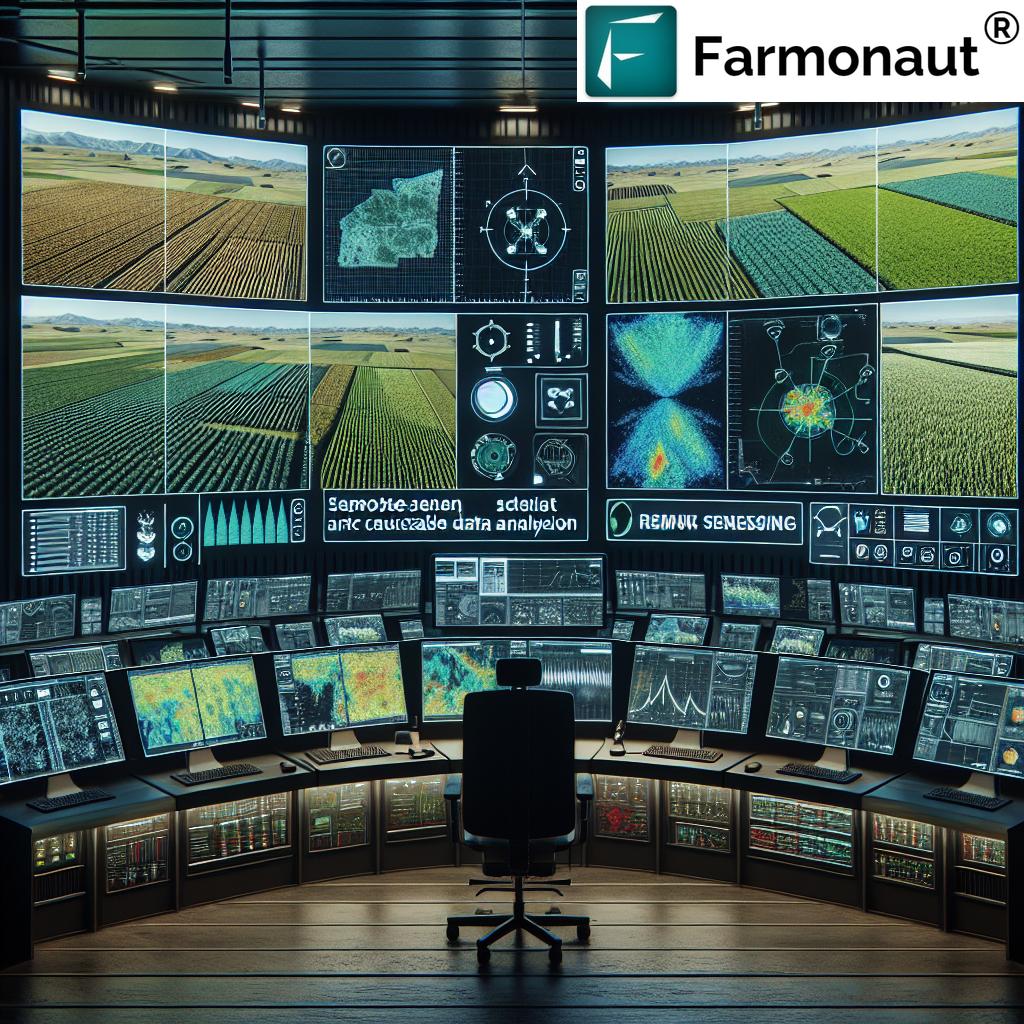
3. LiDAR: 3D Structure Instead of Spectral Color
LiDAR works on an entirely different principle from multispectral or hyperspectral imaging — it doesn't read color or reflectance at all. It fires laser pulses and times their return to build a 3D point cloud of canopy height, plant structure and ground elevation. ResearchAndMarkets tracks LiDAR as one of its four core technology-type segments (alongside hyperspectral, multispectral and thermal) inside the imaging-technology-for-precision-agriculture market, but no government agency publishes a standalone U.S. farm-adoption figure for it — it remains concentrated in land-leveling, drainage design and forestry-scale biomass work rather than routine crop scouting.
4. Seismic and Geophysical Imaging: What's Happening Below the Root Zone
This is the technology most likely to have brought a search engine here without matching what the rest of this page covers, and it deserves an honest answer rather than a forced fit. Seismic imaging is a geophysical technique, not an optical one: according to the U.S. EPA's environmental geophysics guidance, it works by sending sound waves into the ground from a source and recording their reflections off subsurface layers with a line of geophones, then converting travel time into depth. EPA case studies cited on that page reached stratigraphic detail to about 80 meters deep in one survey and detected bedrock at about 32 meters in another — far below anything an optical camera, drone or satellite can see.
In agriculture specifically, this sits inside a discipline called agrogeophysics — the application of geophysical methods (ground-penetrating radar, electrical resistivity imaging, and seismic surveying) to soil rather than to oil, gas or groundwater exploration. Researchers at the University of Padova's Department of Geosciences describe agrogeophysics as investigating soil water content, composition and salinity in ways optical remote sensing can't reach, because those methods measure what's under the surface, not what's reflected off it.
There is no published adoption rate for seismic imaging on U.S. farms, and that's not an oversight on this page's part — it's an honest gap. Seismic and other geophysical soil surveys remain a research and specialty land-improvement tool (compaction mapping, drainage design, bedrock depth for irrigation planning) rather than a row-crop monitoring practice tracked by USDA or any market-research firm covering precision agriculture. If your interest in "seismic imaging technology" is about oil, gas or geotechnical surveying rather than soil, the EPA page linked above is the right starting point — it covers the general subsurface technique, independent of the agricultural application discussed here.
5. Satellite Imaging: The No-Flight Option
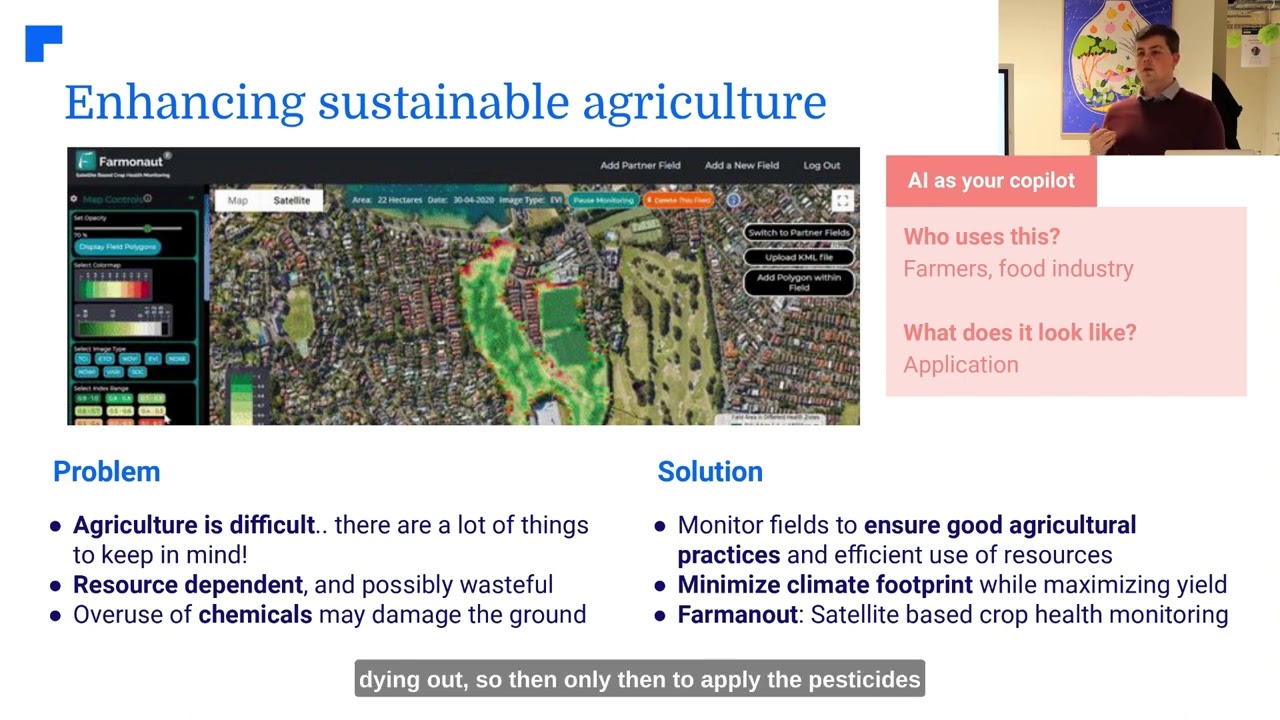
Satellite imaging trades the resolution of a drone flight for coverage and cost: no aircraft, no flight-time cap, and a fixed revisit schedule instead of a scheduled flight. It's the practical default for whole-farm and multi-farm monitoring, and it's what underlies Farmonaut's approach — pulling multispectral satellite data on a recurring basis without requiring a farm to own any imaging hardware at all.
Satellite missions matter here too, and the guide to remote sensing uses in agriculture covers them more fully. Satellite images can also compare fields over time, a use explained in satellite imagery for field comparisons.
- Tracks crop condition and biophysical change across a whole operation on one interface
- Feeds insurance and lending verification without a site visit
- Scales from a single field to a multi-state operation without added hardware cost
6. AI-Powered Analysis: Turning Spectral Data Into a Decision
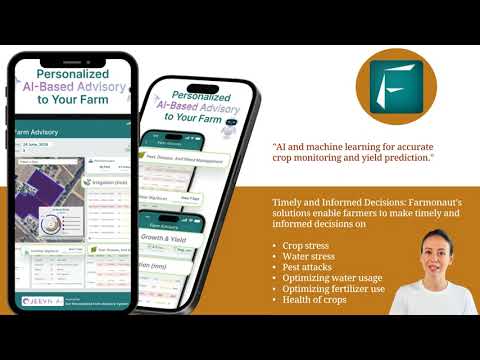
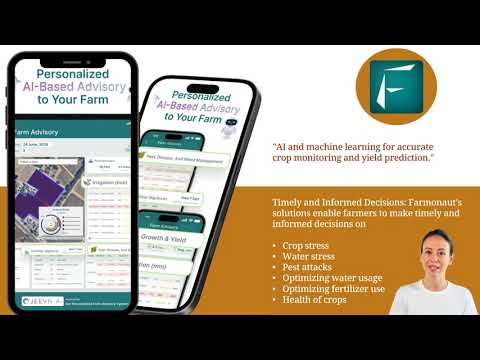
None of the imaging methods above are useful on their own without something to interpret the output — a multispectral or hyperspectral capture is a grid of numbers until a model turns it into "this zone needs nitrogen" or "this block is under water stress." That interpretation layer is what Farmonaut's Jeevn AI advisory and comparable platforms provide: combining satellite, and where available drone, imagery into a recommendation rather than a raw dataset a farmer has to read manually.
Real-World Adoption: What USDA's Own Farm Data Shows
Market-size forecasts describe revenue potential. They don't tell you how many actual U.S. farms use any of this today. For that, USDA's Economic Research Service (ERS) runs the Agricultural Resource Management Survey (ARMS), and its most recent chart-of-note breakdown — based on 2023 data — is the closest thing to a real adoption number this space has.
- Guidance autosteering systems: used on 52% of midsize crop farms and 70% of large-scale crop farms in 2023.
- Yield monitors, yield maps and soil maps combined: used on 68% of large-scale crop farms in 2023.
- Automated guidance broadly: adopted on well over 50% of acreage planted to corn, cotton, rice, sorghum, soybeans and winter wheat, per ERS's longer 1996–2019 adoption study.
- Yield maps, soil maps and variable rate technology specifically: adopted on only 5–25% of total planted acreage for winter wheat, cotton, sorghum and rice, per the same ERS study — a meaningfully lower rate than guidance systems.
Note what's absent from ERS's own categories: there is no separate published U.S. adoption rate for "satellite imaging," "multispectral imaging" or "hyperspectral imaging" as such — ERS tracks the downstream practices (yield maps, soil maps, VRT, guidance) rather than which sensor produced the underlying data. That's the honest state of the evidence: strong data on outcome-level precision-ag practices, no government figure on which imaging technology sits behind them. To get a current figure, ERS republishes ARMS-based adoption charts on its Charts of Note page and in full in its Precision Agriculture in the Digital Era report — check either for the latest release.
For developers: integrate satellite and weather data directly into your own applications via the Farmonaut Satellite & Weather API and its Developer Docs.
Farmonaut's Role: Making This Imaging Affordable, Accessible and Scalable
Every technology above has the same adoption barrier in the USDA data: cost and complexity scale adoption up with farm size. Farmonaut's model is built to flatten that curve by delivering the imaging output — not the hardware — as a subscription.
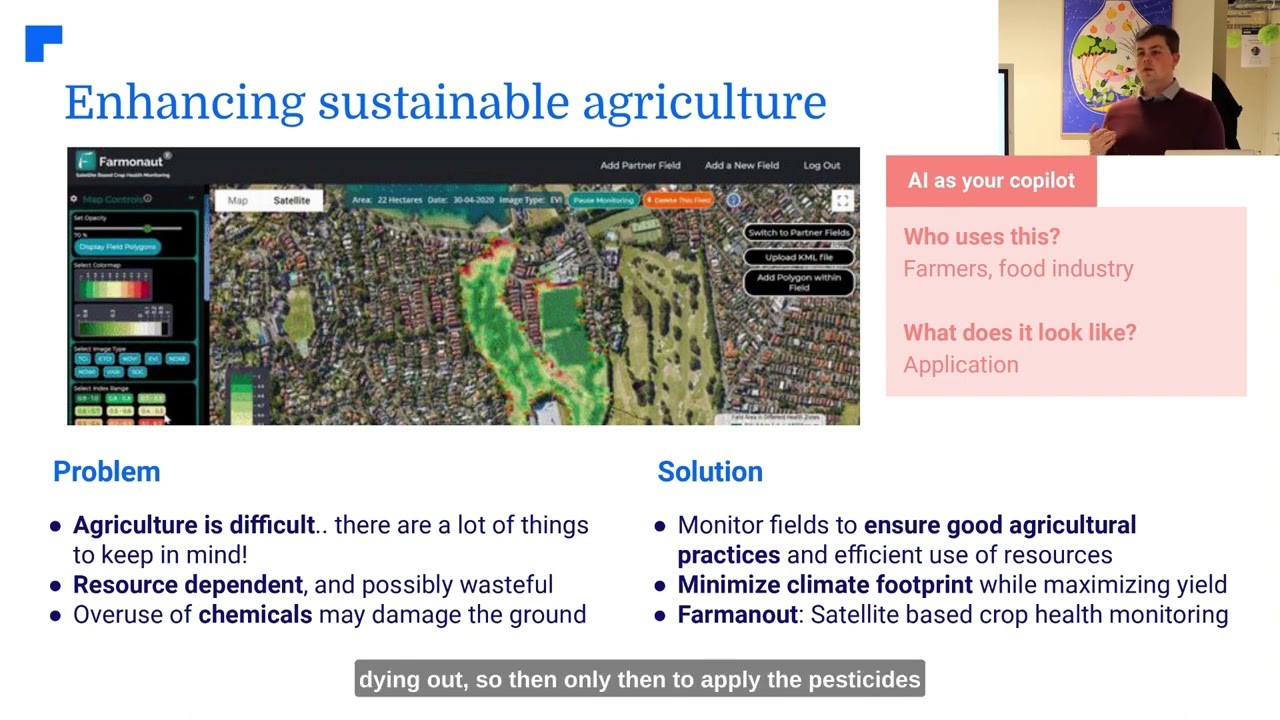
- Satellite-Based Crop Health Monitoring: Real-time multispectral satellite imagery with NDVI, soil moisture and plant-health status, with no drone, camera or sensor purchase required.
- AI Advisory: Jeevn AI turns imagery and weather data into management recommendations, supporting yield decisions without requiring the user to read spectral output directly.
- Fleet Management: Track machinery and plan routes alongside crop monitoring. See fleet management details.
- Blockchain-Based Traceability: Document where produce came from, for supply-chain transparency. Learn about product traceability.
- Carbon Footprinting: Track and report emissions alongside imagery-based monitoring. Explore carbon footprinting.
- Crop Loan & Insurance Verification: Satellite-based field verification for lenders and insurers. See how this works.
- Large-Scale and Plantation Management: The same imaging pipeline scales to forestry and large plantations. See large-scale management tools.

Challenges and Open Questions
Cost still tracks farm size
The ERS data above is unambiguous: adoption climbs with farm size across every category measured. A $5,000 multispectral sensor or a hyperspectral rig is a rounding error on a large operation's budget and a real barrier on a small one. Subscription-based imaging (no owned hardware) is the direct response to that gap, not a marketing angle.
Data privacy and ownership
Field-level imagery and yield data raise ownership questions once they leave the farm's own systems. Blockchain-based audit trails, like Farmonaut's traceability tooling, are one way to make custody of that data auditable rather than opaque.
Drone regulation
Commercial drone operation in the U.S. falls under FAA Part 107, which caps altitude, requires line-of-sight operation in most cases, and restricts flights near airports and in certain airspace classes. That regulatory ceiling — not sensor cost alone — is part of why satellite imaging remains the practical option for anything beyond field-scale monitoring.
Interpreting the output
A hyperspectral cube or a raw NDVI layer is not self-explanatory. The gap between capturing spectral data and acting on it is exactly what the AI-advisory layer discussed above exists to close — without it, the ERS adoption numbers for yield and soil maps would likely be lower, not higher.
What Would Change This Picture
The market forecasts cited above (through 2032–2034) assume continued CAGRs in the 11–13% range. What would move that number: a step change in sensor manufacturing cost (the kind University of Illinois researchers are testing with AI-generated NDVI substitutes), a shift in FAA drone rules that expands beyond-visual-line-of-sight operation, or a new USDA ARMS survey cycle that finally breaks out imaging-technology adoption as its own tracked category rather than folding it into yield/soil-map figures. None of those has happened as of this review; each is worth checking the linked USDA and market-research sources for directly, since all three would move faster than an annual rewrite of this page.
For further reading on resource efficiency alongside imaging adoption, see this guide to sustainable resource stewardship.
Frequently Asked Questions
What's the actual size of the agricultural mapping and imaging market?
Data Bridge Market Research puts it at $9.57 billion in 2024, growing to $24.71 billion by 2032 at a 12.58% CAGR. A narrower "imaging technology for precision agriculture" segment is sized separately at $596.61 million (2026) to $1.25 billion (2032) by ResearchAndMarkets — check both sources directly for the current release, since market reports are periodically re-issued with new base years.
What's the difference between multispectral and hyperspectral imaging in agriculture?
Multispectral captures a handful of discrete bands (commonly 4–10, including near-infrared) and is the basis for NDVI. Hyperspectral captures hundreds of narrow, contiguous bands, giving far more spectral detail at a higher sensor cost — tracked as its own $970.29 million (2025) market by Fortune Business Insights.
Does "seismic imaging technology" have anything to do with farming?
Only at the margins. Seismic imaging is a subsurface geophysical technique — used mainly for oil, gas, groundwater and geotechnical surveying — that has a small research application in agrogeophysics for mapping soil compaction and bedrock depth. It is not a row-crop monitoring tool, and no adoption figure for it exists in agriculture.
How many U.S. farms actually use precision imaging technology?
USDA ERS doesn't publish a single figure for "imaging" as such, but its 2023 ARMS data shows 70% of large-scale crop farms and 52% of midsize farms use guidance autosteering, and 68% of large-scale crop farms use yield monitors, yield maps or soil maps combined.
What does a multispectral camera for agriculture cost?
A dedicated near-infrared/multispectral sensor runs about $5,000, per University of Illinois Extension researchers, who are testing whether a standard RGB camera on a roughly $600 drone, paired with an AI model trained to approximate NDVI, can substitute for some applications.
How does Farmonaut make this accessible without buying hardware?
Farmonaut delivers satellite-based multispectral imagery and AI advisory through web, Android and iOS apps or API, on a subscription basis — no drone, camera or sensor purchase required. Get started here.
Where can I get the current USDA adoption figures directly?
USDA ERS's Charts of Note and its full Precision Agriculture in the Digital Era report are both refiled as new ARMS survey cycles complete — check either directly for numbers newer than this review.


Further reading:
Conclusion: Three Markets, One Set of Real Numbers
"Agricultural mapping and imaging," "imaging technology for precision agriculture" and "hyperspectral imaging in agriculture" are three separately sized markets ($9.57B→$24.71B, $596.6M→$1.25B, and $970.3M→$2.868B respectively, per the firms cited above) growing at similar double-digit rates for the same underlying reasons: cheaper sensors, better AI interpretation, and farms substituting imagery for manual scouting. Seismic and other geophysical methods sit at the edge of that picture — genuinely part of "agricultural imaging" in the broadest sense, but a subsurface research tool rather than a mainstream monitoring practice. What USDA's own ARMS survey shows is the adoption reality behind the forecasts: strong uptake of guidance and mapping practices on large farms, a persistent gap on smaller ones, and no separate government tracking yet for which sensor technology sits behind the data.
See how Farmonaut applies this imaging without requiring you to buy any of the hardware above.

 Blue BearX
 Insignito
 Croptimum
 Dalmia Bharat Sugar
 DnCubed
 Pistachio ST
 Field Capacity
 Indosistim Teknologi
 Liquify Digital
 CU Foods
 BeyondTech Global
 Rouge VC
 AgroGreen Dynamics
 AgroRisk
 Oath Inc
 Reddane Farming
 Esri North East Africa
 Cresol
 MDCV UK
