

Field crops · Yield measurement guide
Crop Cut in Agriculture: Methods, Formula and Examples
A crop cut harvests and weighs the crop from a small plot of known size, then scales the weight up to a per-hectare or per-acre yield. Here is the formula, how USDA and university agronomists sample fields, and when satellites help.
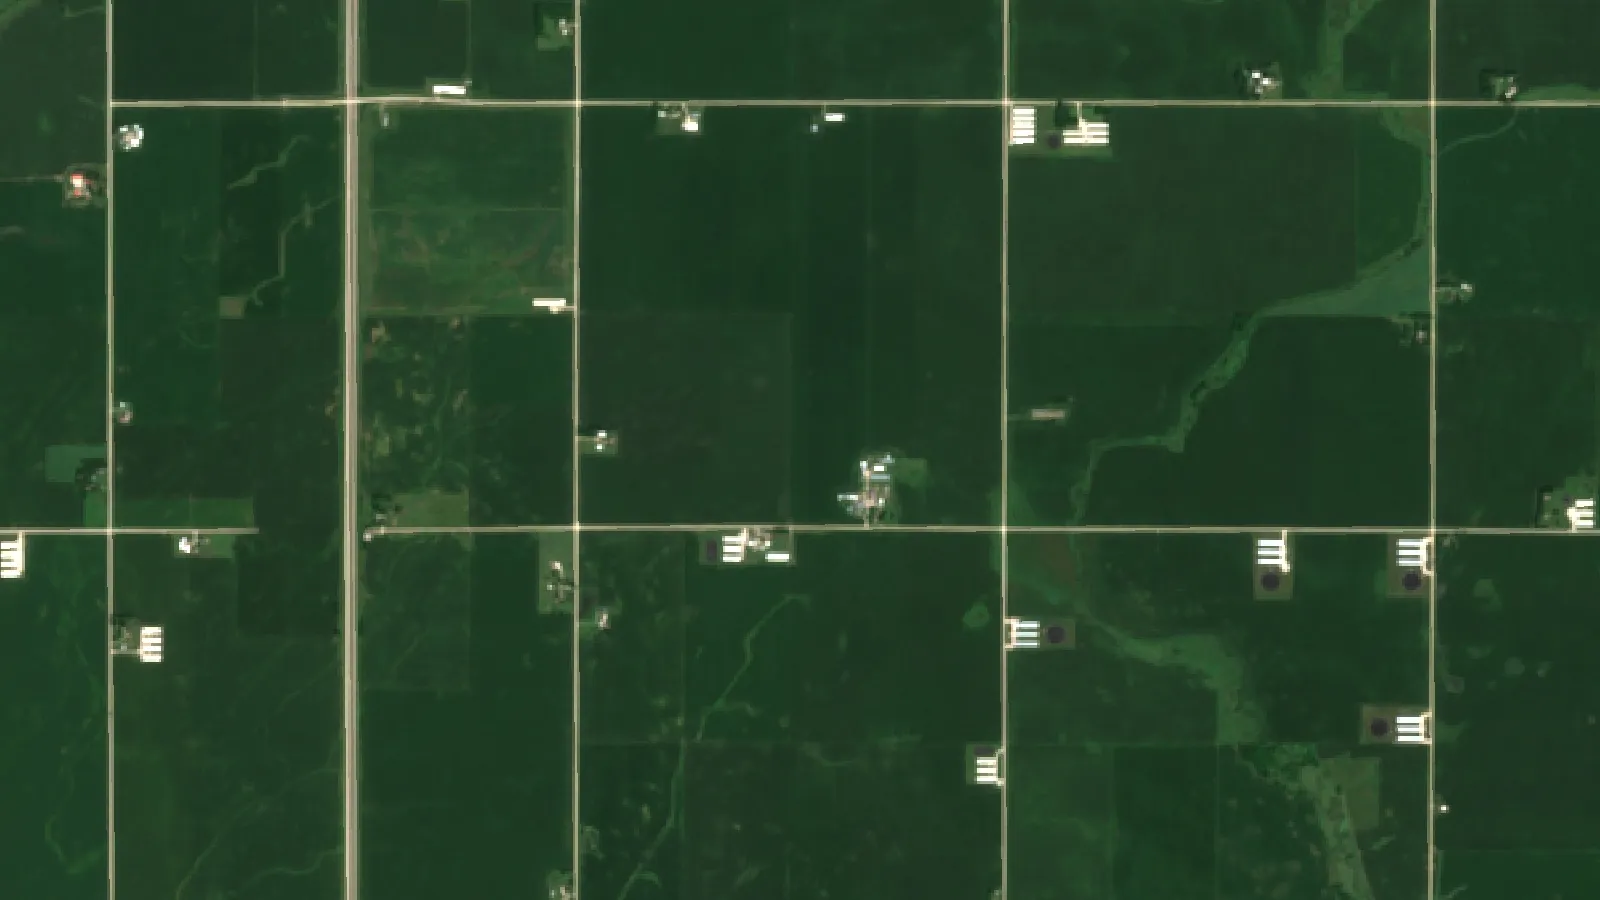
Key takeaways
- A crop cut weighs the harvest from a measured plot and scales it up: kg per plot ÷ plot area in m² × 10 = tonnes per hectare, before moisture adjustment.
- Purdue’s corn method counts ears in 1/1000 acre of row (17.4 ft at 30-inch rows); one worked site gives 180 to 236 bu/acre depending on kernel weight.
- USDA NASS combines a farmer survey with objective plant counts in two random plots per sampled field; its October 2026 US corn forecast was 181.2 bu/acre.
- In a World Bank and Stanford study in Uganda, farmer recall explained under 1% of crop-cut yield variance, while satellite yields captured about half on plots over 0.1 ha.
- Sentinel-2 images fields every 5 days at the Equator at 10 m pixels, so satellite maps show where to place crop cuts, not a replacement for them.
In this article
- What is a crop cut?
- The crop cut formula
- How to run a crop cut, step by step
- Corn: the yield component method
- Wheat and small grains: head counts
- How USDA estimates crop yields
- Crop cuts vs farmer estimates vs satellites
- Other yield estimation methods
- Using satellite maps to place crop cuts
- Common mistakes and how to avoid them
- Where crop cut data is used
- Limits of crop cutting
- FAQ
A crop cut in agriculture means harvesting all of the crop from a small plot of known size, then weighing it and scaling the weight up to a yield per hectare or per acre. If a 20 m² plot gives 18 kg of grain, the field is yielding about 9 tonnes per hectare before any moisture adjustment. Governments, crop insurers, researchers and farmers use crop cuts because they measure real grain rather than a guess.
This guide gives the formula, the step-by-step field method, the quick count methods that university agronomists use for corn and wheat, and how USDA mixes plot counts with farmer surveys. It also shows what a large field study found when it compared crop cuts with farmer estimates and satellite data, and gives a calculator that turns your plot weight into a moisture-adjusted yield and margin.
What is a crop cut?
A crop cut, also called a crop cutting experiment, is a sample harvest. You mark out a plot, cut every plant inside it, thresh and clean the grain, weigh it, test its moisture and then convert the result to a full-field yield. The method is old and simple, and that is its strength: the number comes from grain on a scale.
Crop cuts serve several groups:
- Farmers and agronomists use them to check a field before harvest, to compare hybrids or varieties, and to judge whether a treatment paid off.
- Crop insurers and adjusters use sample harvests and plant counts to appraise a damaged crop before it is destroyed or replanted. For insurance and loan questions, see our page on crop loan and insurance tools, and always follow your policy’s own loss procedures.
- Statistics agencies use objective plot measurements to check what farmers report.
- Researchers use crop cuts as the “ground truth” against which they test satellite and model estimates.
Crop cut figures also feed into wider policy. Farm support payments in the United States lean on yield records, which our guide to US farm subsidies by state explains.
The crop cut formula
The core calculation has three parts: scale the plot weight to area, then adjust for moisture.
1. Wet yield. Tonnes per hectare = grain weight in kg ÷ plot area in m² × 10. One hectare holds 10,000 m², and 1,000 kg make a tonne, so the factor is 10. A 5 m × 4 m plot (20 m²) that gives 18 kg yields 18 ÷ 20 × 10 = 9.0 t/ha wet.
2. Moisture adjustment. Grain is sold at a standard moisture. Dry-basis yield = wet yield × (100 − moisture at weighing) ÷ (100 − standard moisture). At 20% moisture and a 14% standard: 9.0 × 80 ÷ 86 = 8.37 t/ha.
3. Field total. Multiply by the field area. A 40 ha field at 8.37 t/ha would hold about 335 tonnes, less any harvest losses.
In US units, bushels per acre = pounds harvested ÷ plot area in acres ÷ standard weight per bushel (56 lb for shelled corn, 60 lb for wheat and soybeans). Check the standard moisture your buyer uses, since it differs by crop and market.
The formula holds at any plot size: a 10 m × 10 m plot that gives 12 kg works out to 12 ÷ 100 × 10 = 1.2 t/ha.
Try the numbers for your own farm below.
Calculator
Crop cut yield and margin calculator
Enter your plot size, harvested weight and moisture. Results are per hectare.
- Plot area: 20.0 m²
- Wet yield: 9.00 t/ha
- Gross value (US$): 1,758 US$/ha
- Margin over growing cost (US$): 8 US$/ha
Example values only, set near break-even; they are not a benchmark or a forecast. Use your own plot weights, today’s price and your own costs. Yield is adjusted to the standard moisture you enter (for example 15.5% for US corn, 13.5% for wheat). One plot is not enough: average at least five well-spread plots.
How to run a crop cut, step by step
- Split the field into zones. Most fields are not uniform. Note strong, average and weak areas from yield maps, soil maps or satellite crop health maps.
- Pick plot sites at random within each zone. Pacing a set number of steps from a random starting point avoids the habit of walking to the best-looking plants. Stay well away from headlands, field edges and wheel tracks.
- Measure the plot exactly. Use a tape and pegs, or a fixed frame. A 10 cm error on each side of a 2 m square changes the area by about 10%.
- Harvest everything inside. Cut plants rooted inside the boundary only. Bag and label each plot.
- Thresh, clean and weigh. Remove soil, weeds and chaff. Use a scale accurate to at least 10 g for small plots.
- Test moisture. Use a grain moisture meter on a cleaned sub-sample straight away, or dry a sub-sample to constant weight.
- Calculate and average. Work out yield for each plot, then average within each zone and weight the zones by their area.
How many plots? Nebraska Extension asks for at least five sites per field. The Purdue guide warns that crop uniformity affects the accuracy of any yield method, and that less uniform fields need more samples.
Corn: the yield component method
For corn you can estimate yield weeks before harvest without threshing anything. The Purdue University corn yield component guide counts ears and kernels and then divides by a kernel-weight factor.
- Measure a length of row equal to 1/1000 acre. For 30-inch rows that is 17.4 feet. For other spacings, divide 43,560 by the row width in feet, then divide by 1,000.
- Count the harvestable ears in that length.
- On every fifth ear, count kernel rows and kernels per row, then average kernels per ear.
- Yield in bu/acre = ears × kernels per ear ÷ a kernel-weight factor.
The factor stands in for kernel weight, which cannot be known until the grain matures. Purdue suggests running the sum with factors of 65, 75 and 85 to get a range. Its worked example uses 30 ears and 511 kernels per ear, giving 236, 204 or 180 bu/acre. Purdue notes that kernel counts per 56-lb bushel can vary by 20,000 or more from year to year for the same hybrid because of grain-fill weather.
Chart
One corn sampling site, three kernel-weight assumptions
Estimated bu/acre for 30 ears × 511 kernels per ear, divided by a kernel-weight factor of 65, 75 or 85
Wheat and small grains: head counts
For wheat, barley and oats the count method works on heads and kernels. The Nebraska Extension guide G1429 gives this formula: bu/acre = (heads per foot of row × kernels per head) ÷ row spacing in inches × 0.48.
Nebraska advises counting at least 5 feet of row at five or more sites, and counting kernels on at least five heads per site. It notes that winter wheat there averages about 22 kernels per head, and that this number should be adjusted down in a stressed crop. The Penn State Extension small grain guide splits kernel counts into spikelets per head (often 6 to 12) and kernels per spikelet (often 2 to 3), counting only spikelets with two or more kernels.
Example: 30 heads per foot × 22 kernels ÷ 7.5-inch rows × 0.48 gives about 42 bu/acre. These counts are a fast pre-harvest check. A true crop cut, threshed and weighed, is still more reliable for a final figure, because kernel size is assumed rather than measured.
How USDA estimates crop yields
The United States is a good model of how crop cutting and surveys work together. USDA’s National Agricultural Statistics Service (NASS) runs two kinds of survey.
The first asks growers. The NASS Agricultural Yield Survey page says farmers report acreage and expected yield, and the same operators are contacted each month to update their figures. Sample sizes range from 5,500 farmers in June to 27,000 in August, mostly by telephone.
The second measures plants. In the Objective Yield Survey, enumerators lay out plots in randomly chosen fields. The farmdoc daily review of USDA forecasting methods (University of Illinois, 2015) describes a sample of 1,920 corn fields and 1,835 soybean fields, with two random plots per field. Crews count stalks and ears in corn and plants, pods and beans in soybeans. Late in the season they harvest the plot, weigh the grain and record its moisture, and they also gather harvest losses from the ground.
The October 2026 Crop Production report put the US corn yield forecast at 181.2 bushels per acre, up 2.7 bushels from the previous forecast. For context, the Crop Production 2025 Summary listed a record 186.5 bushels per acre for 2025, against 179.3 in 2024. NASS publishes its final figure after harvest, based on a large December survey of producers.
Early forecasts often move. A farmdoc daily analysis of corn forecasts from 2014 discussed the trade view that big crops “get bigger” after the August forecast, and looked at how forecast errors have changed over time. The lesson for a farm is the same: an early count gives a range, and the scale at harvest gives the answer. For a state-by-state view of corn yields, see our page on average corn yield per acre by state.
Chart
US average corn yield
Bushels per acre; 2024 and 2025 are final estimates, 2026 is the 1 October forecast
Crop cuts vs farmer estimates vs satellites
How good are crop cuts compared with other methods? A World Bank study of maize plots in Uganda, run with Stanford researchers and the national statistics office, gives a rare side-by-side test.
Chart
How much of measured maize yield each method explained
Approximate share of variance in harvested yields, maize plots in eastern Uganda (World Bank and Stanford study)
Teams set an 8 m × 8 m sub-plot at random on each plot and later harvested, dried and weighed it. About half the plots, 211 in all, were also harvested in full and weighed, giving a full-plot yield. Researchers then compared four measures: farmer recall, the sub-plot crop cut, the full-plot harvest and satellite estimates.
The findings:
- Farmer recall explained less than 1% of the variation in crop-cut yields.
- Sub-plot and full-plot yields were linked, but only moderately (correlation r = 0.5). Yield varies a lot even inside a small plot, which is why one cut is never enough.
- Satellite yields, calibrated or not, captured about half of the variation in full-plot yields on pure-stand plots larger than 0.1 ha.
The study was in smallholder maize, so the exact numbers will differ on large mechanised farms. The broader point carries over: memory is weak, a single small cut is noisy, and satellites add useful coverage when ground samples anchor them.
Other yield estimation methods
Crop cutting is one of several ways to estimate yield. The table compares the main ones.
| Method | What it measures | Best use | Main limit |
|---|---|---|---|
| Crop cut (sample harvest) | Grain weight from a measured plot | Ground truth, insurance checks, trials | Labour; one plot may not represent the field |
| Yield component counts | Ears, heads and kernels | Pre-harvest estimates in corn and wheat | Kernel weight is assumed |
| Farmer or survey estimate | Grower’s expected yield | Fast regional forecasts | Recall bias |
| Combine yield monitor | Grain flow across the whole field | Whole-field maps at harvest | Needs calibration; only after harvest |
| Satellite imagery | Canopy greenness and growth over time | Zoning fields, tracking change, large areas | Clouds; needs ground samples to convert to yield |
| Drone imagery | High-detail canopy and stand counts | Plant counts, trial plots | Flight time and processing per field |
| Crop models | Weather, soil and management simulated | Scenarios and forecasts | Needs good local inputs |
Yield monitors on combines record grain flow every few seconds and build a full-field map. They need regular calibration against weighed loads, which is a form of crop cut at scale.
Drones carry RGB or multispectral cameras and can count plants and map stand gaps in detail. They suit trial plots and smaller fields.
Crop models simulate growth from weather, soil and management. They work best when farm-level samples are used to tune them.
Machine learning combines imagery, weather and past yields. It is only as good as the measured yields used to train it, which again come from crop cuts, weigh wagons and calibrated monitors.

▶ An overview of satellites, AI and drones in farming, and how they help growers plan harvests. · 13:27
Using satellite maps to place crop cuts
The most practical way to combine methods on a farm is to let satellite maps decide where to sample. The Copernicus Sentinel-2 mission page says the twin satellites revisit every 5 days at the Equator, with four bands at 10 m resolution. That is enough to show strong and weak zones within a field across a season.
A simple routine:
- About two to four weeks before harvest, look at a recent crop health map (for example an NDVI map) for each field.
- Split each field into high, medium and low zones.
- Place at least two crop cuts or count sites in each zone.
- Weight each zone’s average yield by its share of the field area.
- After harvest, compare your estimate with the weighed total and note how far apart they were for next year.
This keeps sampling honest. Without a map, it is easy to sample the middle of the field, which is often its best part. Farmonaut Satellite + AI Farm Monitoring System provides this kind of satellite crop health map for each field you draw, on the web and on phones.

▶ A walk-through of satellite crop health maps on the Farmonaut web app, useful for picking strong, average and weak zones to sample. · 8:43
Common mistakes and how to avoid them
- Sampling only good-looking spots. Fix: choose sites by pacing from a random start, within zones.
- Plot area errors. Fix: use a rigid frame or measure both sides twice.
- Ignoring moisture. Fix: always adjust to the standard moisture your buyer pays on.
- Too few plots. Fix: at least five per field, more where yield varies.
- Edge effects. Fix: keep plots away from headlands, ditches and tree lines.
- Forgetting harvest loss. Fix: a hand-cut plot has almost no loss, but a combine leaves some grain behind, so expect the bin total to come in a little lower.
Keep a record of each cut: date, GPS point, plot size, weight, moisture and crop stage. Records like these also help with buyer checks; our page on product traceability covers how farm records follow a crop down the supply chain.
Where crop cut data is used
A good crop cut figure helps with several decisions:
- Marketing grain. A pre-harvest yield range tells you how much to forward-sell. Prices change daily, so use today’s price and get advice before contracting.
- Storage and haulage. Expected tonnage sets bin space, drying needs and truck bookings. Fleet scheduling tools are covered on our fleet management page.
- Input planning. Yield sets nutrient removal, which guides next season’s fertilizer. Always check the product label and local rules before applying.
- Insurance and loans. Measured yields support claims and help lenders judge risk.
- Carbon and sustainability reporting. Yield is part of most farm emission intensity sums; see our page on carbon footprinting.
For large estates or groups of growers, a central dashboard helps keep plot data in one place; see the agro admin app page. Developers who want to add satellite and weather data to their own tools can read the satellite and weather API docs.
Limits of crop cutting
Crop cuts are accurate for the plot but can mislead for the field. The Uganda study showed that even a randomly placed 64 m² cut agreed only moderately with the full-plot harvest. Cuts take time, need careful handling and must happen near maturity. Hand-cut plots also skip combine losses.
The answer is not to drop crop cuts but to place more of them well, to anchor counts and satellite maps with weighed samples, and to compare every estimate with the final weighed harvest.
FAQ
What does crop cut mean in agriculture?
A crop cut is a sample harvest of a plot of known size. The grain is weighed, adjusted for moisture and scaled up to a yield per hectare or acre for the whole field.
What is the crop cutting formula?
Yield in t/ha = kg harvested ÷ plot area in m² × 10. Then multiply by (100 − moisture at weighing) ÷ (100 − standard moisture) to get the yield at sale moisture.
How big should a crop cut plot be?
Plots of a few square metres up to about 10 m × 10 m are common. Accurate measurement and several well-spread plots matter more than size. For corn counts, Purdue uses 1/1000 acre of row (17.4 ft at 30-inch spacing).
How many crop cuts are needed per field?
Nebraska Extension uses at least five sites per field, and Purdue says less uniform fields need more samples. Spread them across strong, average and weak zones.
Can satellites replace crop cutting?
Not on their own. In the World Bank study, satellite estimates captured about half of the variation in measured yields. They are most useful for deciding where to sample and for scaling ground results across a field.
How does USDA use crop cutting?
NASS combines farmer surveys with objective plot counts and harvested plot samples in randomly selected corn and soybean fields, then publishes monthly forecasts and a final estimate after harvest.
Related pages on our site: field monitoring app · crop loans and insurance · large farm administration
Farmonaut crop monitoring
See which parts of each field to sample
Draw your fields once and Farmonaut shows satellite crop health maps through the season, on web, Android or iOS, so you can place crop cuts in strong, average and weak zones.




Sources
- Purdue University Extension, Estimating Corn Grain Yield Prior to Harvest (R.L. Nielsen): agry.purdue.edu
- USDA NASS, Agricultural Yield Survey (Guide to NASS Surveys): nass.usda.gov
- farmdoc daily, A Review of USDA Crop Yield Forecasting Methodology (University of Illinois, August 2015): farmdocdaily.illinois.edu
- farmdoc daily, Are USDA Corn Yield Forecasts Getting Better or Worse over Time? (August 2014): farmdocdaily.illinois.edu
- USDA NASS, Crop Production (October 2026): release.nass.usda.gov
- USDA NASS, Crop Production 2025 Summary (January 2026): release.nass.usda.gov
- World Bank, Can satellites deliver accurate measures of crop yields in smallholder farming systems?: blogs.worldbank.org
- Nebraska Extension, G1429 Estimating Winter Wheat Grain Yields: extensionpubs.unl.edu
- Penn State Extension, Home Stretch: Evaluating Your Small Grain Crops: extension.psu.edu
- Copernicus / ESA, Sentinel-2 mission overview (SentiWiki): sentiwiki.copernicus.eu
Discussion
Questions, corrections or field experience? Share them below. First-time comments are reviewed before they appear, and your email is never published.
No comments yet. Be the first to add a question or your experience.

 Rallis India
 Wild Oak Farm
 SFX
 BACF Africa
 Doodlakine
 Exurbia Geospatial
 FieldZero
 Indico Company
 Kubota
 FFBS
 Jontra
 Tucor

 Licence holder · Niger · Gold
 Licence holder · Nigeria · Gold + lithium
 Client · Tanzania · Gold
 Client · Somalia · Gold
 Client & affiliate partner · Ghana · Gold










