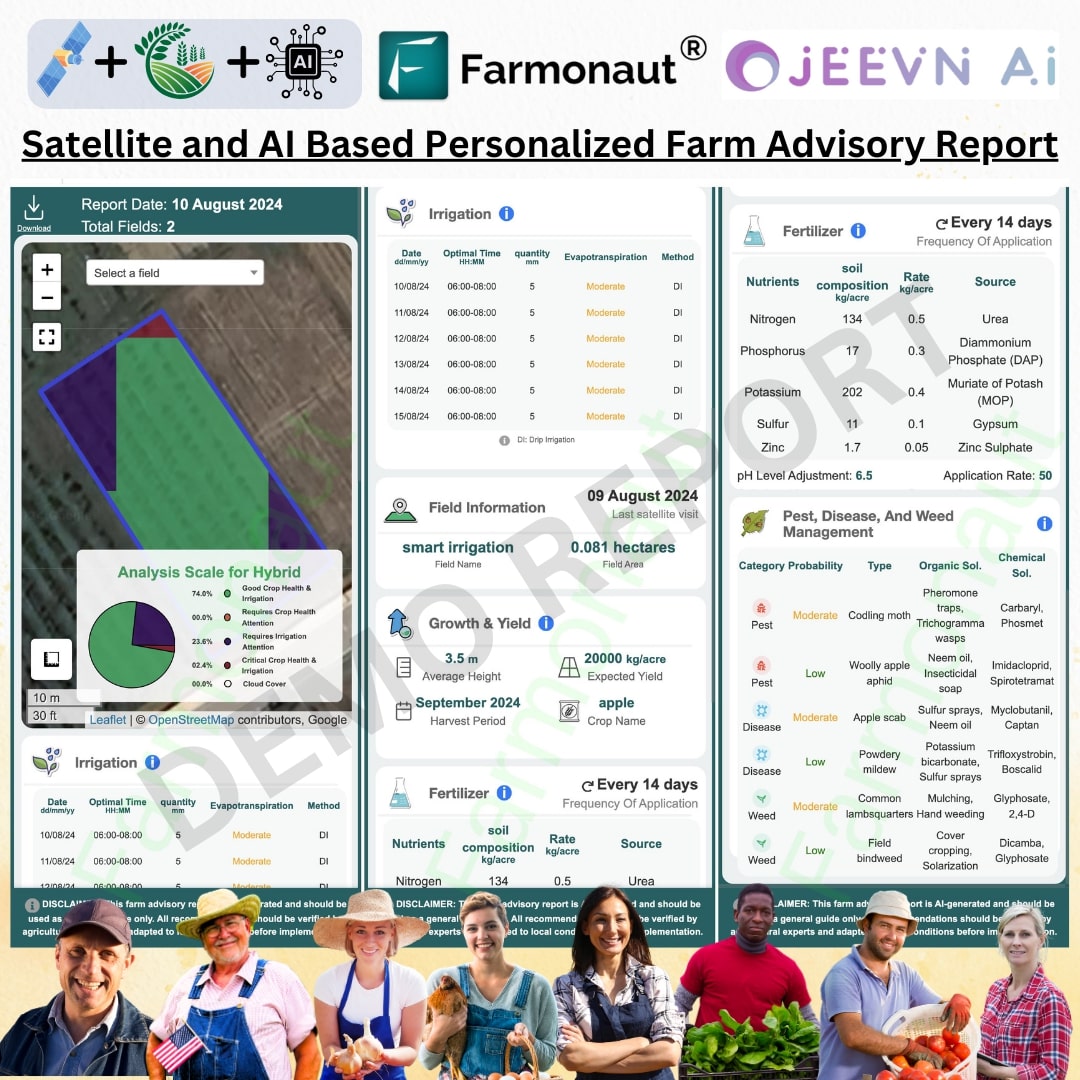
Satellite imagery and advanced visualization tools are revolutionizing how we analyze and understand agricultural data. As a web app developer for the agriculture technology industry, leveraging these capabilities can provide powerful insights to farmers and agronomists. In this guide, we’ll explore how to use Farmonaut’s iframe feature to visualize farm data through satellite imagery.
Table of Contents
- 🔑 Getting Started with the Farmonaut API
- 🖼️ Using the Visualization iframe
- 🌿 Key Visualization Features
- 🚀 Enhancing Your Agriculture Web App
- 🌐 Learn More
🔑 Getting Started with the Farmonaut API
To access Farmonaut’s iframe visualization capabilities, you’ll need:- A Farmonaut API key specifically for iframe use (different from the general API key)
- Field IDs for the farms you want to visualize
- Email: [email protected]
- Phone: +91-6366026267 or +1 (669) 6666 882
🖼️ Using the Visualization iframe
Once you have your API credentials, here’s how to use the iframe:- Open the iframe URL with your API key and field ID as parameters
- Select the image type you want to visualize (e.g. NDVI, NDWI). NDVI is the default.
- View field information like farmer details, field area, and crop type
- Explore the satellite image overlay, which updates based on image type and color map settings
- Adjust the color map to alter visual intensity as needed
- Use the timeline chart to analyze index values across different satellite visits
🌿 Key Visualization Features
The Farmonaut iframe provides several powerful visualization capabilities:- Multiple image types: View NDVI, NDWI, and other agricultural indices
- Color mapping: Customize how data is visually represented
- Field overlays: See index data overlaid directly on satellite imagery
- Timeline analysis: Track changes in vegetation health over time
🚀 Enhancing Your Agriculture Web App
By integrating Farmonaut’s satellite visualization capabilities, you can provide farmers and agronomists with powerful, data-driven insights. This technology enables:- More precise crop health monitoring
- Early detection of irrigation issues or pest infestations
- Historical analysis of field performance
- Data-backed decision making for farm management
🌐 Learn More
Farmonaut continues to develop advanced techniques in spatial data visualization and analysis for agriculture. Stay tuned to their YouTube channel and documentation for more tutorials and updates on this powerful agriculture technology solution. By incorporating satellite-based farm visualization into your web app development for the agriculture technology industry, you’ll be at the forefront of providing cutting-edge tools to support sustainable and productive farming practices.
73

