

Reviewed September 2026 against USDA Economic Research Service, IMARC Group, and Straits Research.
Try it: Run your own numbers →
Introduction: What the Data Actually Shows
The global AI in agriculture market was valued at $2.6 billion in 2025 and is projected to reach $13.0 billion by 2034, according to IMARC Group’s market assessment (IMARC Group). North America holds 36.8% of that global market as of 2025 — the largest regional share of any bloc IMARC tracks. Meanwhile, US variable rate technology (VRT) adoption on the ground is uneven: 37.4% of US corn acreage used VRT in 2016, but only 18.8% of winter wheat acreage did in 2017, per USDA’s Economic Research Service (USDA ERS).
That gap between headline market-size numbers and actual farm-level adoption is the story this page is built to answer. Searches for “agriculture technology as a service market,” “china farming as a service market,” and “chinese agriculture” mostly land on pages that describe a trend in adjectives — “rapid growth,” “widespread adoption,” “significant investment” — without naming a dollar figure, a percentage, or a date. This page names them, flags exactly where public US data stops and where China-specific figures are not independently published, and gives you a tool to run your own numbers rather than someone else’s average.
Agriculture Technology as a Service (AgTaaS): How It Works
Agriculture Technology as a Service (AgTaaS) describes precision-ag tools — sensor networks, satellite analytics, drone imagery, irrigation platforms — sold on a subscription or pay-per-use basis instead of a capital purchase. The model matters because the underlying technology it delivers, variable rate application, already has a two-decade adoption record in US row-crop agriculture that USDA has measured directly.
How AgTaaS Delivers Variable Rate Technology
- Subscription-based access: Precision agriculture tools (drones, sensor networks, satellite analytics) reach farmers through recurring payments rather than equipment purchases, lowering the capital threshold that has historically slowed adoption on mid-size and smaller operations.
- Field-specific variable rate prescriptions: The core AgTaaS deliverable for row-crop growers is a variable rate seeding, fertilizer, or chemical prescription map generated from soil, yield, and imagery data — the same category USDA ERS tracks by crop and year.
- Integrated digital platforms: Centralized dashboards combine soil health monitoring, crop disease detection, irrigation scheduling, and yield forecasting into one subscription rather than separate point tools.
- Recurring-revenue provider model: AgTaaS vendors are incentivized around renewal and outcome, not one-time equipment sales — which is part of why market-size forecasts (see the AI-in-agriculture figures above) increasingly separate “software and analytics” from “hardware” spending.

Where US Adoption Actually Stands
USDA ERS’s crop-by-crop breakdown is the most concrete adoption dataset available for the US market, and it predates most current AgTaaS marketing claims: corn led at 37.4% of acreage using VRT (2016 survey year), soybeans followed at 25.3% (2018), cotton at 22.7% (2019), and winter wheat trailed at 18.8% (2017). These are USDA NASS survey years tied to that specific crop’s rotation in USDA’s Agricultural Resource Management Survey — not a single snapshot year, which is why the years differ by crop. Check USDA ERS’s chart-of-note page directly for any survey updates, since USDA does not refresh every crop on the same schedule.
The practical read: corn growers are more than twice as likely to have adopted VRT as winter wheat growers. If your operation grows wheat and a vendor pitches “widespread AgTaaS adoption” as a reason to sign up now, ask them what adoption rate they’re citing and for what crop — the aggregate market-size number ($2.6 billion, 36.8% North America share) tells you nothing about wheat specifically.
Impact on Farmers, Agribusinesses, and the Market
Farms adopting AgTaaS-delivered VRT report resource-use efficiency gains and input-cost reductions, though the size of that gain depends heavily on baseline management, field variability, and crop. Rather than repeat a single blended percentage, use the crop-specific adoption table below to gauge how mature VRT already is in your crop before budgeting for a new subscription.
- Affordability: AgTaaS removes the high upfront capital barrier of buying VRT-capable equipment outright.
- Scalability: Subscriptions scale with acreage under management rather than requiring a new capital purchase per expansion.
- Ecosystem synergy: Providers bundle hardware compatibility, cloud analytics, and agronomic support into one renewal decision.
- Cross-border relevance: The same subscription logic underlies both US corn-belt VRT programs and the entities China’s market researchers describe as “farming as a service” platforms — though, as the section below explains, the two are measured by very different data infrastructures.
AgTaaS in Action: Examples and Links
- Satellite-driven advisory: Platforms like Farmonaut offer real-time crop monitoring, AI-based soil health analysis, blockchain traceability, and fleet/resource management for farms and agribusinesses.
- Remote sensing for crop health: Satellite imagery-based large-scale farm management enables intervention at the block, field, or plot level.
- Sustainability at scale: Carbon footprint monitoring tools help agricultural enterprises track and report emissions.




AI in Agriculture Technology: Market Size and Regional Share
AI’s role in agriculture is now large enough to be tracked as its own market category, distinct from precision agriculture hardware. IMARC Group puts the global AI-in-agriculture market at $2.6 billion in 2025, rising to a projected $13.0 billion by 2034 — a roughly five-fold increase over that nine-year window (IMARC Group). North America accounts for 36.8% of that 2025 total, the single largest share IMARC assigns to any region.
Adjacent to that figure sits the broader precision farming market, tracked separately by Markets and Markets: North America’s precision farming market was sized at $4.10 billion in 2025, with a projected rise to $6.46 billion by 2032 (Markets and Markets). These two figures are not measuring the same thing — one is AI software and analytics specifically, the other is the full precision farming stack including hardware — so don’t add them together or treat one as validating the other.
Key Roles of AI in Agriculture Technology
- Machine learning for predictive analytics: Models trained on satellite imagery, sensor networks, weather stations, and historic farm records forecast yield and flag disease risk ahead of visible symptoms.
- Automated pest and disease detection: Image recognition and computer vision applied to drone and sensor feeds identify early-stage crop stress.
- Autonomous farm machinery: Robotic planters, sprayers, and harvesters apply seed, fertilizer, and crop protection based on real-time prescriptions rather than uniform field rates.
- Personalized advisory services: Field-level recommendations integrate soil type, crop variety, and microclimate rather than a single regional average.
- Supply chain and market response: AI-generated forecasts inform distribution and planting decisions in response to price signals.

How AI-Driven Platforms Change Day-to-Day Operations
- Early detection and rapid response: AI applications flag disease and pest pressure early, track treatment efficacy, and reduce blanket chemical applications.
- Precision resource management: Customized fertilizer and water recommendations replace flat per-acre rates.
- Adaptation to weather variability: Machine learning models adjust planting and input calendars in response to forecast data rather than a fixed calendar date.
- Data sharing between innovators and end users: Cloud-based platforms let agronomists and researchers benchmark practices across operations.
The gap between AI’s 36.8% North America market share and the crop-specific US VRT adoption numbers above (18.8%–37.4% depending on crop) is worth sitting with. A large regional market share describes where vendors are selling; it does not describe what fraction of acres are actually running the technology. Both figures are real and both come from the sources cited — they simply answer different questions, and conflating them is one of the more common errors in agtech market writing.

Comparative Table: US Variable Rate Adoption by Crop
The clearest structured dataset available for this article is USDA ERS’s crop-by-crop VRT adoption breakdown. Presented as a table, it answers a question no AI Overview can: which US row crop has the most mature precision-ag adoption, and by how much.
| Crop | Acreage Using VRT (%) | USDA Survey Year | Rank |
|---|---|---|---|
| Corn | 37.4% | 2016 | 1st |
| Soybeans | 25.3% | 2018 | 2nd |
| Cotton | 22.7% | 2019 | 3rd |
| Winter wheat | 18.8% | 2017 | 4th |
Source: USDA Economic Research Service, “Charts of Note” 107116. Each crop’s figure comes from a different Agricultural Resource Management Survey (ARMS) year because USDA rotates which commodities it surveys in depth each cycle — corn and soybeans are surveyed more frequently than wheat and cotton. That means the four percentages above are not from the same calendar year, and a newer figure for one crop does not imply the others have moved by a comparable amount. To check for an updated figure on your crop, go directly to USDA ERS’s chart-of-note page and search “variable rate technology” — USDA publishes new ARMS-based adoption charts on a rolling, crop-by-crop basis rather than a fixed annual calendar.
Chinese Agriculture Technology: What’s Verifiable vs. What Isn’t
China is frequently described as the world’s largest testing ground for agricultural drones, low-cost IoT sensor kits, and blockchain food-safety traceability. Those descriptions are directionally consistent with what private market-research firms report about Chinese agricultural machinery and IoT hardware sales. What is not currently available in published form — and this matters for anyone trying to size the opportunity precisely — is a government-verified adoption rate for Chinese precision agriculture comparable to USDA’s crop-by-crop VRT figures, or a market-size figure isolating China’s “farming as a service” or “applied AI in agriculture” segment specifically from broader Asia-Pacific or global totals.
That gap is real and worth naming plainly rather than papering over with adjectives. If you need a China-specific agriculture-technology adoption rate or market size for a business case, the honest path is direct outreach to a firm that publishes China-segment data — IMARC Group and Markets and Markets both break some reports into regional segments beyond North America, so check whether either firm’s underlying report (linked above) includes an Asia-Pacific or China-specific cut before assuming the global topline applies proportionally. A World Bank or FAO agricultural-technology dataset is the more typical route to country-level figures for markets outside the US, though neither was available with a specific China precision-ag percentage in the research for this article.
What Chinese AgTaaS Providers Are Reported to Offer
- AI-powered drone spraying and imaging: Chinese agricultural drone operators are widely reported to run some of the largest commercial drone fleets globally, offering crop-dusting and image-based disease scouting as a paid service to smallholder farms rather than requiring individual equipment ownership.
- IoT and sensor platforms: Investment in lower-cost, durable soil and climate sensor kits has expanded rural monitoring networks, often paired with irrigation controls and mobile advisory apps.
- Big data and analytics platforms: Cloud-based agricultural data platforms support both enterprise planning and, reportedly, government-level trend forecasting.
- Blockchain traceability: End-to-end traceability pilots for grain, produce, and livestock aim to counter supply-chain fraud and strengthen food-safety claims — the same underlying technology Farmonaut applies to agricultural and mining supply chains.
- Sustainable input reduction: National policy attention on reducing fertilizer and pesticide overuse is frequently cited as a driver of sensor and satellite-feedback adoption.
- Global technology export: Chinese agtech vendors reportedly export lower-cost drone, sensor, and platform solutions into other regions’ markets, competing on price against Western equivalents.
How to Verify a China Agtech Claim Before You Cite It
Given how thin the public, government-sourced data is on Chinese precision-ag adoption specifically, treat any specific percentage you encounter elsewhere with caution unless it names a primary source. A workable verification checklist:
- Ask which entity collected the figure. A private market-research firm’s estimate (like IMARC’s or Markets and Markets’) is not the same evidentiary weight as a national statistics bureau survey.
- Check the segment definition. “Applied AI in agriculture” and “farming as a service” are frequently used interchangeably in marketing copy but may refer to different scopes in the underlying report — hardware included or excluded, drone services included or excluded.
- Confirm the geography isn’t blended. A figure labeled “Asia-Pacific” is not a China figure; China is one of several large agricultural economies inside that regional bucket.
- Look for the publication date, not just a citation year. Market-research figures are frequently republished across many sites years after the original report, without the number being refreshed.

Key Takeaways for US Buyers Evaluating Chinese-Origin AgTech
- Lower-cost hardware is a real, reported pattern: Chinese-manufactured drones and sensor kits are commonly positioned on price relative to US and European equivalents, which is a genuine consideration for cost-conscious US operations sourcing hardware.
- Adoption-rate claims need a named source: Absent a government-verified figure, treat “over X% of Chinese farms” claims as directional marketing language rather than citable data.
- US regulatory and data-sovereignty considerations apply separately: Sourcing hardware or software from Chinese vendors carries its own procurement and data-handling review process for US farm operations, distinct from the technology’s performance claims.

Farmonaut: Satellite-Powered Insights & AI in Smart Agriculture
Farmonaut applies multispectral satellite imagery, AI-based analytics, and blockchain traceability to deliver field-level data to farmers, agribusinesses, lenders, and government programs — the same category of AgTaaS subscription model this article has been quantifying above, applied directly to US row-crop and specialty operations.
Our Key Features and Technology Stack
- Satellite-based crop monitoring: High-frequency imagery tracks NDVI crop health, soil conditions, biomass, and water stress at field, farm, and regional scale.
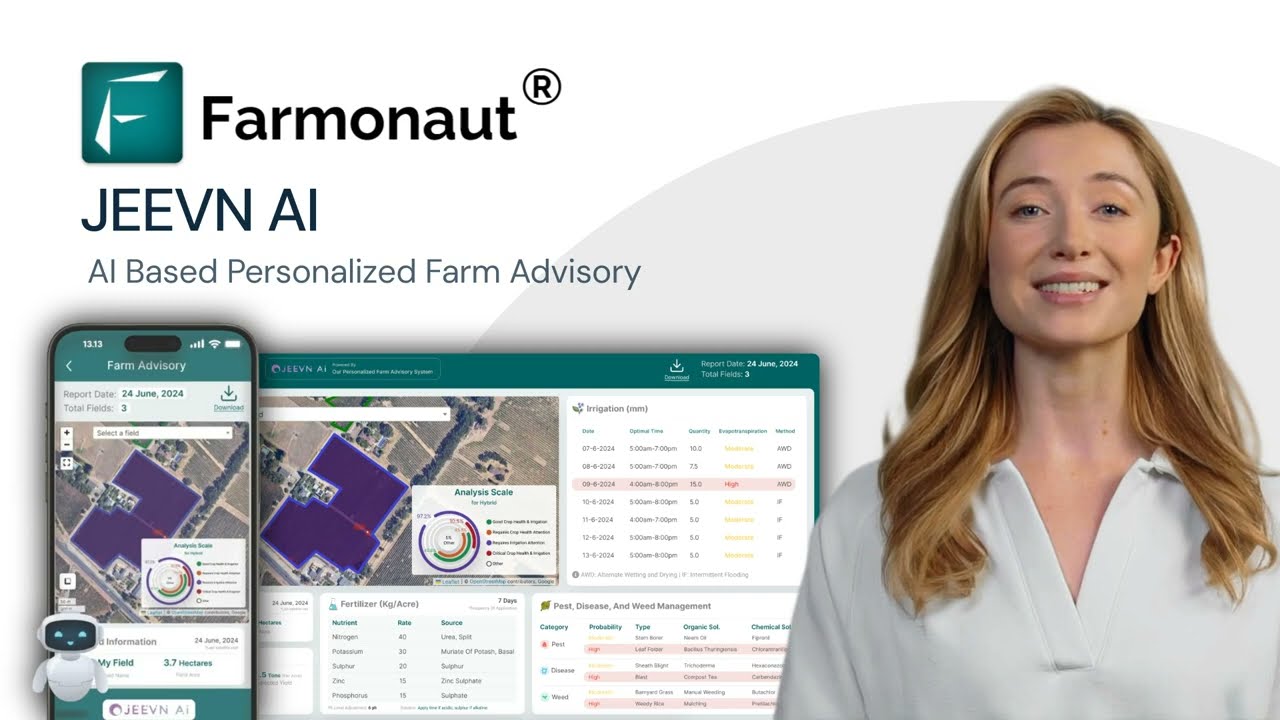
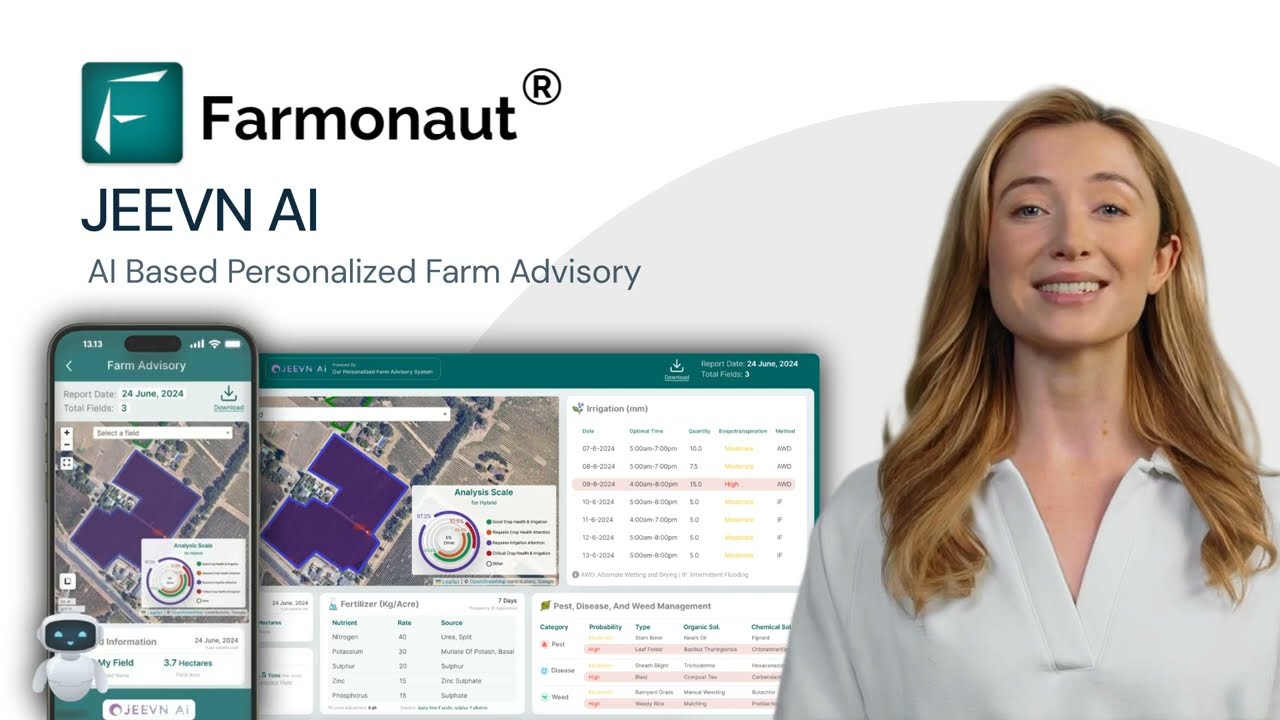
- JEEVN AI advisory: The JEEVN platform analyzes satellite, weather, and historical data to generate real-time irrigation, pest and disease, planting, and harvesting recommendations.
- Blockchain-based traceability: Product traceability secures agricultural and mining supply chains against fraud and builds buyer trust.
- Fleet and resource management: Fleet management tools support machinery, vehicle, and workforce allocation.
- Environmental impact monitoring: Carbon footprinting tools help operations track emissions and meet reporting requirements.
- API access and customization: The open API and API developer docs let businesses and developers embed Farmonaut’s satellite and AI data in their own platforms.

Our web, Android, and iOS platforms give growers, agronomists, and farm managers access to the same data on any device. For US operations, this is most useful layered on top of an existing VRT program: satellite-derived NDVI and soil-moisture data can refine the same variable rate prescription maps referenced in USDA’s adoption figures above, without requiring a new hardware purchase.
Business Model and Accessibility
- Subscription model: Pricing plans support individual growers, businesses, government programs, and large-scale operators.
- API for deep integration: The open API supports partners in agriculture, mining, and sustainability reporting.
- Financial verification: Lenders and insurers can use satellite data for crop loan and insurance verification, reducing fraud and speeding rural finance decisions.
- Scalable architecture: The same modular platform serves a single-field operator or a multi-state agribusiness.
Calculator: Estimate Your VRT Payback Acreage
Use the USDA crop-adoption context above to run your own numbers: enter your acreage, crop, and per-acre input cost, and this tool estimates the acreage-weighted savings range you’d need to hit for a subscription-based VRT program to break even against its annual fee.
Run your own numbers
This tool calculates the input-cost reduction percentage you’d need across your acreage to cover the subscription fee, and shows how your crop’s national VRT adoption rate (USDA ERS, 2016–2019 survey years) compares to your own acreage’s exposure. It does not model yield changes, weather risk, or multi-year contract terms, and it assumes input cost is your only savings source — actual returns depend on baseline field variability and current practice.
Sustainability: Where the Input-Reduction Numbers Come From
Precision agriculture's sustainability case rests on a simple mechanism: applying seed, fertilizer, and chemical inputs only where field conditions call for them, instead of a flat per-acre rate across a variable field. That mechanism is well established agronomically. What's harder to pin down is a single, current, published percentage for how much input volume that saves on average, because the answer depends heavily on how variable a given field already is — a highly uniform field has little room for VRT to reduce inputs, while a field with sharply different soil zones has much more.
Precision Tools for Sustainability
- Input reduction: Variable rate prescriptions target fertilizer, pesticide, and water application to zones that need it, rather than the whole field uniformly.
- Carbon tracking: Satellite-driven carbon footprint tracking lets farms and programs monitor and report greenhouse gas emissions over time.
- Soil health monitoring: Remote sensing and IoT sensors flag nutrient deficiency or degradation before it shows up in yield data.
- Pest and disease early detection: Drone- and sensor-based alerts reduce the acreage treated with broad-spectrum pesticide by narrowing treatment to affected zones.
- Traceability for verified claims: Blockchain integration lets organic or sustainability claims be checked through the supply chain — see product traceability — rather than taken on trust.
For a defensible input-reduction figure specific to your own operation, the most reliable method is a paired-field trial: run VRT on part of a field and the flat rate on an adjacent, comparable section for one season, then compare actual input volume and yield. That gives you a number tied to your own soil and equipment, rather than a market-average that may not reflect your field's variability.
Future Outlook: Reading the Market Forecasts Correctly
Two forecast pairs anchor the "where is this market going" question for AgTaaS: the global AI-in-agriculture market moving from $2.6 billion (2025) to a projected $13.0 billion by 2034, and North America's precision farming market moving from $4.10 billion (2025) to a projected $6.46 billion by 2032, both per the sources cited above. Separately, Straits Research puts North America's share of the global variable rate technology market at 39.6% as of 2025 (Straits Research) — a slightly larger regional share than IMARC's 36.8% North America figure for the broader AI-in-agriculture category, which is expected since VRT is a narrower, more US-adoption-heavy segment than AI in agriculture overall.
Reading these forecasts usefully means treating each number as a claim from a specific firm about a specific segment and period, not as a single trend line. A CAGR-based projection to 2032 or 2034 is a modeling exercise built on assumptions about adoption curves, input prices, and regulatory environment that can shift — it is not a guarantee. If you're building a business case around one of these forecasts, go to the source report directly (linked throughout this article) rather than a secondhand summary, since firms periodically revise their projections as new base-year data comes in.
- More resilient, subscription-funded farms: Recurring-access models lower the capital barrier for mid-size operations to compete on data quality with larger ones.
- Smart resource management: Field-level advice increasingly replaces whole-farm averages for irrigation, fertility, and pest response.
- Scalable productivity gains: Subscription-based tools let operations scale technology spend with acreage rather than in fixed capital jumps.
- Decentralized, edge-based decision-making: Cloud and edge-AI processing push recommendations closer to the field in near real time.
- Tighter market integration: Supply chain and market analytics increasingly feed back into planting and marketing decisions.
- Universal, multi-platform access: Web, mobile, and API-driven delivery keep the technology accessible regardless of a farm's existing hardware stack.
The market's growth is a feedback loop: more data access improves prescriptive algorithms, which improves outcomes, which drives further subscription renewal and new data — the same loop that underlies both the US VRT adoption curve and the broader AI-in-agriculture forecasts above.
FAQ: Agriculture Technology as a Service and AI in Agriculture
Q: What is Agriculture Technology as a Service (AgTaaS)?
AgTaaS is a business model where agricultural tools and analytics — AI software, drones, sensors, satellite data, and variable rate prescriptions — are delivered on a subscription or usage-based basis rather than sold as capital equipment.
Q: How big is the agriculture technology as a service market?
There isn't a single published figure isolating "AgTaaS" as its own category. The closest verifiable proxies are the global AI-in-agriculture market ($2.6 billion in 2025, projected $13.0 billion by 2034, per IMARC Group) and North America's precision farming market ($4.10 billion in 2025, projected $6.46 billion by 2032, per Markets and Markets). Neither figure is AgTaaS-specific, so treat them as adjacent bounds rather than an exact market size.
Q: What is the agriculture variable rate technology market size?
North America holds 39.6% of the global variable rate technology market as of 2025, according to Straits Research. On the ground, USDA ERS's crop-level survey data shows US VRT acreage adoption ranging from 18.8% (winter wheat, 2017) to 37.4% (corn, 2016) — the two figures answer different questions (global market share vs. US on-farm adoption) and should not be conflated.
Q: How does AI improve agriculture?
AI analyzes data from satellites, sensors, and market feeds to predict yield, tailor input use, detect disease and pests early, and power autonomous machinery — helping farms increase productivity while reducing input waste.
Q: What is China's farming as a service market?
A China-specific market size for "farming as a service" is not currently available as an independently published, government-verified figure in the sources reviewed for this article. Chinese agricultural drone, IoT sensor, and blockchain-traceability adoption is widely reported by private market-research firms and industry coverage, but a precise national adoption percentage comparable to USDA's crop-level VRT data has not been located. If you need this figure for a business case, request the China-segment breakout directly from a firm like IMARC Group or Markets and Markets, since their public summaries may not disaggregate China from the broader Asia-Pacific region.
Q: What is China's applied AI in agriculture market size?
As with farming as a service, no China-specific applied-AI-in-agriculture market size was found independently published in the research for this article, separate from broader Asia-Pacific or global AI-in-agriculture totals. The global figure ($2.6 billion in 2025, IMARC Group) includes North America's 36.8% share; China's share within the remainder is not broken out in the source reviewed.
Q: Is Chinese agriculture technology cheaper than US or European equivalents?
Chinese-manufactured agricultural drones and IoT sensor kits are commonly reported as lower-cost than Western equivalents, which is part of why they're referenced as accelerating smallholder adoption. A precise price comparison wasn't available in the sources for this article; if cost is decision-relevant, request current landed-cost quotes directly from vendors rather than relying on a general "lower-cost" characterization.
Q: How can I access these technologies?
Farmonaut offers web, Android, and iOS platforms, plus open APIs for integration with business or government systems. Subscription models support individual growers through to government-scale deployments.
Q: Where can I find API integration and developer support?
Farmonaut's API and developer documentation support integration of satellite and AI data into proprietary apps and enterprise platforms.
Q: Is AgTaaS suitable only for large farms?
No. USDA's own adoption data shows VRT already reaches over a third of US corn acreage — a mix of farm sizes, not exclusively large operations. Subscription pricing generally lowers the entry threshold further, making it accessible to smallholder and mid-size operations that couldn't justify buying VRT-capable equipment outright.







Conclusion: What to Trust, and Where to Check It Yourself
The agriculture technology as a service market is real, growing, and measurable in parts — a $2.6 billion global AI-in-agriculture market in 2025 heading toward a projected $13.0 billion by 2034, a North America precision farming market at $4.10 billion in 2025 heading toward $6.46 billion by 2032, and US crop-level VRT adoption ranging from 18.8% to 37.4% depending on the crop. Those figures came from USDA ERS, IMARC Group, Markets and Markets, and Straits Research, and each is linked above so you can check it directly rather than take this page's word for it.
What isn't measurable yet, at least not from any independently published, government-verified source found for this article, is a precise China-specific market size for farming as a service or applied AI in agriculture. Rather than fill that gap with a plausible-sounding number, this page names the gap and gives you the method to close it yourself: request the disaggregated regional breakout directly from the research firms cited, or check FAO and World Bank agricultural-technology datasets for country-level figures as they're published.
For US operations evaluating whether to adopt AgTaaS now, the USDA crop-adoption table above is the most defensible starting benchmark: if your crop's national adoption rate is already above 30%, you're following an established curve; if it's under 20%, you're earlier than most of your peers, which cuts both ways as a competitive consideration.

 BACF Africa
 Nivia
Nivia Doodlakine
 Exurbia Geospatial
 FieldZero
 Indico Company
 Kubota
 FFBS
FFBS Jontra
 Kalustyan
 Tucor
Tucor Hayleys Agriculture
 Linx Agritech
