

Reviewed August 2026 against USDA NASS, USDA ERS, and Drought.gov data.
Try it: Run your own numbers →
Solutions to Problems Faced by Farmers: 10 Fixes That Work
The solutions to problems faced by farmers fall into three groups: practices that protect the soil and water you already have, technology that tells you exactly where to spend your next dollar, and market or policy fixes that get a fair price for what you grow. Below are the 10 problems that show up most in USDA data — climate volatility, soil loss, water waste, pests, labor, information gaps, post-harvest loss, land degradation, market access, and policy — each paired with the specific practice, adoption rate, and tool that addresses it. No filler, no generic advice: real figures from USDA NASS and USDA ERS, a side-by-side comparison table, and a calculator you can run with your own field numbers.
Table of Contents
- Comparative Solutions Overview Table
- 1. Climate Change and Environmental Degradation
- 2. Soil Degradation and Erosion
- 3. Water Scarcity and Mismanagement
- 4. Pest and Disease Management
- 5. Labor Shortages and Aging Workforce
- 6. Limited Access to Technology and Information
- 7. Post-Harvest Losses
- 8. Land Degradation and Deforestation
- 9. Economic Constraints and Market Access
- 10. Policy and Governance Challenges
- Irrigation Water & Cost Savings Calculator
- Frequently Asked Questions (FAQ)
- Conclusion
- Try it: Run your own numbers




Comparative Solutions Overview
These 10 problems and their fixes, side by side — the kind of structured comparison a generic AI answer will not lay out for you:
| Agricultural Problem | Practice or Technology | US Adoption / Measured Impact | Data Source & Period |
|---|---|---|---|
| Climate Change & Environmental Degradation | Drought-tolerant varieties, satellite monitoring | About 80% of US agricultural land experienced drought in 2012; 57% of cropland was in severe or worse drought by mid-August (USDA ERS) | USDA / Drought.gov, 2012 |
| Soil Degradation & Erosion | No-till, cover cropping, riparian buffers | No-till on about 105.2 million acres; cover crops on 18.0 million acres, 4.7% of cropland (Direct Driller, farmdoc daily) | USDA ARMS, 2021–2022 |
| Water Scarcity & Mismanagement | Drip/micro irrigation, soil moisture analytics | 37% less water with drip than furrow irrigation in a University of California sweet corn study (CDFA) | See irrigation section below |
| Pest & Disease Management | Integrated pest management, remote sensing | Crop rotation and biological control reduce chemical dependency; see method below | See section 4 |
| Labor Shortages & Aging Workforce | Autosteering, yield monitors | 70% of large-scale US crop farms use autosteering; 68% use yield monitors/soil maps | USDA ERS, 2023 |
| Limited Access to Tech & Info | Mobile advisory, satellite APIs | Same precision-ag toolset above, extended to advisory delivery | USDA ERS, 2023 |
| Post-Harvest Losses | Modern storage, monitoring dashboards | US/SA post-harvest loss rates not published at national level — see Gap note in section 7 | Not available; method given below |
| Land Degradation & Deforestation | Agroforestry, carbon tracking | Measured via satellite land-cover change; farm-level tools linked below | See section 8 |
| Economic Constraints & Market Access | Cooperatives, traceability, credit verification | Farm-level income effects depend on crop and region; no single US/SA national figure published | Method given in section 9 |
| Policy & Governance Challenges | Investment, transparent reporting | US crop production data itself is a policy output — 14.9 billion bushels of corn in 2024 | USDA NASS, 2024 |


1. Climate Change and Environmental Degradation
Climate volatility is not a future risk for US and South African producers — it is a line item. In 2012, about 80% of US agricultural land experienced drought, and by mid-August 57% of cropland was in severe or worse drought, according to USDA ERS. Crop insurance indemnities for the 2012 crop year came to about $17.4 billion, per Crop Insurance in America, an industry group. That single event is the clearest illustration of why climate-resilient practices are now underwriting decisions, not optional extras.
The Challenge
- Unstable rainfall, higher evapotranspiration, and recurring drought years
- Accelerated land degradation and biodiversity loss under repeated heat stress
- Insurance and input costs rising faster than commodity prices in drought years
The Solution
- Drought-tolerant varieties: bred to hold yield in low-moisture years, cutting the swing between a normal year and a drought year.
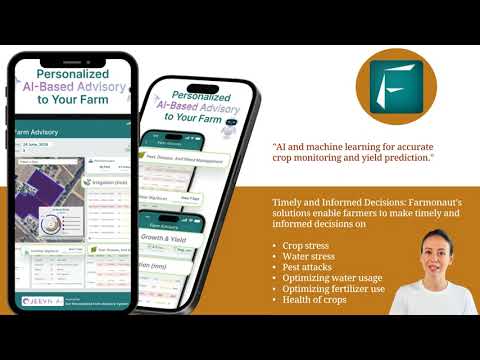
- Satellite moisture tracking: Farmonaut’s satellite-based moisture monitoring flags stress before it’s visible on the ground, so irrigation or insurance claims can be timed to actual field conditions rather than guesswork.
- No-till farming: keeps organic matter and moisture in the soil profile — see the adoption figures in Section 2.
- Farm management platforms: Farmonaut’s large-scale farm management suite layers weather and satellite data so multi-field operations can make the same climate-smart call across every parcel at once.
How to check the current drought picture for your county: Drought.gov publishes weekly US Drought Monitor updates by county — check it before planting-window decisions rather than relying on last year’s pattern.

2. Soil Degradation and Erosion
Soil conservation is one of the few areas where the US has a hard adoption number. The 2022 Census of Agriculture counted about 105.2 million acres under no-till on 300,954 farms, per Direct Driller, and cover crops on 18.0 million acres, just 4.7% of total cropland, per farmdoc daily. Cover crops in particular leave a lot of room for better erosion control.
The Challenge
- Loss of arable topsoil through erosion and compaction
- Nutrient depletion reducing crop vigor without added fertilizer
- Higher vulnerability to drought where soil organic matter is low
The Solution
- Contour plowing and terracing on sloped fields to cut runoff.
- No-till and reduced tillage: no-till covered about 105.2 million US acres in the 2022 Census of Agriculture.
- Riparian buffers: strips of grass or trees along streams that trap sediment and nutrients before they reach the water.
- Cover cropping and crop rotation to rebuild organic matter and break pest cycles between seasons.
- Satellite soil moisture and depletion tracking via Farmonaut’s crop and soil analytics API to catch degradation trends before yield drops.
Refresh path: no-till and cover crop acreage are counted in the Census of Agriculture, next taken for 2027; check USDA NASS for the new figures when they are released.
3. Water Scarcity and Mismanagement
Agriculture remains the largest single consumer of freshwater in both the US and South Africa. Flood irrigation and unmonitored center-pivot systems waste water that drip and micro-irrigation systems apply directly to the root zone — a University of California study found drip-irrigated sweet corn used 37% less water than furrow-irrigated fields (CDFA).
Soil-moisture probes and connected controllers rarely work alone, and our guide to ioT systems on farms shows how they fit into wider setups and who is using them.
The Challenge
- Overreliance on flood irrigation in row-crop regions
- Declining aquifer levels in irrigation-dependent basins
- Salinization and waterlogging from over-application
The Solution
- Drip irrigation: delivers water to the root zone, cutting evaporation loss versus overhead or flood systems.
- Sensor-based micro-irrigation: Farmonaut’s soil moisture detection triggers irrigation only when the root zone actually needs it.
- Rainwater harvesting as a buffer supply during dry spells.
- Water-efficient variety selection to lower total seasonal demand.
- API-driven forecasting: the Farmonaut satellite analytics API feeds soil moisture and weather data directly into irrigation scheduling software.
For developers and agribusinesses building their own scheduling tools, the Farmonaut API Developer Docs cover integration of real-time water, weather, and soil data.
Irrigation Water & Cost Savings Calculator
Enter your field size, current irrigation method, and local water cost to see the potential savings from switching to drip or sensor-based irrigation, using the up-to-50% reduction benchmark cited above.
Run your own numbers
Assumptions: savings rates (50% for drip/micro, 25% for sensor-scheduled sprinkler) are the commonly cited precision-irrigation benchmark, not a guarantee — actual savings depend on soil type, crop, and current system efficiency. The calculator excludes equipment and installation costs, so treat the output as a water/operating-cost estimate, not a full ROI figure.
4. Pest and Disease Management
Pest and disease outbreaks remain one of the costliest unplanned expenses in row-crop and orchard operations, and heavy blanket pesticide use compounds the problem through resistance and pollinator decline. Integrated Pest Management (IPM) replaces calendar-based spraying with monitoring-triggered action.
The Challenge
- Outbreaks that wipe out a season’s margin with little warning
- Growing pesticide resistance in repeatedly treated fields
- Consumer and regulatory pressure on chemical residue levels
The Solution
- Biological control: beneficial insects and natural predators reduce pest pressure without a chemical pass.
- Crop rotation and intercropping: disrupts pest life cycles that build up under monoculture.
- Disease-resistant varieties: lower the baseline spray requirement across the season.
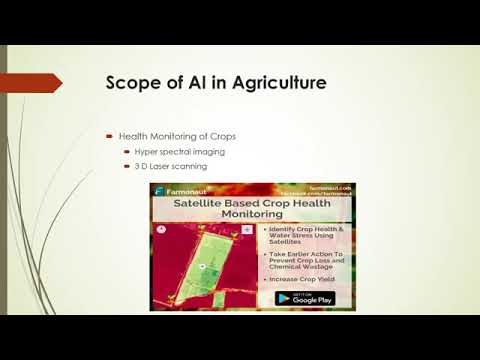
- Satellite-based crop health monitoring: Farmonaut’s crop health monitoring flags stress zones for targeted scouting instead of blanket treatment.
- Sensor-triggered chemical application: only when diagnostics confirm a threshold has been crossed.
5. Labor Shortages and Aging Workforce
Labor is where US precision agriculture adoption is most measurable. As of 2023, 70% of large-scale US crop farms used autosteering guidance systems, and 68% used yield monitors combined with soil mapping, according to USDA Economic Research Service data (USDA ERS). That is a direct labor-productivity substitution: one operator covering more acres per pass, with fewer overlaps and less rework.
A fuller list of these tools, with adoption across US farms, appears in precision farming equipment and adoption rates.
The Challenge
- Fewer young entrants into farm labor and equipment operation roles
- Time-sensitive operations (planting, spraying, harvest) delayed by crew shortages
- Rising per-hour labor costs eroding thin margins
The Solution
- Autosteering and guidance systems: already standard on 70% of large-scale US crop farms (USDA ERS, 2023) — the highest-adoption precision tool in the country.
- Yield monitors and soil maps: in use on 68% of large-scale US crop farms (USDA ERS, 2023), letting one operator manage variable-rate decisions across a whole operation.
- Fleet and resource management: Farmonaut’s fleet management tool reduces the operator hours needed per acre by optimizing vehicle routing and maintenance scheduling.
- Digital advisory and training to bring new operators up to speed on precision equipment faster than on-the-job trial and error.
6. Limited Access to Technology and Information
The same 2023 USDA ERS data that shows 70% autosteering and 68% yield-monitor adoption on large-scale farms also implies the flip side: roughly 30% and 32% of large operations, respectively, are still not using these tools, and adoption on small and mid-size farms is typically lower still. Closing that information and access gap is a distinct problem from lacking the technology itself — many producers know the tools exist but lack the connectivity, capital, or advisory support to adopt them.
The Challenge
- Outdated methods persisting where current agronomic data isn’t reaching the farm
- Weak rural broadband limiting real-time data use
- Lower resilience to weather and market shocks without advance warning
The Solution
- Mobile advisory services: weather alerts, crop management advice, and market data delivered directly to a phone.
- Satellite data and predictive analytics: the Farmonaut API puts the same data class behind the 70%/68% adoption figures above within reach of smaller operations.
- Farmer cooperatives and extension networks: peer-to-peer knowledge transfer where formal advisory reach is thin.
- Large-scale management platforms: the Farmonaut Agro Admin App brings the same monitoring and advisory layer to organizations and government programs managing many farms at once.
7. Post-Harvest Losses
Post-harvest loss is a genuine problem for US and South African producers, but there is no published US federal or South African national figure that breaks losses down by crop and cause the way the drought and tillage data above does. FAO maintains global post-harvest loss estimates, but a regional US/SA breakdown is not readily available in public data as of this review — so rather than repeat a global average that doesn’t reflect your storage conditions, measure it directly.
The Challenge
- Insufficient cold storage and transport in some rural regions
- Inconsistent handling, grading, and packaging practices
- Post-harvest pests, spoilage, and contamination in storage
The Solution
- Modern storage: temperature-controlled facilities extend shelf life measurably against ambient-storage baselines you can track on your own operation.
- Post-harvest handling training: proper grading and packaging cuts spoilage — track your own shrink rate before and after a training pass to get a farm-specific number.
- Value-added processing: converting surplus into stored or processed goods reduces exposure to spoilage windows.
- Real-time monitoring: the Farmonaut real-time monitoring dashboard supports harvest timing and logistics planning to shrink the window between harvest and storage.
Method to get your own number: weigh a sample lot at harvest, then again at point of sale or use; the delta as a percentage of harvest weight is your farm-specific post-harvest loss rate — repeat each season to track whether storage or handling changes are working.
8. Land Degradation and Deforestation
Cropland and pasture expansion at the expense of forest and grassland reduces habitat, pollinator services, and carbon storage, and raises exposure to the same climate extremes covered in Section 1. This is distinct from the soil erosion problem in Section 2 — it’s about net land-cover change, not the condition of land already in production.
The Challenge
- Cropland and pasture expansion displacing forest cover
- Loss of pollination services and carbon storage capacity
- Weak enforcement against illegal clearing in some regions
The Solution
- Agroforestry: integrating trees within farm systems anchors soil, restores wildlife corridors, and cycles nutrients without taking land out of production entirely.
- Reforestation with native species on degraded or marginal land to restore water cycling.
- Enforcement and protected-area management against illegal logging in biodiversity-sensitive zones.
-
Farmonaut’s carbon footprint technology
tracks land-cover and deforestation change continuously via satellite, giving governments, NGOs, and landowners a way to measure restoration progress against a documented baseline instead of a one-time survey.
Solutions for land degradation in mining-adjacent and non-cropland contexts follow a similar restoration logic — see land degradation solutions for degraded landscapes for the parallel case.
9. Economic Constraints and Market Access
Limited market access, thin bargaining power against buyers, and constrained credit access all compress farm margins independently of yield. There is no single published US or South African figure for how much income cooperative membership or traceability adds, because the effect is crop- and buyer-specific — but each lever below has a direct mechanism you can apply to your own contracts.
The Challenge
- Smaller producers facing middlemen with disproportionate bargaining power
- Sparse rural storage and transport infrastructure raising the cost of reaching buyers
- Limited access to credit or crop insurance verification
The Solution
- Cooperatives and grower groups: aggregate volume to negotiate price and share storage/transport costs.
- Infrastructure investment: roads, digital market platforms, and storage that connect producers to more buyers.
- Blockchain traceability: Farmonaut’s blockchain-based product traceability gives buyers verifiable provenance, which supports premium pricing claims at the point of sale.
-
Farmonaut’s satellite-based crop loan and insurance verification
reduces fraud risk in loan underwriting, which can improve the terms a lender offers.
Method to measure your own gain: compare your realized price per unit before and after joining a cooperative or adopting traceability documentation over at least two full selling seasons — a single season doesn’t separate the practice’s effect from normal price swings.
10. Policy and Governance Challenges
Every figure in this article — the 179.3 bu/acre corn yield, the 105.2 million no-till acres, the 70% autosteering rate — exists because USDA NASS and USDA ERS are funded, staffed, and mandated to collect it. Policy and governance quality is measurable indirectly through whether that kind of granular, regularly refreshed data exists for a sector at all; where it doesn’t (see the post-harvest and market-access gaps above), that itself is a governance and data-investment signal.
The Challenge
- Underfunded data collection and extension infrastructure in some program areas
- Fragmented strategies across federal, state, and local agencies
- Inconsistent enforcement of environmental and labor standards
The Solution
- Sustained investment in agricultural data and R&D: the USDA NASS and ERS datasets cited throughout this article are the direct output of that investment.
- Stakeholder engagement: involving producers, researchers, and agribusiness in program design so adoption figures like the ones above keep climbing.
- Transparent reporting: publicly available survey data (ARMS, NASS) lets producers benchmark their own operation against a real national baseline instead of a guess.
- Digital monitoring tools such as Farmonaut’s data-driven monitoring support the compliance and reporting layer that public programs increasingly require.
Farmonaut Subscriptions – Take Action!
Ready to put these fixes to work on your own operation? Activate a plan below and start applying satellite-based monitoring, irrigation scheduling, and traceability today.
The Main Problems in Agriculture, in Numbers
Most lists of agricultural problems name the same handful of issues. Here is how big each one is, using figures from public agencies.
| Problem | What the data says | Source |
|---|---|---|
| Soil degradation | 33% of land is moderately to highly degraded by erosion, salinisation, compaction, acidification or pollution | FAO |
| Water pressure | Agriculture accounts for about 72% of global freshwater withdrawals | FAO AQUASTAT, 2025 |
| Post-harvest loss | 13.2% of food was lost after harvest and before retail in 2021 | FAO SDG 12.3.1 |
| Ageing workforce | The average US producer was 58.1 years old in 2022; 9% were under 35 | USDA NASS, 2022 Census |
| Drought | About 80% of US agricultural land experienced drought in 2012 | USDA ERS |
| Slow technology uptake | Autosteer was used on 70% of large US crop farms in 2023, far fewer smaller farms | USDA ERS |
Two points stand out. Soil and water problems are global and slow-moving, so the fixes (no-till, cover crops, better irrigation) pay back over years, not one season. Labour and technology gaps hit smaller farms hardest, which is why low-cost tools such as phone-based advice and satellite monitoring matter more to them than large machinery. The sections below take each problem in turn.
Frequently Asked Questions (FAQ)
1. What are the solutions to problems faced by farmers today?
The core fixes are: climate-resilient varieties and satellite monitoring for weather volatility; no-till and buffer strips for soil erosion (no-till on about 105.2 million US acres in the 2022 Census of Agriculture); drip/sensor irrigation for water waste; integrated pest management for chemical dependency; autosteering and yield monitors for labor gaps (70% and 68% adoption on large US farms, USDA ERS 2023); mobile advisory for information access; better storage for post-harvest loss; agroforestry for land degradation; cooperatives and traceability for market access; and transparent data reporting for policy gaps.
2. What are the 10 problems of agriculture and their solutions?
In order: climate change (drought-tolerant crops, satellite monitoring), soil degradation (no-till, cover crops), water scarcity (precision irrigation), pests and disease (IPM, remote sensing), labor shortages (automation, guidance systems), limited tech access (mobile advisory, APIs), post-harvest losses (cold storage, handling training), land degradation (agroforestry, reforestation), economic/market constraints (cooperatives, traceability, credit verification), and policy/governance gaps (data investment, transparent reporting). Each is detailed in its own section above with the current US adoption figures where they’re published.
3. What are the remedies for problems faced by the agricultural sector when official statistics don’t cover my situation?
Where a national figure doesn’t exist — post-harvest loss rates and market-access income effects are the two gaps in current US/SA data — measure it on your own operation using the before/after methods given in Sections 7 and 9, and re-run the comparison every season so the number stays current for your specific conditions rather than a national average that may not apply.
4. How much water can precision irrigation actually save?
It depends on the crop and the system you replace. A University of California study found drip-irrigated sweet corn used 37% less water than furrow irrigation (CDFA). Use the calculator above with your own acreage, current usage, and local water cost to size the savings for your operation rather than relying on the percentage alone.
5. How is US precision agriculture adoption changing?
As of the 2023 USDA ERS survey, 70% of large-scale US crop farms used autosteering and 68% used yield monitors with soil maps. No-till and cover crop acreage come from the Census of Agriculture, next taken for 2027 — check the USDA ERS pages linked in Sections 2 and 5 for the current figures before citing these as up to date.
Further reading:
Conclusion
The problems in agriculture are well documented; what’s harder to find is the adoption data that shows which fixes are actually spreading. US large-scale farms are past the tipping point on autosteering (70%) and yield mapping (68%), per USDA ERS’s 2023 data, while cover crops were planted on only 4.7% of US cropland in 2022, per farmdoc daily — meaning one of the cheapest soil fixes on this list is also one of the least adopted. That gap, not a lack of technology, is where the next round of yield and resilience gains sits.
Farmonaut’s satellite monitoring, irrigation analytics, carbon tracking, and traceability tools apply directly to the adoption gaps identified above — climate resilience, soil and water management, and market transparency. Download the app and start with the section that matches your biggest constraint.
Discussion
Questions, corrections or field experience? Share them below. First-time comments are reviewed before they appear, and your email is never published.
No comments yet. Be the first to add a question or your experience.

 Dreamz Tech
 Wild Oak Farm
 SFX
SFX BACF Africa
 Doodlakine
 Exurbia Geospatial
 FieldZero
 Indico Company
 Kubota
 FFBS
FFBS Jontra
 Tucor
Tucor
 Licence holder · Niger · Gold
 Licence holder · Nigeria · Gold + lithium










