

Reviewed September 2026 against USDA Economic Research Service, USDA National Agricultural Statistics Service, and IMARC Group data.
Try it: Run your own numbers →
Farming investors backing precision agriculture, automation, and AI-driven crop management are following adoption curves that USDA and Australian market data now document in hard numbers: 27% of US farms used some form of precision agriculture technology as of 2023, and Australia’s agritech market alone was valued at $683.76 million in 2024, growing at a projected 13.2% a year through 2033. This article breaks down what investors in agriculture and investors for agriculture businesses are actually funding, which technologies show measurable adoption versus which are still speculative, and how to verify the numbers yourself as they update.
Unlike broad “future of farming” surveys, this piece sticks to what’s investable today: the technology categories with published adoption data, the regions (United States and Australia) where the money and the farms actually are, and the specific tools — Farmonaut’s satellite monitoring, fleet management, and traceability platforms among them — that let an investor evaluate a farm operation’s tech maturity before writing a check.
Why Farming Investors Are Watching Ag-Tech Adoption Data
Investors in agriculture have historically had to rely on vendor claims and market-size forecasts to judge which farming technologies were worth backing. That’s changed. USDA’s Economic Research Service now publishes farm-level adoption rates by technology type and farm size, and Australia’s agritech market has an independently sized valuation from IMARC Group. Together these give investors for agriculture business decisions something closer to ground truth: not “farmers are adopting drones” but 27% of US farms using precision agriculture technologies as of the 2023 survey year, with adoption concentrated heavily among large-scale operations.
That concentration matters for capital allocation. USDA’s data shows 70% of large-scale US crop farms already use guidance autosteering systems, and 68% use yield monitors and soil mapping — meaning the highest-adoption categories are also the most consolidated among farms investors would actually want equity or debt exposure to. Smaller operations lag well behind that 70% figure, which is itself a signal: technology vendors and financing programs targeting mid-size and smaller farms are addressing an underserved market, not a saturated one.



The seven categories below are ranked by how verifiable their adoption and market data are, not by hype. Where a number exists, it’s cited with its source and the period it covers. Where it doesn’t — and several genuinely don’t, including farm-level technology adoption in Australia and precision-ag payback periods by farm size — this article says so directly and points to how to find it rather than inventing a figure to fill the gap.
1. Precision Agriculture: The Technology With Verified Adoption Numbers
Precision agriculture is the only category in this article with granular, farm-size-segmented US adoption data, which makes it the natural starting point for farming investors doing quantitative diligence. USDA’s Economic Research Service reported in 2023 that 27% of all US farms used at least one precision agriculture technology — GPS guidance, yield monitoring, variable-rate input application, or soil/yield mapping. Among large-scale crop farms specifically, adoption is far higher: 70% use autosteering guidance systems and 68% use yield monitors paired with soil maps.
That gap between the 27% all-farm average and the 70%/68% large-farm figures is the investment thesis in miniature. Precision ag technology has already won among the operations with the capital to deploy it at scale; the remaining growth is in extending that adoption down to mid-size and smaller farms, which is where financing structures — equipment leasing, satellite-data subscriptions rather than hardware purchases, and crop-insurance-linked monitoring — create room for new entrants and, by extension, new investment vehicles.
- Remote sensing and satellite imagery let operations monitor soil moisture, crop health, and input needs continuously rather than through periodic field visits.
- IoT sensors and connected equipment feed real-time data back into farm management platforms, reducing input waste on water, fertilizer, and pesticides.
- GPS-guided machinery — the autosteering systems USDA measured at 70% adoption on large farms — cuts overlap and operator error on every pass.

On the yield side, USDA NASS’s January 2025 Crop Production report put US corn yield at a record 179.3 bushels per acre for the 2024 crop year, with soybean yield at 50.7 bushels per acre. Neither figure is attributed solely to precision agriculture in USDA’s release — weather, genetics, and input timing all contribute — but the record corn yield landed in a year when autosteering and yield-monitor adoption on large farms was already at 70% and 68% respectively, which is the kind of correlation investors should ask vendors to substantiate with farm-level trial data rather than accept as causation.

For US readers, current-year figures update through USDA NASS: visit data.nass.usda.gov and search “crop production” for monthly forecasts from June through December and final estimates each January. USDA ERS’s adoption chart, cited above, is refreshed on its own schedule at ers.usda.gov/data-products/charts-of-note/110550 — check that page directly before citing these percentages in a term sheet, since farm census and survey cycles mean the next update may not land for a year or more.
Iowa’s Farm and Rural Life Poll, run through Iowa State University, adds a state-level data point relevant to Midwest-focused investors: 22% of Iowa farmers reported using a drone or drone service as of the 2024 poll, per a 2025 summary of that poll. That’s a single-state, single-technology figure — it should not be extrapolated to national drone adoption or to other technology categories.
2. Automation & Robotics: Where Labor Costs Meet Investment Returns
Labor shortages and rising wage costs are the standard justification for automation investment in agriculture, and the USDA autosteering figure — 70% of large-scale crop farms — is itself partly an automation-adoption statistic, since autosteering reduces the operator attention required per acre. Robotic harvesters, autonomous tractors, and monitored equipment fleets extend that same logic to labor-intensive tasks that guidance systems alone don’t address.
- Autonomous tractors and robotic harvesters reduce the number of skilled operators a farm needs per acre under management.
- Smart irrigation systems tied to real-time soil and weather data cut water waste, a cost center that scales directly with acreage.
- Drone and equipment fleets under centralized monitoring let a single farm manager oversee more acreage without a proportional increase in staff.

Fleet management and telematics are the operational layer that makes automation investment auditable. Farmonaut’s fleet management platform tracks equipment location, utilization, and fuel or maintenance costs in real time, giving an investor evaluating an operation the same visibility a fleet manager has — logistics costs, idle-equipment time, and safety incidents, all in one dashboard rather than scattered across paper logs.
There is no published USDA or NASS figure specifically isolating robotic-harvester or autonomous-tractor adoption rates the way autosteering and yield monitors are measured; those technologies are newer and less standardized across crop types, so ERS’s chart doesn’t yet break them out separately. An investor wanting that number for a specific crop or region should check whether USDA’s Census of Agriculture (conducted every five years, with the next full census cycle following 2022) has added a specific equipment-automation question, or request adoption data directly from equipment manufacturers as part of due diligence.
3. AI & Predictive Analytics: Advisory Systems for Risk Management
AI and machine learning layered on top of precision-ag data — weather, soil conditions, pest pressure, and market pricing — are what turn raw sensor data into a planting or input decision. This is the category where farming technology moves from measurement to recommendation, and it’s the fastest-growing piece of Australia’s agritech market: IMARC Group valued that market at $683.76 million in 2024 with a projected 13.2% compound annual growth rate from 2024 through 2033, a period in which AI-driven advisory platforms are the segment IMARC identifies as the primary growth driver.
- AI platforms process weather, soil, pest, and market data simultaneously to recommend crop selection and input timing.
- Predictive models forecast yield and price movement, giving investors a data layer for underwriting risk on financed operations.
- AI-driven advisories help operations respond to climate events — frost, drought, or excess rainfall — with adjusted planting or harvest schedules.

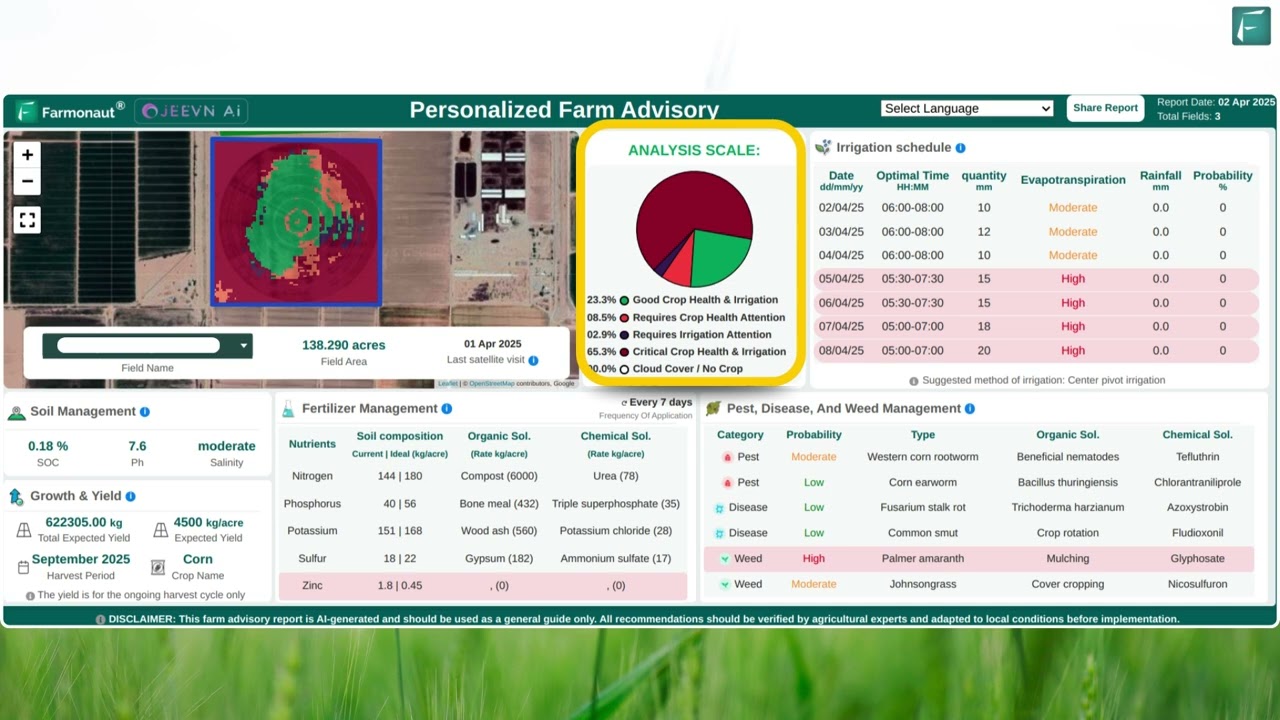
Farmonaut’s Jeevn AI advisory system is one example of this category in production: it combines satellite crop monitoring with weather forecasting to generate management recommendations, and connects to large-scale farm management tools for enterprises overseeing multiple properties. Coverage of AI-powered farming adoption in emerging markets — including this account of AI-driven yield gains in Jos, Nigeria — illustrates the same advisory model applied outside the US and Australia, though that specific case is not a US or Australian data point and shouldn’t be read as one.
A word on the claim, common in agri-tech marketing, that “most investors prioritize AI-powered farming solutions.” No USDA, NASS, or IMARC figure in the current research base quantifies investor sentiment or portfolio allocation percentages for AI agtech specifically. If that number matters to your decision, the two published proxies available are IMARC’s 13.2% CAGR for Australia’s agritech market overall (not AI-specific) and USDA ERS’s technology-adoption chart (not an investor-sentiment survey) — neither substitutes for a direct investor survey, which does not appear to exist in citable form yet.
4. Regenerative Agriculture & Carbon Tech: A Second Revenue Line
Regenerative agriculture and carbon-monitoring technology give farming operations a second revenue stream — carbon credits and premium buyer contracts — layered on top of crop sales, which is why farming investors increasingly ask about it alongside yield data.
- No-till planting, biochar application, and AI-guided nutrient management restore soil organic matter and sequester carbon.
- Precision cover cropping and rotational grazing, tracked via multispectral satellite imagery, let operations document environmental metrics for buyers and regulators.
- Carbon-footprint measurement technology is increasingly a prerequisite for accessing carbon-credit markets and meeting buyer sustainability requirements.

Farmonaut’s carbon footprinting platform tracks and reports these metrics, giving an operation — and by extension an investor reviewing it — a documented emissions and sequestration trail rather than a self-reported estimate. There is no USDA or IMARC figure in this article’s evidence base quantifying carbon-credit revenue per acre or the return premium regenerative-certified crops command in US or Australian markets; investors wanting that number should request it directly from carbon-credit registries (such as Verra or the Australian Government’s Emissions Reduction Fund) rather than from vendor marketing material, since credit pricing varies by registry and verification standard in ways no single figure can summarize.
5. Forest Technology: Satellite and LiDAR Monitoring for Timber Investors
Forestry investors use a related but distinct technology stack: satellite imagery, LiDAR, drones, and AI analytics applied to forest health, biomass, and timber production rather than annual crop cycles.
- Remote sensing detects illegal logging and tracks reforestation or biodiversity project progress.
- LiDAR builds 3D forest structure models used for both carbon-sequestration accounting and commercial timber volume estimation.
- Satellite-based systems support pest detection and resource allocation across large forest holdings.
Farmonaut’s crop, plantation, and forest advisory platform applies the same satellite and AI monitoring used for crop advisory to forest health tracking and compliance reporting — relevant for investors holding timberland alongside row-crop or livestock assets.

This article’s research base does not include a US Forest Service or Australian ABARES figure for forest-technology adoption rates specifically; investors should check the USDA Forest Service’s Forest Inventory and Analysis program and ABARES’ forestry statistics directly for current acreage and management-practice data, since neither source was part of the verified evidence gathered here.
6. Vertical Farming & Controlled Environment Agriculture
Vertical farming and controlled environment agriculture (CEA) address a different investment thesis than the field-crop technologies above: urban and peri-urban production close to consumer markets, with water and land use as the primary constraints being solved.
- Hydroponic, aeroponic, and aquaponic systems produce high-value crops with substantially reduced water input compared to field cultivation.
- LED lighting and climate control enable year-round production regardless of outdoor season, cutting transportation distance and emissions to nearby urban markets.
- Controlled conditions reduce pest and disease pressure, lowering chemical input needs and improving yield consistency harvest to harvest.
Investors considering vertical farming solutions should weigh the category’s higher capital intensity per acre-equivalent against its faster and more predictable harvest cycles compared to open-field crops. This article’s evidence base does not include a US or Australian government figure quantifying CEA market size or adoption rate; USDA’s Census of Agriculture and Australia’s agricultural census both collect some controlled-environment production data, which is the direct source to check for current figures rather than industry market-research estimates that are not independently verified here.

7. Blockchain-Based Traceability: Supply Chain Transparency
Blockchain traceability addresses a governance and trust problem rather than a yield or cost problem: verifying that a crop’s recorded origin, handling, and sustainability claims are accurate from field to buyer.
- Blockchain ledgers create tamper-resistant records of produce origin, handling, and compliance status at each supply-chain step.
- Integration with IoT and satellite data extends verification to the production stage itself, not just post-harvest logistics.
- Verified-origin products can command premium pricing from buyers, while investors gain reduced fraud exposure across financed supply chains.
Farmonaut’s product traceability platform applies this model to agriculture, forestry, and broader supply-chain ventures, recording each transaction step for buyer and investor verification.
Technology Comparison Table for Agriculture Business Investors
| Technology | Published Adoption/Market Figure | Source & Period | What’s Not Yet Published |
|---|---|---|---|
| Precision Agriculture | 27% of all US farms; 70% autosteering / 68% yield monitors on large-scale crop farms | USDA ERS, 2023 | Payback period by farm size |
| Drone Adoption (Iowa) | 22% of Iowa farmers use drones or drone services | Iowa Farm and Rural Life Poll, 2024 | National US drone adoption rate |
| Automation & Robotics | Not separately broken out from autosteering data | — | Robotic-harvester adoption by crop type |
| AI & Predictive Analytics | Included within Australia’s $683.76M agritech market | IMARC Group, 2024 | AI-specific adoption or investor-allocation share |
| Australia Agritech (overall) | $683.76 million market size; 13.2% CAGR 2024–2033 | IMARC Group, 2024 | Farm-level technology adoption percentage |
| US Corn Yield | 179.3 bushels/acre (record) | USDA NASS, 2024 crop year | Yield attributable to precision ag alone |
| US Soybean Yield | 50.7 bushels/acre | USDA NASS, 2024 crop year | Same as above |
This table is deliberately honest about gaps. An investor pitch deck that fills every one of these cells with a precise percentage is citing something other than USDA, NASS, or IMARC — worth asking the source for directly.
Precision Ag ROI Calculator
This calculator uses USDA ERS’s 2023 adoption benchmarks (70% autosteering, 68% yield-monitor adoption on large farms) as a reference point, alongside your own acreage and cost inputs, to estimate where a precision-ag investment could land relative to peer adoption.
Run your own numbers
Assumptions: savings are annual and constant; excludes financing costs, maintenance, and yield-side revenue gains, which USDA does not attribute to precision ag alone. This is a planning estimate, not a financial projection.
Satellite Technology: Farmonaut’s Role in Due Diligence
Satellite-based monitoring gives investors a way to independently verify farm conditions without relying solely on operator-reported data. Farmonaut applies multispectral satellite imagery, AI, and blockchain-based record-keeping across several use cases relevant to investment due diligence:
- Crop and Soil Monitoring: NDVI and soil-moisture imaging to independently verify input use and crop condition claims.
- Environmental Impact Analysis: Carbon-emissions tracking for regulatory compliance and buyer sustainability documentation.
- Fleet, Resource & Infrastructure Management: Fleet management tools for verifying equipment utilization and logistics costs.
- Satellite API Integration: Direct data access via Farmonaut’s API and developer documentation for investors building their own monitoring dashboards.

For an investor comparing multiple prospective farm acquisitions, satellite verification of crop health and input use — cross-checked against USDA yield benchmarks like the 179.3 bushels/acre 2024 corn record — turns marketing claims into checkable data. That’s the practical value: not a replacement for financial due diligence, but a layer that catches inflated yield or condition claims before capital moves.
Farmonaut Platform & Product Highlights
-
Large-Scale Farm Management:
Real-time, AI-based solutions for enterprises managing field, crop, and operational data at scale. -
Carbon Footprinting Platform:
Track, measure, and report CO2 emissions across agriculture, forestry, and carbon-credit operations. -
Blockchain Traceability:
Record every transaction securely from crop field to table. -
Satellite-Based Crop Loan & Insurance Services:
Satellite data for fraud-resistant verification and improved access to financing. -
Crop, Plantation & Forest Advisory:
Crop planning, reforestation, and environmental compliance support via real-time AI analytics.
Frequently Asked Questions: Farming Investors and Ag-Tech
What percentage of US farms actually use precision agriculture technology?
27% of all US farms used at least one precision agriculture technology as of USDA ERS’s 2023 data, rising to 70% for autosteering and 68% for yield monitors among large-scale crop farms specifically. Check USDA ERS’s chart directly for the current release, since this figure updates on USDA’s own survey schedule, not annually.
How big is the agritech market in Australia for investors for agriculture business decisions?
IMARC Group valued Australia’s agritech market at $683.76 million in 2024, projecting a 13.2% compound annual growth rate from 2024 through 2033. This is a market-size and growth-rate figure, not a farm-adoption percentage — Australia does not yet have a published government farm-technology adoption rate comparable to USDA’s US figures in this article’s evidence base.
Do AI and machine learning tools measurably reduce farming investment risk?
AI platforms process weather, soil, pest, and market data to support crop-selection and input-timing decisions, and sit within the broader Australian agritech market IMARC sized at $683.76 million (2024). No AI-specific adoption or risk-reduction percentage from USDA or IMARC exists in the current evidence base; ask vendors for controlled trial data if this number is decision-critical.
What is blockchain traceability’s role in agricultural investment?
Blockchain creates tamper-resistant, verifiable records across the supply chain, reducing fraud exposure and supporting premium pricing for verified-origin produce — relevant to investors financing supply-chain-dependent operations.
How can investors use Farmonaut to evaluate a farm or forestry investment?
Farmonaut’s management platform gives investors independently verified crop health, resource use, and environmental compliance data via satellite imagery — useful for cross-checking operator claims against USDA-benchmarked yield and adoption figures before committing capital.







Where This Leaves Investors in Agriculture
The technologies with the strongest investment case right now are the ones with published, farm-size-segmented adoption data: precision agriculture’s 70% autosteering and 68% yield-monitor adoption among large US crop farms, set against a 27% all-farm average that shows real room to grow into mid-size operations. Australia’s $683.76 million agritech market, growing at a projected 13.2% annually through 2033, adds a second, faster-growing market for investors not restricted to US assets.
- Precision agriculture has the clearest USDA-verified adoption gap between large and small farms — the growth opportunity is in closing that gap, not chasing the large-farm segment that’s already saturated.
- Automation, AI advisory, regenerative/carbon tech, forest technology, CEA, and blockchain traceability each have real production deployments but thinner published adoption data; treat vendor-supplied percentages in these categories as claims to verify, not facts to cite.
- US corn and soybean yields — 179.3 and 50.7 bushels per acre for the 2024 crop year — update every January via USDA NASS, giving investors a recurring, comparable benchmark independent of any single vendor’s claims.
Farmonaut’s satellite, AI, and blockchain-based tools are built to make this kind of verification accessible to individual investors and large enterprises alike, not just to agronomists. Using the platform to independently check a prospective investment’s crop health, resource use, and compliance status turns a pitch deck’s claims into checkable data.
Explore our platform and tools today, or get started with our API. Full technical detail is in our developer documentation.
The adoption gap between large and small US farms, and between the US and Australian agritech markets, is where the next round of farming investment decisions will be made — not in the technologies already at 70% adoption, but in the ones still working their way there.

 Unnati Agri
 Geno
Geno Hayleys Agriculture
 Linx Agritech
 Adinet
 Save Your Soils
 Grandstream Algérie
 XOS Realty
 Geospatial Lab Africa
 Agro La Gándara
 HIPSAC
 ZOL Zimbabwe
 Juligerm
 AdBio
AdBio MISE Maroc
 NWNS
NWNS Red August Group
 Farm Inc
