

Fruit · Technology evidence guide
Fruit Technology: Measured Results From Orchard Robots
USDA and Michigan State report up to 34% better harvesting efficiency from a dual-arm apple robot than from a single-arm one (2025). Choices (2021) reported nearly all fresh tree fruit was still hand-picked. Here is what is measured across orchards, berries and processing, and how to test the numbers on your own acres.
Key takeaways
- The dual-arm apple robot’s up-to-34% gain compares two robots, not a robot and a picking crew (USDA ARS, 2025).
- A robotic blossom thinner removed 67.2% of flowers from targeted clusters in 9.0 seconds per cluster in a commercial apple orchard trial.
- Wages were more than 25% of US noncitrus tree fruit production costs in 2017 (Choices, 2021).
- US apple operations of 5 to 250 acres fell from 8,151 to 4,710 between 2002 and 2017, while those of at least 250 acres went from 283 to 269.
- The US Food Traceability Rule will not be enforced before July 20, 2028 (FDA).
In this article
- Fruit technology at a glance
- Why growers are looking at fruit technology
- Orchard robots: thinning, pruning and picking
- Sensors, satellites and precision tools for fruit
- Innovative berry technologies
- Fruit grinding and processing technology
- Fruit industry demand and trade
- Where the industry is consolidating
- Traceability, supply chain and sustainability
- Agroforestry for fruit and nut farms
- How to choose fruit technology for your farm
- Would an orchard machine pay back on your acres?
- FAQ
- What to watch next
Labor cost is a main reason growers look at fruit technology. USDA’s Agricultural Research Service and Michigan State University built a dual-arm apple harvesting robot that showed up to 34% better harvesting efficiency than a single-arm robot (2025). That is a robot-against-robot result, not a robot against a picking crew. Choices reported in 2021 that nearly all fresh tree fruit was still picked by hand.
This guide sorts what has been measured from what is only promised. It covers orchards, berries and processing lines, shows the labor and farm-size numbers behind the trend, and gives you a calculator to test whether a machine could pay back on your own acres. German-language readers searching for innovative beeren technologien (innovative berry technologies) will find the soft-fruit picture in its own section.
Fruit technology at a glance
The table lists each technology with the evidence behind it. Read the last column first: it tells you who measured the number and when.
| Technology | What it does | Measured result | Source and date |
|---|---|---|---|
| Dual-arm harvester | Picks apples with two coordinated arms | Up to 34% better harvesting efficiency than a single-arm robot | USDA ARS and Michigan State, 2025 |
| Robotic thinning | Removes apple blossoms with a camera-guided arm | 67.2% of flowers thinned from targeted clusters at 9.0 seconds per cluster | Bhattarai, Zhang and Karkee, commercial orchard trial, paper revised 2024 |
| Guidance systems | Steer machines by GPS | 58% of planted corn acres in 2016, up from 5.3% in 2001 (row crops, not fruit) | USDA ERS, 2023 |
| Greenhouse and indoor | Grow crops in controlled conditions | US$626 million in food-crop sales in 2019, in 2012 dollars | USDA ERS, 2024 |
| Traceability records | Link each lot to its supply chain steps | A legal requirement for listed foods, with enforcement delayed to July 2028 | US FDA |
Why growers are looking at fruit technology
The short answer is labor. Tree fruit is one of the most hand-worked parts of farming. A review in Choices, the agricultural economics magazine (2021), put wages at more than 25% of production costs for US noncitrus tree fruit in 2017. USDA researchers go further on apples and other tree fruit: they call harvest labor the single largest production cost.
Workers are also harder to find and cost more. The USDA Economic Research Service farm labor page (updated November 2025) shows three signals:
- Real wages for nonsupervisory crop and livestock workers grew 1.9% a year over the past 10 years, against 1.2% a year since 1990.
- H-2A guest worker positions certified rose from just over 48,000 in fiscal 2005 to around 385,000 in fiscal 2024.
- The minimum H-2A wage for field and livestock jobs ranged from US$14.83 an hour in Arkansas, Louisiana and Mississippi to US$19.97 in California and US$22.23 in the District of Columbia in fiscal 2025. Employers must also provide housing and pay for travel.
Those are all-agriculture figures. They cover fruit growers along with everyone else, so check the rate for your own state and job type before you budget.
Farm pay is also catching up with non-farm pay as a share, though the dollar gap has not closed: about US$11.82 an hour in 1990 and US$12.01 in 2024, in 2024 dollars.
Chart
Real hourly pay: farm and non-farm workers
US$ per hour in 2024 dollars, nonsupervisory workers, 1990 and 2024 only
Orchard robots: thinning, pruning and picking
Orchard robot work targets three main jobs, and each is at a different stage. The evidence below comes from research teams, so treat it as a sign of progress and not as a commercial performance promise.
Robotic harvesting
USDA ARS researchers in East Lansing worked with Michigan State University on the dual-arm robot above. The agency calls it a commercially viable route to automated apple harvest, with great potential for further improvement, but the listing gives no cost data to back that up. The up-to-34% figure compares two robots. It says nothing about how the machine compares with a skilled picker, and it does not give a cost per bin.
Fresh fruit raises a harder problem than speed. Choices notes that nearly all fresh tree fruit was still picked by hand when it wrote, because mechanical harvest can mark the fruit. Mechanical methods were largely confined to fruit going for processing. Any picker for the fresh market has to protect appearance as well as save hours.
Robotic blossom thinning
Thinning sets crop load, fruit quality and return bloom. A team reported a robotic blossom thinning system tested in a commercial apple orchard. Going around the edge of each cluster removed 67.2% of flowers in 9.0 seconds per cluster. Working only at the cluster center removed 59.4% in 7.2 seconds.
The trade-off is clear: more flowers removed costs more seconds. The authors call the results promising and write about what the system could do when commercially adopted. The abstract gives no side-by-side result against a hand crew, so do not read this as proof that robots match people yet.
Pruning and in-field sorting
The same USDA listing includes older research on a robotic arm for tree pruning in West Virginia, and on a self-propelled harvest and sorting prototype in Michigan. These show how long the work has been going on. Ask any vendor for results from an orchard block like yours, with your tree shape and spacing, before you rely on them.
Chart
Robotic blossom thinning: flowers removed
Percent of flowers thinned from targeted clusters, by method, one commercial apple orchard trial
Sensors, satellites and precision tools for fruit
Precision tools are older and simpler than robots. They measure a block, then help you decide where to send water, fertilizer or a scout. The common layers are soil moisture sensors, weather stations, drone images and satellite vegetation maps.
Adoption numbers need care. The best US series comes from the USDA ERS report on digital agriculture adoption (February 2023). It covers six major crops: corn, cotton, rice, sorghum, soybeans and winter wheat. Guidance systems went from 5.3% of planted corn acres in 2001 to 58% in 2016. Fruit is not in that survey, so these figures show direction, not orchard use.
Here is what these tools can and cannot do for a fruit block:
- Soil moisture sensors show water at the point where they sit. Place them in blocks that represent your soil types.
- Weather stations help you track frost risk and disease conditions at your site. Regional forecasts can miss cold pockets.
- Drone images give fine detail, but someone has to fly and process them.
- Satellite maps show changes in plant vigor across blocks over a season. They point to where to look. They do not name the pest or the cause, so someone still needs to walk the rows.
Farmonaut offers this kind of satellite vegetation mapping, which can serve as a scouting guide across large or scattered blocks.
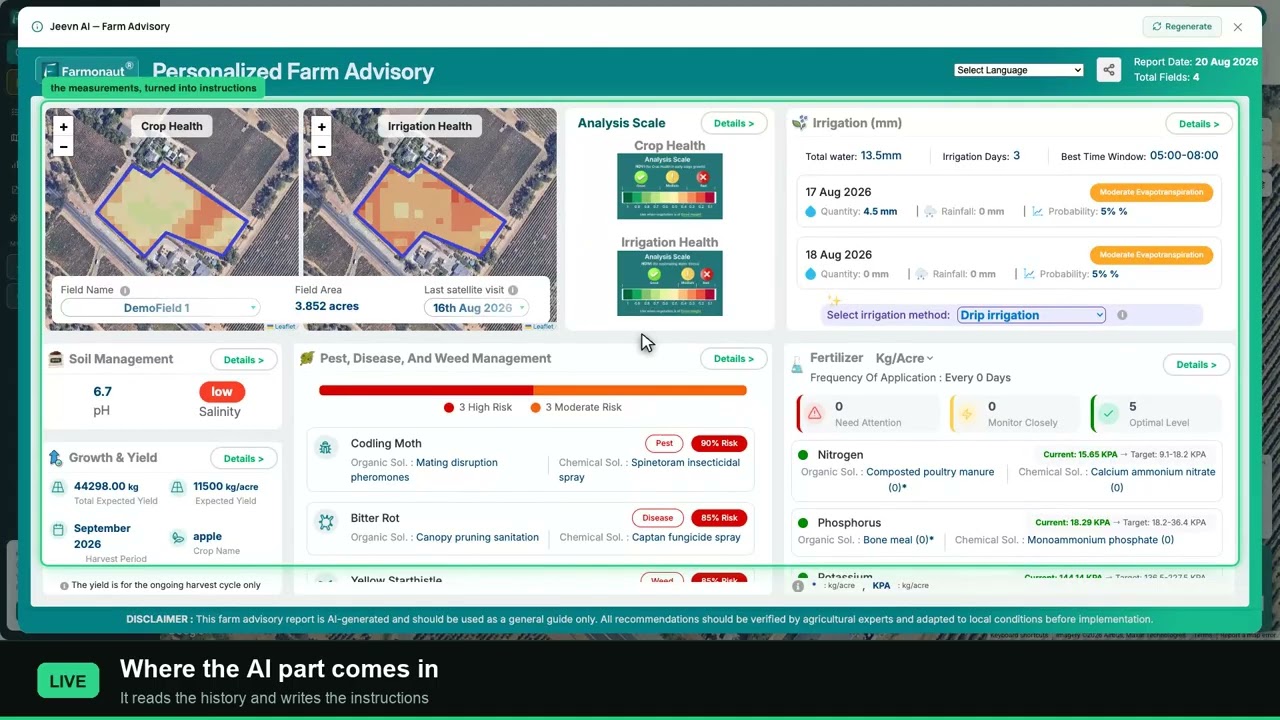
▶ The real advantages and disadvantages of precision agriculture, shown on an actual field. · 2:39
Innovative berry technologies
Berries are a different problem from apples. The fruit is soft, the plants are low, and picking is repeated over many passes. That makes machine vision and gentle handling the main research targets, and it makes a bruised berry a direct loss on the fresh market.
Three pressures shape the choice of berry technology:
- Weather risk. The USDA Fruit and Tree Nuts Outlook of March 2026 reports that a February 2026 Florida state report showed widespread losses in the blueberry crop after prolonged cold overlapped with early flowering and fruit set. Florida strawberries were also hurt. Protected growing and frost alerts answer that kind of risk.
- Concentration. The same report says California grows about 90% of US strawberries. A technology that works on California’s systems may need changes elsewhere.
- Growing systems. Tabletop and tunnel systems put fruit in a more even position, which is easier for cameras and arms than a field bed. Ask for trial results in the system you actually use.
Two newer ideas get attention but remain small. A USDA ERS report on controlled environment agriculture and agrivoltaics (January 2024) found about US$626 million in food-crop sales from controlled environments in 2019, in 2012 dollars, a small share of specialty crop value. It also found that, of roughly 300 US agrivoltaic sites in 2021, only a few shared land with specialty crops, blueberries among them.
Fruit grinding and processing technology
Processing lines turn fruit into juice, puree and powder. Common upgrades include optical sorting before the grinder to catch foreign material, grinders with speed control to suit fruit firmness, and dryers that sense moisture. Fruit for industrial use also has an easier path to mechanical harvest, since appearance matters less.
Published figures for grinding upgrades at commercial plants are hard to come by, so make your own test. Ask the equipment maker for throughput and product loss figures on a fruit like yours. Then run a trial batch and compare it against your current line over the same shift length. Check food safety rules with your regulator before you change a line.

▶ A vacuum drying system for fruit in Mexico, an example of processing technology. · 2:27
Fruit industry demand and trade
Technology has to pay for itself in a market that is not always growing. Choices reports that US retail availability of apples, cherries, peaches, pears and plums averaged 28.4 lb a person in the 1990s, 25.7 lb in the 2000s and 24.4 lb over 2010 to 2017. That is a proxy for demand, and it covers those five fruits only.
Trade cuts both ways. The same article says US exports made up roughly 27% of world cherry trade and 13% of apple trade in its data. Exporters face food safety and record rules in each market. Imports compete at home, and USDA ERS has reported strong growth in US fruit imports.
Forecasts move with the weather, so plan with a range. In its March 2026 outlook, ERS expected the 2025/26 US lemon crop at 1.08 million tons, down 3% from the season before. A machine bought on one good crop year can look very different after two poor ones.
Labor’s share of fruit income
One more number deserves attention. Choices reports that labor costs as a share of gross farm income in fruit peaked at around 33% in 2001 and fell below 25% in 2016. So labor’s share has been falling even as wages rose. The authors tie that to pressure from wages and migration, and they say mechanization has not taken hold in much of the sector. Do not assume a falling share means the labor problem has eased.
USDA also funds work on this. Its ERS overview page lists a review of six USDA programs that speed up automation and mechanization for specialty crops, which it values at US$64.7 billion, a third of US crop receipts in 2017. Growers can ask their extension office which trials run near them, as field days are a low-cost way to see a machine at work.
Where the industry is consolidating
Technology decisions depend on scale, and scale in fruit is shifting. Choices reports the number of US apple operations of 5 to 250 acres fell from 8,151 in 2002 to 4,710 in 2017. Operations of at least 250 acres barely changed, going from 283 to 269. Roughly half of apple bearing acreage was on those large operations by the end of that period, up from about a third 15 years earlier.
Chart
US apple operations by size
Number of operations, 2002 and 2017
Bearing acreage fell for several fruits in the same period, yet apple production rose slightly. The authors link that to better technology and consolidation. For scale, the USDA ERS fruit and tree nuts overview (May 2025) puts the sector’s farm cash receipts at about US$28 billion a year, from less than 2% of US cropland.
Europe has its own map of orchard land. Eurostat’s orchard survey counted about 1.2 million hectares of fruit and citrus plantations in the EU in 2023. Apple orchards covered about 444,000 hectares, and about 16% of that was under 5 years old. Young plantings matter for technology, as a new block can be laid out for machines from the start.
Orchard design matters too. Ask any machine maker which tree shapes and row widths its system was tested on, since a new planting can be designed around that answer.
Chart
Share of EU apple orchard area by country
Percent of about 444,000 ha, top five countries, 2023
Traceability, supply chain and sustainability
Getting fruit to market brings its own rules. In the US, the FDA Food Traceability Rule sets extra record-keeping for listed foods. Its original compliance date was January 2026. Congress later directed FDA not to enforce it before July 20, 2028. Check whether your fruit and your role in the chain are covered, and ask your buyers what they want now, since private buyers can set their own dates. Take legal advice if you are unsure.
Compliance costs fall harder on small farms. USDA ERS estimated that complying with the Produce Safety Rule costs from 0.3% of annual produce sales for the largest farms to 6.8% for the smallest. That is a different rule from traceability, but it shows how fixed costs weigh on small sales, and the same logic applies to record systems and software.
Sound records need no special technology. A spreadsheet that links lot numbers to block, harvest date and buyer can work for a small grower. Software helps as volumes grow. Blockchain is one way to store such records, but no rule we cite requires it, so judge it on cost.
On the field side, drip irrigation and soil moisture sensing are common starting points for saving water. Reduced pesticide programs depend on scouting and pest biology. Follow the product label and local rules for every spray, and get advice from your extension service or a licensed adviser.
Agroforestry for fruit and nut farms
Agroforestry mixes trees with crops and sometimes livestock. It is the slower counterpart to robots, and it needs no software. Growers look at it for several reasons:
- Biodiversity: mixed plantings can give pollinators and natural enemies of pests more habitat.
- Soil: tree roots can hold topsoil and help water soak in.
- Income spread: fruit, nuts, timber or honey can come from one piece of land, on different schedules.
- Trade-offs: tree shade and root competition can cut yields of the crop beneath, and mixed plantings are harder to mechanize.
Results vary by site and by species, so start with a small block and talk to your local extension office.
How to choose fruit technology for your farm
Start with your largest cost or your largest loss, not with the newest machine. These five steps work for any budget.
- Write down the problem in hours or dollars. For example, hours of thinning per acre, or tons lost to frost.
- Ask what the evidence compares. A robot against a robot is not a robot against a crew. An all-crop survey is not a fruit survey.
- Check crop and system fit. Ask for results on your variety, tree shape, row spacing and terrain.
- Count every cost. Include training, maintenance, downtime, software fees, finance and the labor you still need around the machine.
- Test on one block. Keep a matching block as your control, and measure it for a full season before you expand.
Good questions to put to any seller:
- Which farms have run this machine for more than one full season, and can I call them?
- What was the result compared with, and who measured it?
- What happens when it breaks at peak harvest, and how fast does a technician arrive?
- Who owns my farm data, and can I export it if I stop paying?
- Which jobs still need people, such as moving bins, clearing faults or supervising the machine?
Keep timing in mind as well. Harvest and thinning windows are short, so one lost week can cost more than a year of software fees. A machine used for only a few weeks has few hours to earn its keep. Tools that work across several jobs, or crops that ripen in sequence, spread the cost over more of the year.
Scale matters. A machine spread over 500 acres carries far less cost per acre than the same machine on 40 acres. Smaller growers can look at shared ownership or contract services, where they exist. The calculator below shows how that sum works.
▶ Six plain steps to start precision farming without buying a robot. · 4:18
Would an orchard machine pay back on your acres?
Enter your own acres, hours and wage. The result sets labor saved against the yearly cost of owning and running the machine. It is a rough test, not a quote, and the saved-hours figure should come from a trial on your own block, not a brochure.
Try the numbers for your own farm below.
Calculator
Would this machine cover its yearly cost?
Enter your own acres, hours, wage and machine cost.
- Labor saved per year (US$): $54,000
- Yearly machine cost (US$): $55,714
- Hours saved per year: 3,000
Example values only, not a benchmark or a forecast, and set close to break-even on purpose. All numbers are your inputs. The sum spreads the price evenly over the machine’s life and ignores interest, resale value, tax, yield and fruit quality changes. Get a quote and professional financial advice before buying.
FAQ
What is fruit technology?
It is the machines, sensors, software and processing equipment used to grow, pick, sort and trace fruit. Examples include robotic harvesters, soil moisture sensors, satellite crop maps, optical sorters and lot tracking records.
How much better are robotic fruit harvesters?
USDA ARS and Michigan State report up to 34% better harvesting efficiency for a dual-arm robot than for a single-arm robot (2025). That compares two robots. It does not show the machine beating a picking crew, so ask for crew comparisons on your own fruit.
What are innovative berry technologies?
The phrase, often searched in German as innovative beeren technologien, covers picking robots with machine vision, protected and tabletop growing, frost alerts and field monitoring. Field results depend on the growing system, so ask for trial data from a system like yours.
How many US fruit farms use precision agriculture?
The main USDA series on digital agriculture adoption covers six major field crops and leaves fruit out. It gives direction for the farm sector, not a figure for orchards, so do not quote it as a fruit number.
Is fruit technology worth it for a small orchard?
It depends on your hours, wage and machine cost. Low-cost records and a few sensors are a common starting point, while robots need many acres or shared use to spread the cost. Run your own numbers in the calculator and get financial advice before a large purchase.
Where can I find fruit production forecasts?
In the US, USDA ERS publishes the Fruit and Tree Nuts Outlook, and USDA NASS publishes crop forecasts. In March 2026, for example, ERS cited a USDA NASS forecast of 1.746 million tons for 2025/26 US early, midseason and navel oranges combined, unchanged from the season before. In the EU, Eurostat publishes orchard and crop statistics.
What to watch next
Fruit technology is a set of tools moving at different speeds. Sensors and maps can be used today. Robots for thinning and picking are showing progress in research orchards, with the fresh market as the hard test. Labor costs and farm size will keep pushing growers to run the sums.
When a new claim appears, ask three things. Is it about your crop or all crops? What year does the number cover? What was it compared against? A number that passes all three is one you can plan with. For more background, see this overview of the fruit industry.
Related pages on our site: large-farm management, fleet management, product traceability, carbon footprinting, farm management apps, crop loan and insurance checks, farm strategy, farm robots, satellite data API, API developer docs, web app.
Farmonaut crop monitoring
See your own orchard blocks from space
Draw your blocks once and Farmonaut shows satellite vegetation maps for them through the season, on web, Android or iOS.




Keep reading

Sources
- USDA ARS, Scientific Discoveries: New Technologies (dual-arm harvesting robot, 2025): scientificdiscoveries.ars.usda.gov
- Ridley and Devadoss, Challenges for the U.S. Fruit Industry, Choices (2021): choicesmagazine.org
- USDA ERS, Farm Labor (updated November 2025): ers.usda.gov
- Bhattarai, Zhang and Karkee, Robotic Blossom Thinning System for Tree Fruit Crops, arXiv (revised 2024): arxiv.org
- USDA ERS, Digital agriculture adoption on U.S. farms, EIB-248 (February 2023): ers.usda.gov
- USDA ERS, Fruit and Tree Nuts Outlook, FTS-384 (March 2026): ers.usda.gov
- USDA ERS, Controlled environment agriculture and agrivoltaics, EIB-264 (January 2024): ers.usda.gov
- USDA ERS, Fruit and Tree Nuts overview (updated May 2025): ers.usda.gov
- Eurostat, Agricultural production – orchards (2023 data): ec.europa.eu
- University of Vermont hosted review, Evolution towards more competitive apple orchard systems in New York: uvm.edu
- US FDA, FSMA Final Rule on Food Traceability: fda.gov
Discussion
Questions, corrections or field experience? Share them below. First-time comments are reviewed before they appear, and your email is never published.
No comments yet. Be the first to add a question or your experience.

 MDCV UK
 Zerella Group
 Agroes
 Etech Consulting Madagascar
 Vestlandsforsking
 Agritein
 Delicio
 WB Dev
 Sama Premium
 Prochecker
 Tres Valles
 LACOS Geoinformation
 Magrifly
 LatConnect 60
 Blickwinkel
 Agricultural Credit Policy Council
 Marei Nursery
 eKGIS
 Mostas Tech
 Andex

 Exploration consultancy · South Africa · Gold
 Licence holder · Niger · Gold
 Licence holder · Nigeria · Gold + lithium
 Client · Tanzania · Gold
 Client · Somalia · Gold
 Client & affiliate partner · Ghana · Gold










