

Crop disease · Treatment guide
Plant Health Treatments: 7 Crop Disease Options Compared
Disease took an estimated 7.0% of US corn yield in 2025 (Crop Protection Network). This guide compares seven plant health treatments, from resistant varieties and rotation to biologicals and fungicides, and helps you test whether a spray pays.
Key takeaways
- Identify the disease first: a leaf spray is unlikely to fix a soil nematode or a stalk rot.
- Southern rust and tar spot caused about 706 million bushels of the estimated US corn losses in 2025 (Crop Protection Network).
- Rotation breaks vary widely: SARE gives one to two years for onion leaf blight and seven for clubroot of radishes or turnips.
- A French study estimated pesticide use could fall 42% with no loss of output or profit in 59% of French arable network farms (Nature Plants, 2017).
- Spray only if the expected yield gain, in money, is above the full cost, and follow the label and local rules.
In this article
- Plant health treatments compared
- How much crop do plant diseases take?
- First step: identify the problem
- Seven plant health treatments for crop disease
- Will a spray pay on your field?
- How integrated disease management works in practice
- Plant health treatments in forests and tree crops
- Benefits and limits of integrated plans
- FAQ
Plant health treatments for crop disease fall into seven groups: resistant varieties, crop rotation, clean seed and field hygiene, field conditions, biological products, copper and sulfur products, and synthetic fungicides. The right one depends on the pathogen, so identify the disease first. Disease is a large cost: it took an estimated 7.0% of US corn yield in 2025 and 4.8% of potential US soybean production, according to the Crop Protection Network corn estimates and its soybean estimates.
This guide compares the seven options, shows what each can and cannot do, and gives you a calculator to test whether a spray pays on your own field. It combines older farm practice with newer tools, because the two can support each other.
Plant health treatments compared
No single treatment suits every disease. The table shows when each one fits and its main limit. We give no general “percent control” figure, because results change with crop, pathogen, weather and timing.
| Treatment | When it fits | Timing | Main limit |
|---|---|---|---|
| Resistant varieties | A known disease returns in your area | Before planting | Pathogens can adapt; resistance is often specific |
| Crop rotation | The pathogen survives in soil or residue | Planned over years | Little help against spores that blow in |
| Clean seed, hygiene | Disease spreads on seed, residue or equipment | All season | Takes steady labor |
| Field conditions | Wet canopies or poor drainage favor disease | Planting and irrigation | May trade off with yield goals |
| Biological products | Low to moderate pressure, or organic systems | Usually before infection | Results vary; check local trials |
| Copper, sulfur | Listed crop and disease, often organic | Protective cover | Copper can build up in soil |
| Synthetic fungicides | Risk is high and the return covers the cost | At the labeled crop stage | Resistance, cost, label limits |
How much crop do plant diseases take?
A global expert survey published in Nature Ecology and Evolution put yield losses from pathogens and pests at 21.5% for wheat, 30.0% for rice, 22.5% for maize, 17.2% for potato and 21.4% for soybean (Savary and colleagues, 2019). Those totals include insect pests as well as disease. The study also gives a range across global food-security hotspots.
Chart
Yield losses from pathogens and pests by crop
Percent of yield, lowest to highest estimate across the global figure and food-security hotspots in the study; includes insect pests
Disease-only estimates for North America are lower, vary by year and leave out insect pests, so they do not compare directly with the survey above. The 2025 US corn figure of 7.0% was the highest since 2018 but slightly below the 7.7% average for 2012 to 2024. US soybean losses in 2025 came to 216.5 million bushels, with soybean cyst nematode alone at about 70.1 million, followed by sudden death syndrome at 49.3 million and white mold at 17.7 million. Ontario lost an estimated 2.2% of corn yield and 4.5% of soybean production.
These numbers show why the first question is always “which disease?” Tar spot and southern rust are leaf diseases. A soil nematode or a stalk rot needs a different plan, and a leaf spray aimed at leaf disease is unlikely to fix it.
Chart
Largest estimated US corn disease losses, 2024
Million bushels, seven largest named diseases or groups, 29 US states
First step: identify the problem
The US Environmental Protection Agency describes four tiers of integrated pest management: set action thresholds, monitor and identify, prevent, then control. Identification comes before control so that you do not spray when no treatment is needed, or use the wrong product.
Disease symptoms are easy to confuse with nutrient shortage, herbicide injury, drought or compaction. Use these steps before you buy anything:
- Walk the field. Note the crop stage, where the problem sits and whether it follows rows, low spots or field edges.
- Check roots and stems as well as leaves. Dig up plants from the edge of the affected patch, not only the worst spot.
- Collect a sample. Send fresh plant tissue to a university or commercial plant diagnostic lab if you are unsure. Labs can run culture and molecular tests such as PCR.
- Compare with weather. Many fungal diseases need leaf wetness and a certain temperature range. University of Kentucky guidance on grape downy mildew notes that prediction models use local weather data to help growers judge infection risk.
- Decide on a threshold. Ask your adviser what level of disease at this crop stage justifies action.
Phone apps can help you narrow the options, but treat the answer as a lead. One well-known model reached 99.35% accuracy, on a test set of images collected under controlled conditions (Frontiers in Plant Science, 2016). On images taken under different conditions, the same model’s accuracy fell to just above 31%, so confirm with a scout or a lab before an expensive decision.
Where satellites and drones fit
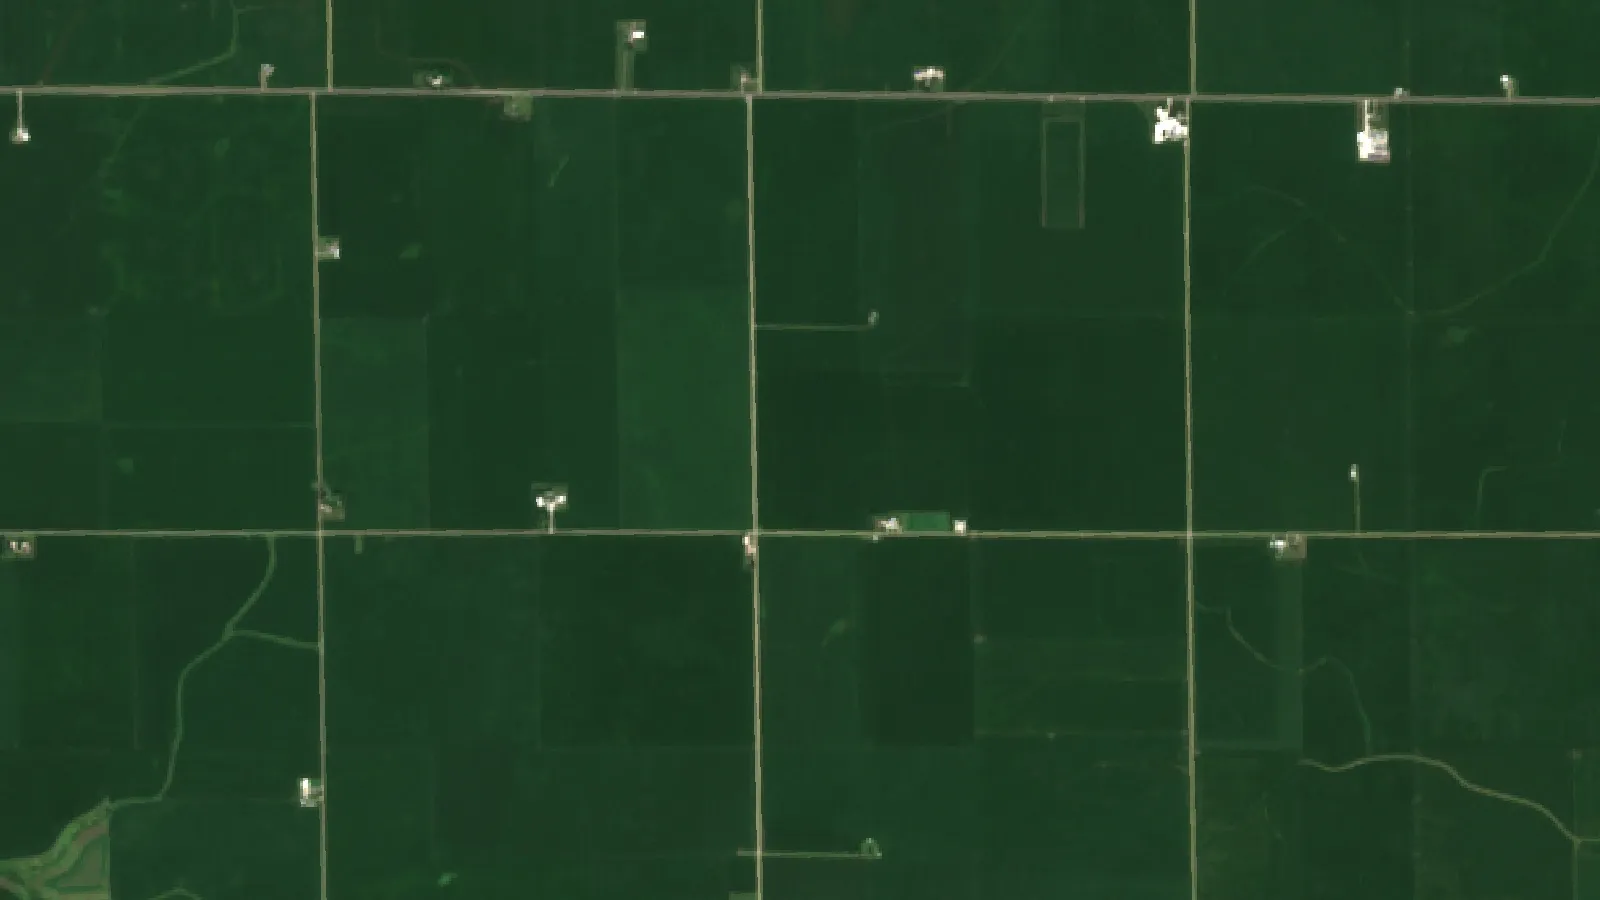
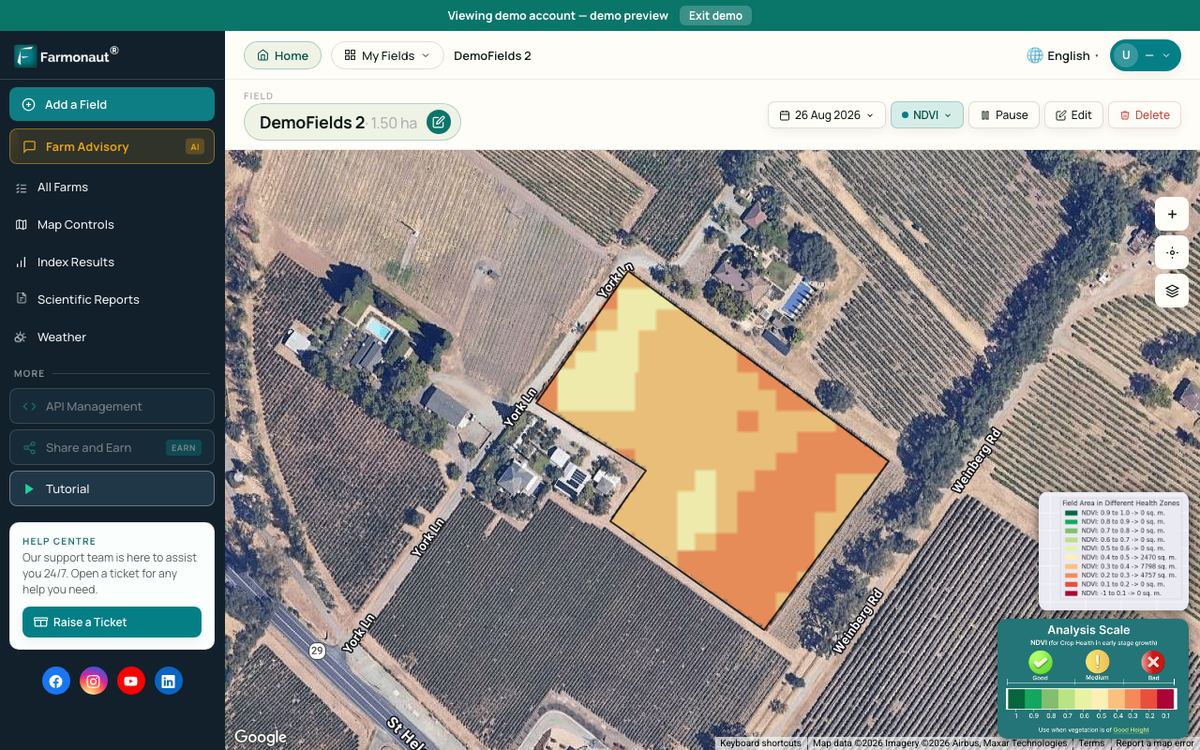
Satellite images, drones and ground sensors show where plant vigor is changing. Farmonaut and similar systems use vegetation indices such as NDVI for this. These maps show that something has changed, and where. They do not name the pathogen, so use them to choose where to scout, then confirm on the ground.
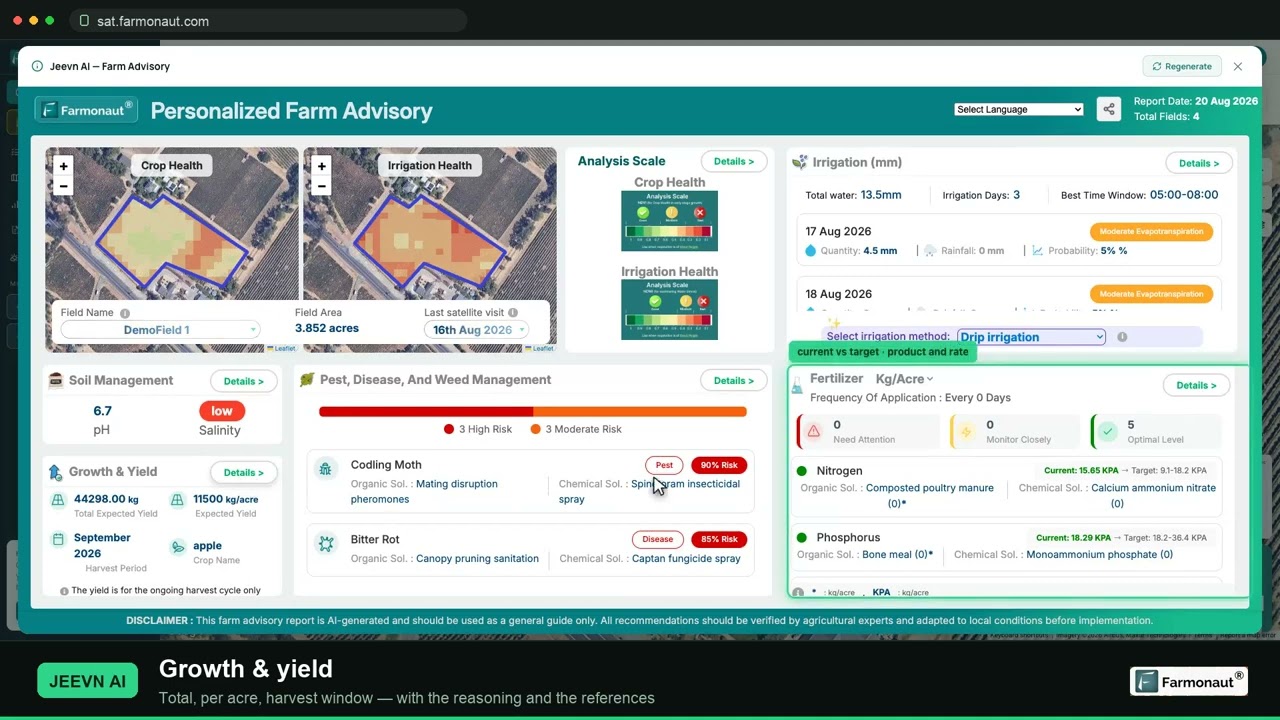
▶ A walkthrough of satellite crop monitoring: reading NDVI, running an AI farm advisory and pulling a field report. · 19:36
Seven plant health treatments for crop disease
1. Resistant varieties
Variety choice comes before the season starts and needs no spray equipment. Read the disease ratings in seed catalogues and independent trials for the diseases your farm has actually had. Cornell notes that powdery mildew symptoms are less common on cucumber and melon because many commercial cultivars have resistance.

▶ How AI tools are used to diagnose plant problems and support crop decisions. · 11:10
Resistance is usually not total, and it can erode. The Canola Council of Canada advises properly rotating resistance genes for clubroot, together with crop rotation and patch management.
Newer breeding tools, including gene editing, aim to shorten the time needed to develop resistant varieties. Rules on edited crops differ by country, so check what is approved where you farm and sell.
Best for: diseases that return year after year in your area.
2. Crop rotation
Alternating crops starves pathogens that depend on one host. The break needed varies widely. SARE’s soil guide gives one to two years for onion leaf blight and seven years for clubroot of radishes or turnips. For canola, the Canola Council recommends at least a two-year break, and longer under heavy pressure.
Rotation also helps beyond disease. USDA researchers compiled 20 long-term North American experiments and found that diverse rotations improved outcomes for whole rotations under poor growing conditions (ARS, 2024). Results depended on which crops were in the rotation.
Best for: soil-borne and residue-borne diseases, and nematodes with a limited host range. Non-host crops are the key, so check the host list for your specific pathogen.
3. Clean seed and field hygiene
Some outbreaks start with something brought in or left behind. These habits can lower the risk:
- Buy certified seed and clean planting stock from a reputable supplier.
- Clean soil off machinery before moving between fields, above all where a soil-borne disease such as clubroot is known.
- Manage or remove infected residue where the pathogen overwinters on it.
- Control weeds and volunteer plants that can host the same pathogen.
- Scout the patches where disease appeared last year first.
Best for: keeping a new disease off the farm and slowing one you already have.
4. Field conditions
Fungal and bacterial diseases often need moisture on the plant. Changes to the field can shorten those wet periods:
- Improve drainage in areas that stay wet.
- Adjust plant spacing where a dense canopy holds humidity.
- Time irrigation so that leaves dry quickly, and avoid overhead watering where a disease is active.
- Shift the planting date where it helps the crop avoid a known period of disease risk.
- Keep soil fertility balanced, and add compost or green manure to build soil organic matter.
Older practices such as intercropping and careful seed selection also belong here, and neighbors who share what they see can warn each other early. Check any change against your yield target and local advice.
Best for: irrigated crops, wet sites and high-value vegetables.
5. Biological products
Biofungicides use living organisms or natural substances to suppress disease. Plant extracts such as neem and garlic also remain in use, but homemade mixes have no label rate and uneven strength. Registered products are the safer choice, and only those should go on a commercial crop.
Check independent results before relying on one. AHDB in the UK runs trials of biofungicides in winter wheat alongside its fungicide performance work. Cornell lists several biopesticides registered for cucurbit powdery mildew that are approved for organic production.
Best for: organic systems, and programs that aim to reduce conventional fungicide use.
6. Copper and sulfur products
These older products protect the plant surface and can be allowed in organic production, subject to the certifier and the product label. US organic rules allow copper only in a way that minimizes accumulation in the soil (USDA technical report, 2022). Soil copper is worth tracking if you use it often. Sulfur can injure some crops, so read the label for crop and temperature limits.
Best for: labeled crop and disease pairs, applied before infection.
7. Synthetic fungicides
Fungicides remain an important tool when risk is high, but they work best when timed to the disease and crop stage. AHDB’s work shows how dose relates to disease control and yield, and notes that choosing better products and lower doses also supports resistance management.
Resistance is the main long-term risk. Cornell warns that resistant strains of cucurbit powdery mildew can increase rapidly during a growing season, especially when a product is used exclusively, and it has found isolates resistant to several fungicide groups. Use these habits:
- Choose by FRAC mode of action group, not by brand name.
- Alternate or mix groups as the label and local guidance allow.
- Do not repeat one group beyond the label limit.
- Get good coverage, and do not rely on sprays alone.
In the US, the pesticide label is the law, according to the EPA. Rules differ in Canada, the UK, the EU, Australia and New Zealand. Check the label and local rules, and ask a licensed adviser about rates, intervals and protective equipment.
Best for: high-risk seasons, susceptible varieties and high-value crops.
Will a spray pay on your field?
A treatment makes sense when the expected yield gain, in money, is above the full cost. Include product, application and any extra passes. Use a yield gain from local trials for your disease and variety. Gains tend to be larger under heavy disease pressure and smaller when pressure is low.
Try the numbers for your own farm below.
Calculator
Will this treatment pay for itself?
Enter your own field, costs, price and expected yield gain.
- Net return per acre (US$): 1.50
- Break-even yield gain: 6.7 bu/acre
- Total treatment cost (US$): $3,000
Example values only, set near break-even; they are not a benchmark or a forecast. Use a yield gain from local trials for your disease and variety. The crop price is an example, use today’s price. Money is shown in US$; the sums work the same in any currency if all inputs use it. This is a planning aid and not financial advice. Follow the product label and local rules.
How integrated disease management works in practice
Integrated disease management combines the options above, so that no single one carries the whole load. FAO describes integrated pest management as a way to grow a healthy crop with the least possible disruption to agro-ecosystems, while encouraging natural pest control.
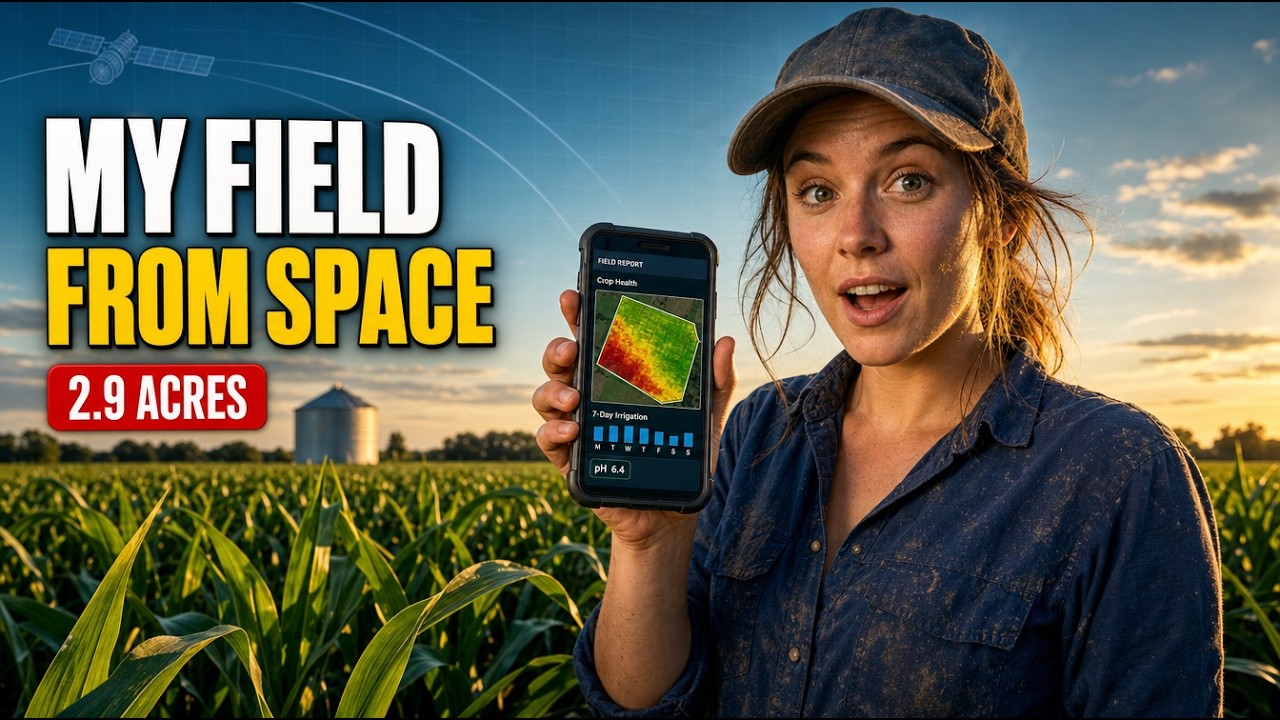
▶ How to read a satellite farm advisory, using one maize field as the example. · 9:13
Can farms use less without losing money? One large study suggests that many can. Researchers looked at 946 non-organic arable farms in a French national network and estimated that total pesticide use could fall by 42% without harming productivity or profitability in 59% of them (Lechenet and colleagues, Nature Plants, 2017). The potential was higher on farms that already used a lot. This is an estimate for those French farms, and your result may differ.
A simple season plan looks like this:
- Winter: review last season’s disease maps and lab results, then choose rotation and varieties.
- Planting: use clean seed, suitable seed treatments and sensible spacing.
- Early season: scout by crop stage, and check risk models after wet weather.
- Key crop stages: compare disease level with your threshold. Run the numbers, then treat only if justified.
- After treatment: leave an untreated strip where possible, so you can measure the real gain at harvest.
- Harvest: record yield by field zone, and check stalks and ears or pods for disease that shows up late.
That untreated strip gives you your own evidence for next year. Records also help when buyers or certification schemes ask how crop protection decisions were made.
Chart
Estimated pesticide cuts with no loss of output or profit
Average percent reduction, for the 59% of arable farms in the French network where a cut was estimated possible
Plant health treatments in forests and tree crops
Trees follow the same logic, but on a longer timeline. Sustainable forestry practices that reduce disease risk include mixed-species planting, careful selection of trees for thinning and, where it is allowed and suited to the site, prescribed burning. A wider mix of species limits the damage when one pathogen targets a single host.
Certification schemes such as FSC ask managers to document their forest management. On large areas, remote sensing and GIS help find stressed stands. Foresters then use drone or ground surveys to identify the cause. Orchards and vineyards can use the same approach block by block, and clean planting stock matters for them because they cannot rotate each year.
Benefits and limits of integrated plans
- Lower chemical reliance: fewer unneeded sprays can cut cost and reduce exposure for people, water and non-target species.
- Slower resistance: varied methods put less selection pressure on any one fungicide group.
- Lower risk in bad years: rotation and resistant varieties keep working when a spray window is missed.
- Better records: field notes and maps improve the next decision.
The limits are real. Integrated plans take scouting time and knowledge. Some benefits appear only after several seasons, and a severe outbreak can still need a rescue spray.
Related pages on our site: satellite crop monitoring, mobile apps for field checks, satellite data API, large-scale farm management, fleet and resource management, crop and product traceability, carbon footprint tracking, crop loan and insurance checks.
FAQ
What are plant health treatments?
They are the steps used to prevent or reduce plant problems, including disease. They range from resistant varieties and crop rotation to biological products and fungicides. The right choice depends on an accurate diagnosis.
What is the first thing to do when a crop looks diseased?
Identify the cause before you treat. Check the pattern in the field, look at roots and stems, and send a sample to a diagnostic lab if you are unsure. Many symptoms look like nutrient or herbicide problems.
What are the main plant disease management strategies?
The main ones are prevention through variety choice, rotation and hygiene; monitoring and thresholds; and control with biological or chemical products when needed. Using them together is called integrated disease management.
Do integrated plans always reduce pesticide use?
Not always. A French study estimated a 42% cut was possible without losses in 59% of the French arable farms studied, which leaves many farms where it was not. Disease pressure and current use both matter.
Can a satellite tell me which disease I have?
No. Satellite maps show changes in plant vigor and where to look. A field visit or lab test identifies the cause, which may not be a disease at all.
How do I keep fungicides working?
Use them only when risk justifies it, change FRAC groups as the label and local guidance allow, get good coverage and combine sprays with resistant varieties and rotation.
Farmonaut crop monitoring
See where to scout next
Draw your fields once and Farmonaut shows satellite vegetation maps through the season, on web, Android or iOS, so you can choose where to check first.



Keep reading

Sources
- Crop Protection Network, Corn Disease Loss Estimates From the United States and Ontario, Canada, 2025: cropprotectionnetwork.org
- Crop Protection Network, Soybean Disease Loss Estimates From the United States and Ontario, Canada, 2025: cropprotectionnetwork.org
- Savary et al., The global burden of pathogens and pests on major food crops, Nature Ecology and Evolution (2019): nature.com
- Lechenet et al., Reducing pesticide use while preserving crop productivity and profitability on arable farms, Nature Plants (2017): nature.com
- US EPA, Integrated Pest Management (IPM) Principles: epa.gov
- FAO, Integrated Pest Management: fao.org
- University of Kentucky, Downy Mildew of Grape, fact sheet PPFS-FR-S-13: publications.ca.uky.edu
- Mohanty, Hughes and Salathe, Using Deep Learning for Image-Based Plant Disease Detection, Frontiers in Plant Science (2016): frontiersin.org
- Cornell Vegetables, Cucurbit Powdery Mildew: vegetables.cornell.edu
- Canola Council of Canada, Clubroot Disease: canolacouncil.org
- SARE, Building Soils for Better Crops: Crop Rotations: sare.org
- USDA ARS, Diverse Crop Rotations Reduce Risk of Crop Loss Under Poor Growing Conditions (August 2024): ars.usda.gov
- AHDB, Fungicide performance in cereals and oilseed rape: ahdb.org.uk
- USDA AMS, Copper products technical report for the National Organic Program (2022): ams.usda.gov
- FRAC, By FRAC Mode of Action Group: frac.info
- US EPA, Introduction to Pesticide Labels: epa.gov
Discussion
Questions, corrections or field experience? Share them below. First-time comments are reviewed before they appear, and your email is never published.
No comments yet. Be the first to add a question or your experience.

 Nale Network
 Exurbia Geospatial
 FieldZero
 Indico Company
 Kubota
 FFBS
 Jontra
 Kalustyan
 Tucor
 Geno
 Hayleys Agriculture
 Linx Agritech
 Adinet
 Save Your Soils

 Licence holder · Niger · Gold
 Client · Tanzania · Gold










