Introduction to Satellite Data Interpretation in Agriculture
In modern agriculture, advanced crop monitoring using indices like the Normalized Difference Water Index (NDWI), Normalized Difference Red Edge Index (NDRE), and Normalized Difference Moisture Index (NDMI) is vital for maintaining optimal crop health and yield. This comprehensive guide will walk you through the process of interpreting satellite data for agriculture using various indices and tools available in mobile applications.
Understanding these indices, particularly NDWI interpretation, can significantly enhance your agricultural practices by providing crucial insights into crop health, irrigation needs, and overall field conditions. Let’s dive into the world of satellite data analysis and explore how you can leverage this technology to improve your farming decisions.
Basic Option: Quick Overview of Crop Health and Irrigation
The basic option in satellite data interpretation applications provides a straightforward analysis of crop health and irrigation status in a single image. This feature is particularly useful for farmers who need a quick assessment of their fields.
The analysis scale uses a color-coded system to indicate different field conditions:
- Green: Good crop health and irrigation
- Orange: Crop health needs attention
- Purple: Irrigation needs attention
- Red: Both crop health and irrigation need attention
- White: No crop or cloud cover
This basic analysis provides a quick snapshot of your field’s overall condition, allowing you to identify areas that may require immediate attention or further investigation.
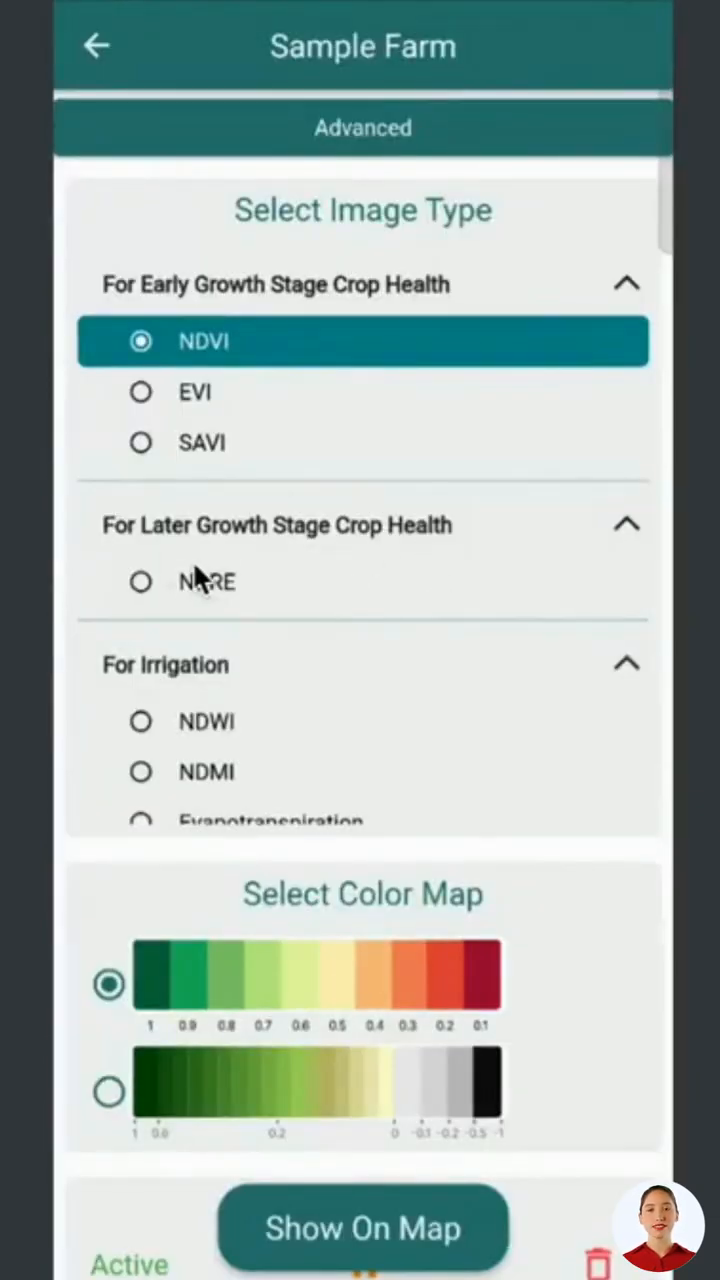
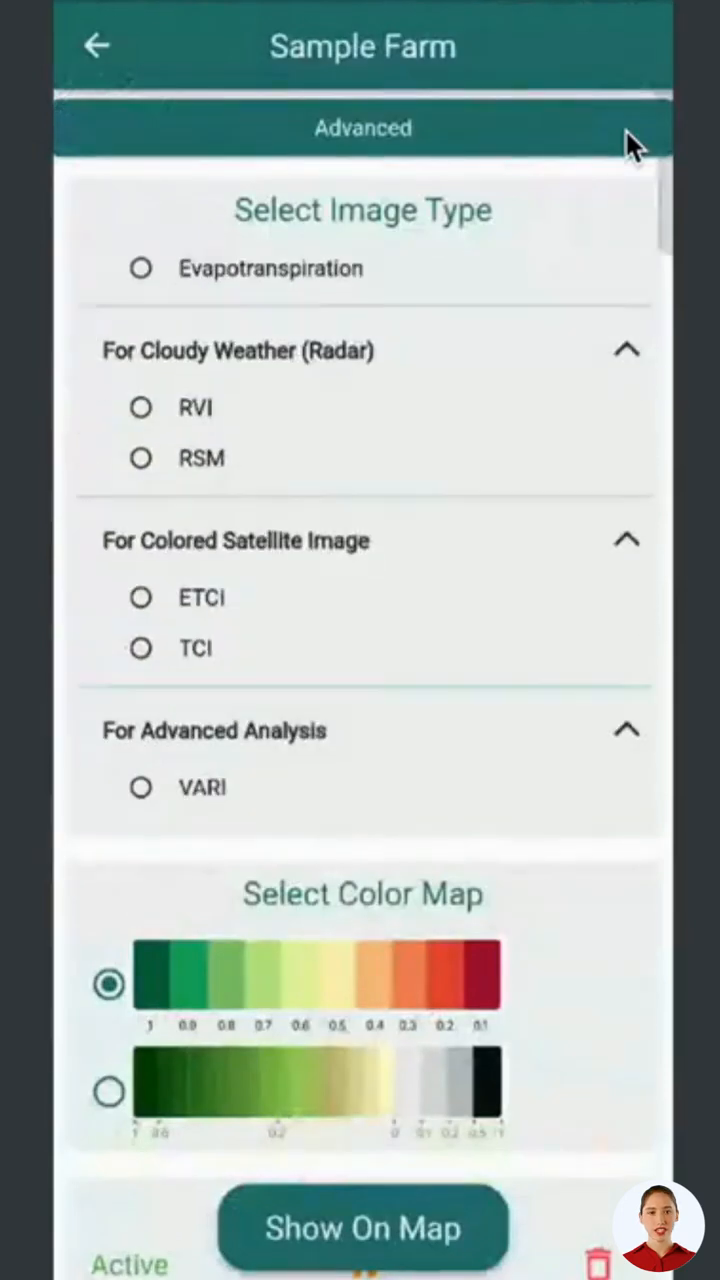
Advanced Option: NDVI for Early-Stage Crop Health
The advanced option offers more detailed analysis, particularly focusing on the Normalized Difference Vegetation Index (NDVI) for early-stage crop health assessment. NDVI is especially useful for young plants up to 3 feet tall.
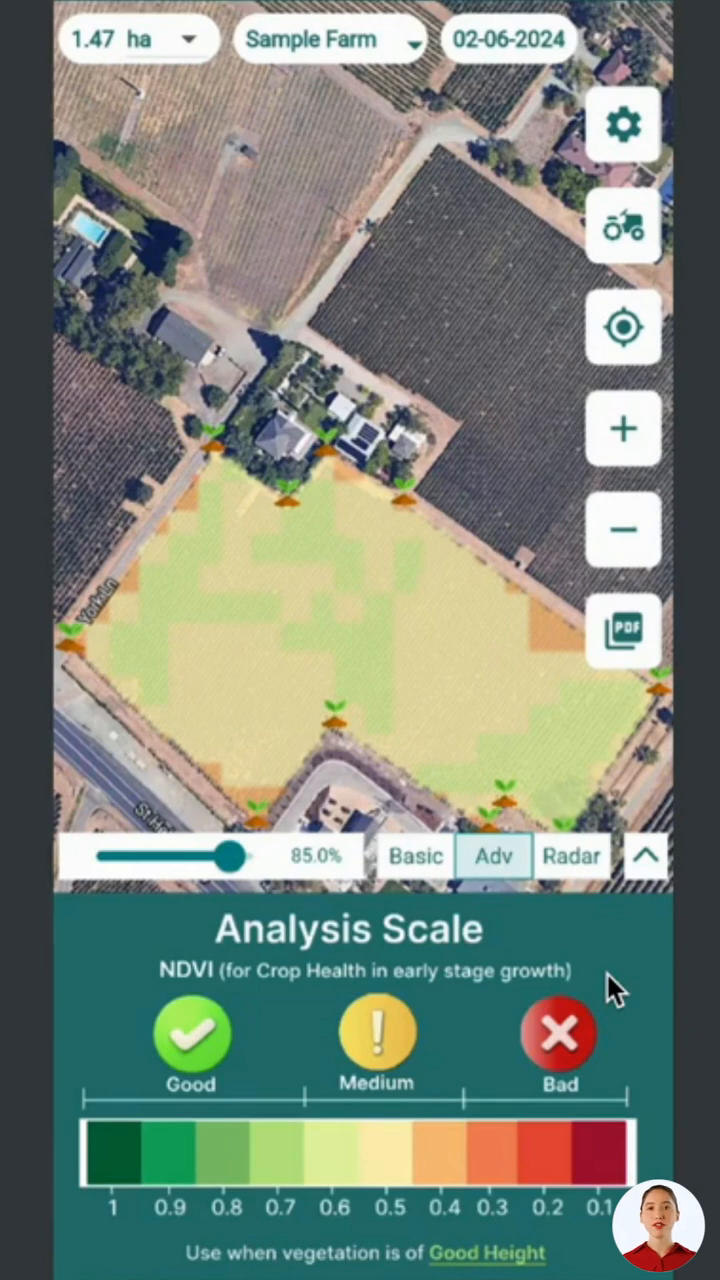
The NDVI scale uses a color gradient to indicate crop health:
- Dark green to light green: Healthy regions
- Very light green to light orange: Medium health
- Dark orange to red: Poor health
For crops in their initial stages (just sown or 10-12 days old), you can adjust the settings to select a different color map for more detailed analysis of short vegetation. After selecting the appropriate color map, click “show on map” to view a detailed analysis scale categorizing zones as good, medium, or bad.
Radar Data: Overcoming Cloud Cover and Rain
Radar data becomes invaluable during periods of cloud cover and rain when optical satellite imagery may be unreliable. Two key indices used in radar data analysis are:
- RVI (Radar Vegetation Index)
- RSM (Radar Soil Moisture)
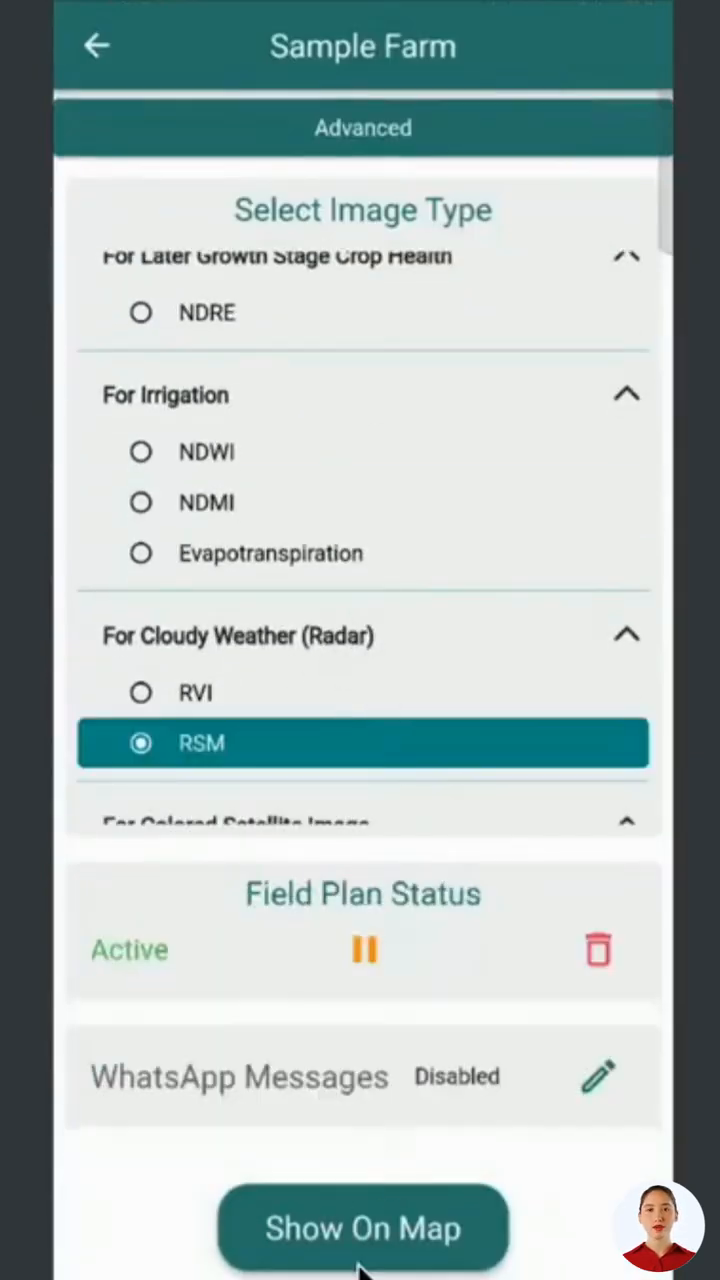
RVI assesses crop health in cloudy weather using a scale similar to NDVI. For irrigation status in these conditions, RSM provides insights with its good, medium, and bad analysis scale. These radar-based indices ensure continuous monitoring of your fields even in adverse weather conditions.
Advanced Vegetation Indices for Detailed Analysis
For more comprehensive crop health assessment, several advanced vegetation indices are available:
- EVI (Enhanced Vegetation Index)
- SAVI (Soil Adjusted Vegetation Index)
- NDRE (Normalized Difference Red Edge Index)
SAVI is particularly useful for crops with larger gaps, such as mango orchards. The NDRE index is ideal for later growth stages when crops are at least 3 feet tall, making it perfect for dense canopies like soybean or maize fields where NDVI may not penetrate effectively.
NDWI Interpretation: Understanding Water Content in Plantations
The Normalized Difference Water Index (NDWI) is a crucial tool for assessing plantation water content. NDWI interpretation provides valuable insights into the water status of your crops, helping you make informed irrigation decisions.
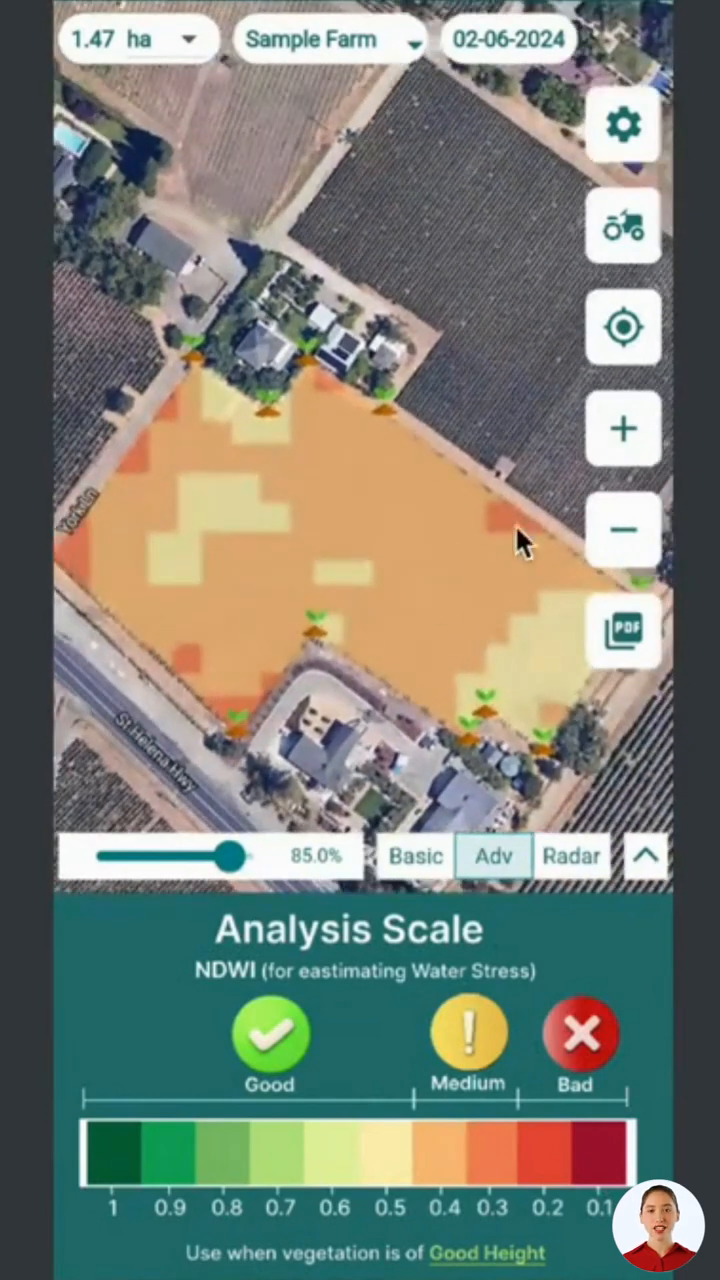
The NDWI index uses a scale similar to other indices, categorizing areas into good, medium, and bad zones based on water content. This information is vital for optimizing irrigation strategies and ensuring your crops receive the right amount of water.
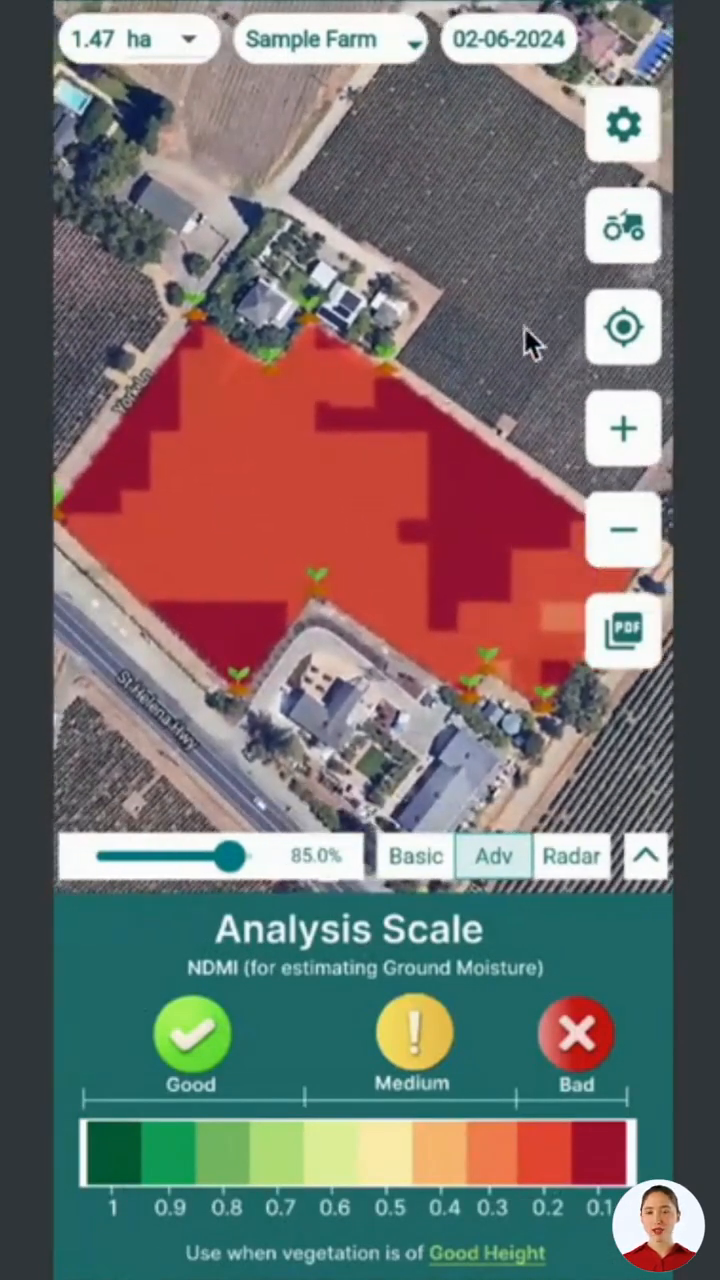
NDMI and Evapotranspiration: Soil Moisture and Water Loss
Complementing NDWI, the Normalized Difference Moisture Index (NDMI) focuses on soil moisture. NDMI interpretation helps you understand the moisture levels in your soil, which is crucial for proper crop growth and development.
Additionally, evapotranspiration data shows where water is evaporating and transpiring quickly from soil and plants. This information helps in fine-tuning your irrigation practices to minimize water waste and maximize efficiency.
Enhanced True Color Imagery: Visual Crop Assessment
Enhanced true color satellite imagery provides a visual representation of your plantations. This feature helps you understand crop presence and distribution across your fields.
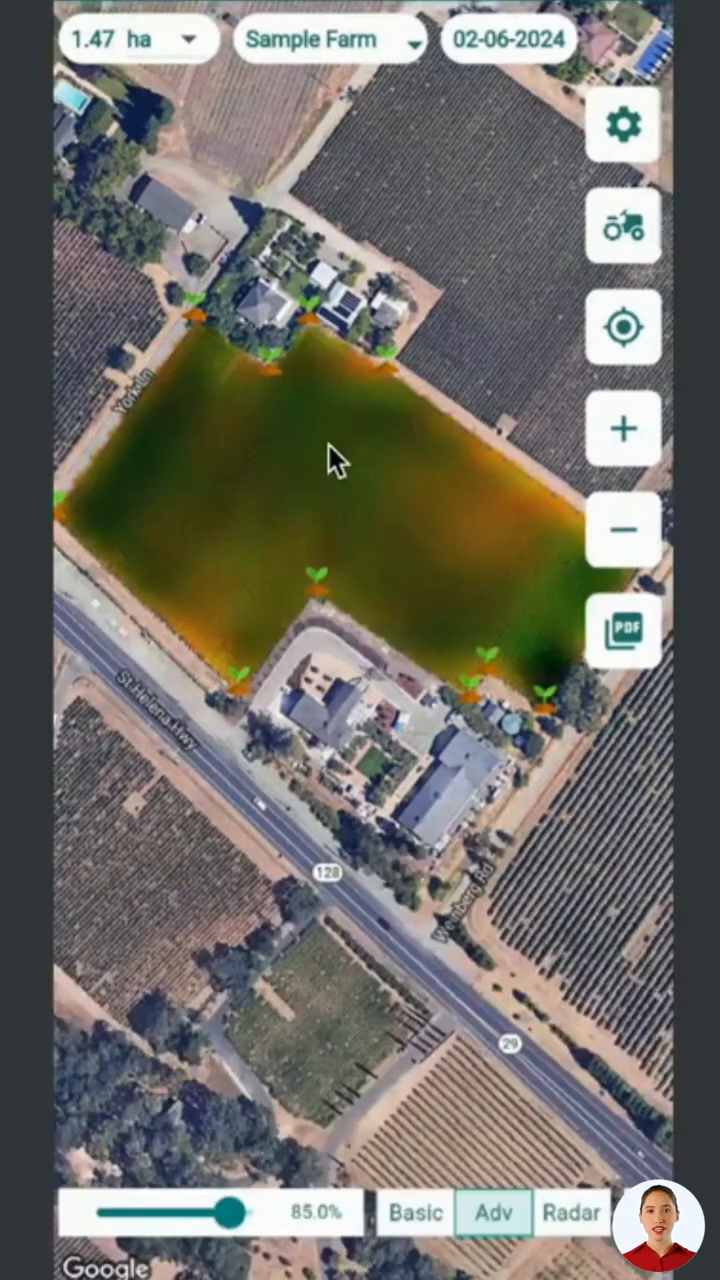
In these images:
- Green patches indicate plantation regions
- Orange patches indicate less height or no plantation
This visual data complements the numerical indices, giving you a comprehensive view of your field’s condition.
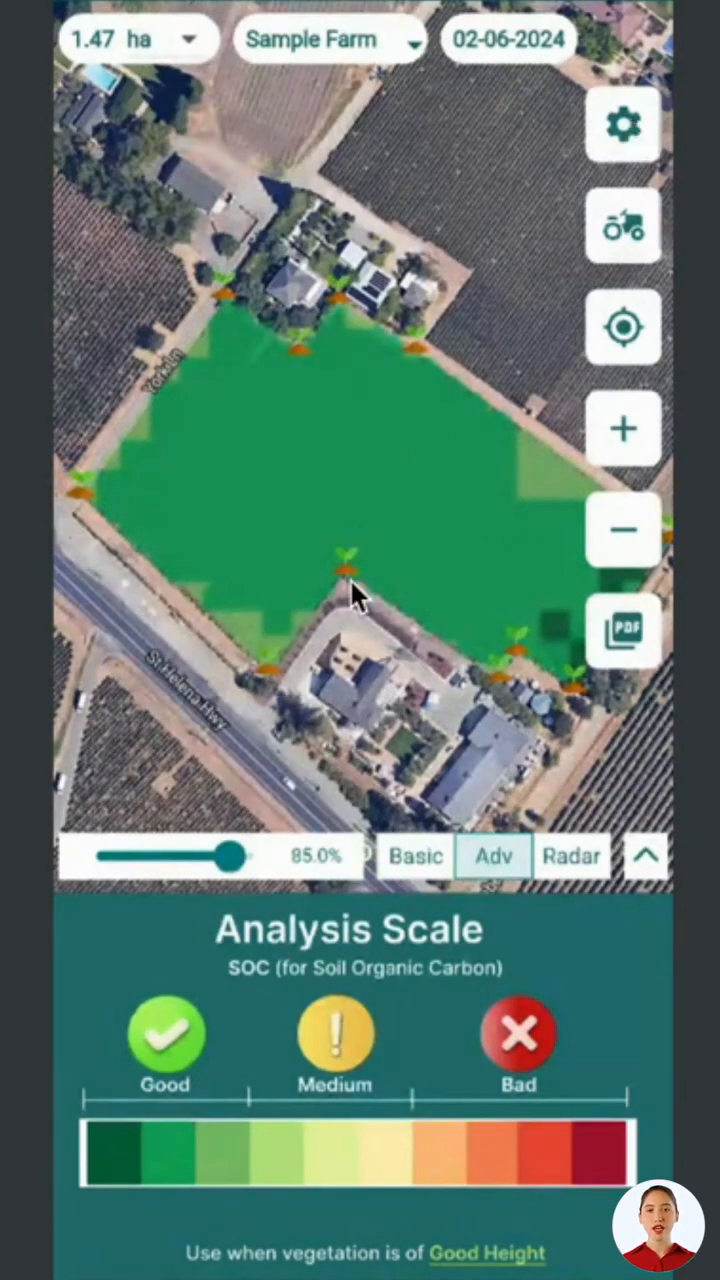
Soil Organic Carbon (SOC) Analysis
Soil Organic Carbon (SOC) analysis is a valuable tool for assessing soil health before sowing and after harvesting. This parameter helps identify areas where soil organic carbon levels are declining, indicating potential nutrient deficiencies.
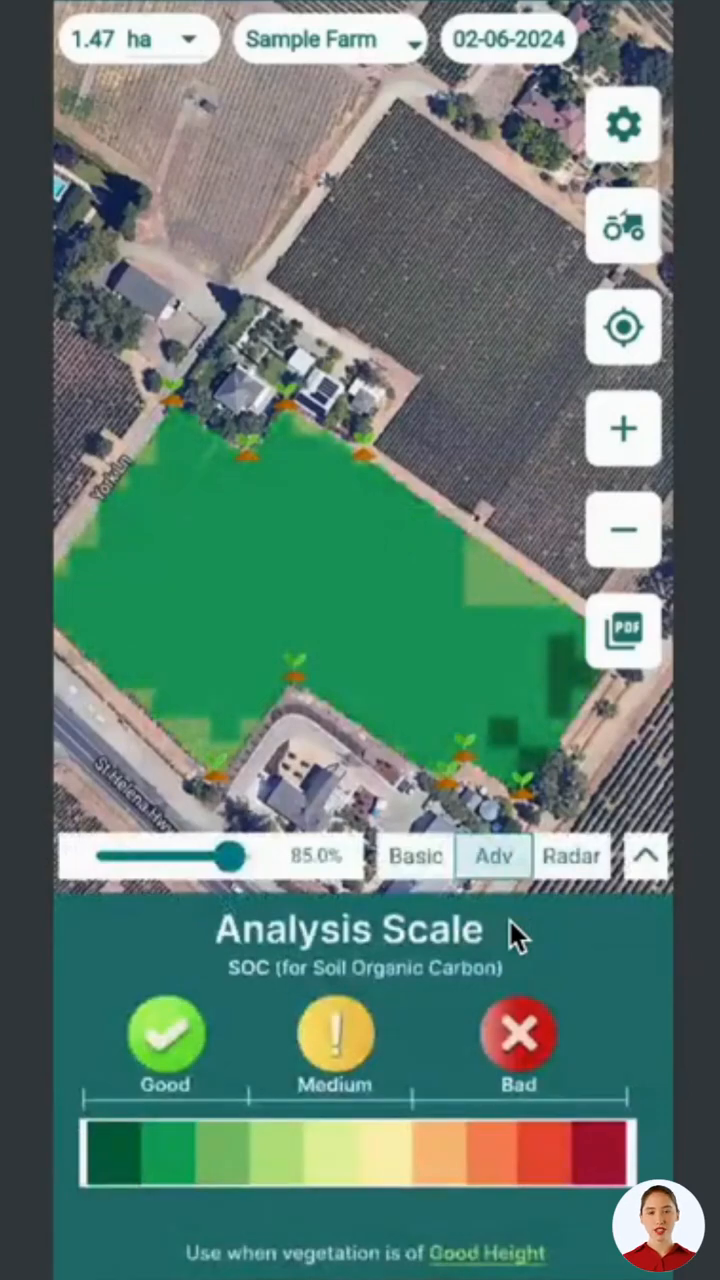
Low SOC levels suggest the need for targeted soil testing and nutrient replenishment. By using this information, you can optimize your soil management practices and ensure your crops have the necessary nutrients for healthy growth.
Digital Elevation Model (DEM) for Terrain Analysis
The Digital Elevation Model (DEM) helps understand terrain variations within your fields. This information is crucial for preventing waterlogging and managing irrigation effectively.
DEM data uses color coding to indicate different terrain levels:
- High areas
- Medium areas
- Low areas
By identifying flood-prone areas during heavy rain or excessive irrigation, you can implement preemptive measures like drainage systems to protect your crops.
Color-Blind Mode for Inclusive Analysis
To ensure accessibility for all farmers, many applications offer a color-blind mode. This feature uses black and white differentiation to simplify crop health and water stress assessment.
In this mode, black typically indicates areas needing attention, making it easier for color-blind farmers to identify and address issues in their fields.
Frequently Asked Questions (FAQ)
What is NDWI and how is it used in agriculture?
NDWI (Normalized Difference Water Index) is a satellite-derived index used to assess water content in vegetation. In agriculture, NDWI interpretation helps farmers understand the water status of their crops, allowing for more efficient irrigation management.
How does NDRE differ from NDVI?
NDRE (Normalized Difference Red Edge) is more sensitive to changes in crop chlorophyll content than NDVI. It’s particularly useful for assessing dense canopies and crops in later growth stages, where NDVI might saturate.
Can satellite data be used during cloudy weather?
Yes, radar data, including indices like RVI (Radar Vegetation Index) and RSM (Radar Soil Moisture), can provide valuable information even during cloudy or rainy conditions when optical satellite imagery is unavailable.
What’s the importance of NDMI in crop management?
NDMI (Normalized Difference Moisture Index) helps assess soil moisture levels. NDMI interpretation is crucial for optimizing irrigation schedules and preventing water stress in crops.
How often should I analyze satellite data for my fields?
The frequency of analysis depends on your crop type and growth stage. Generally, weekly or bi-weekly assessments are recommended, with more frequent checks during critical growth periods or extreme weather conditions.
Conclusion: Empowering Agriculture with Satellite Data
Mastering the interpretation of satellite data, particularly NDWI interpretation and other key indices like NDRE and NDMI, can significantly enhance your agricultural practices. By leveraging these advanced tools, you can make more informed decisions about irrigation, crop health management, and overall field optimization.
Remember that while these technologies provide valuable insights, they should be used in conjunction with on-ground observations and traditional farming knowledge. As you become more familiar with satellite data interpretation, you’ll find it an indispensable tool in your farming toolkit, helping you achieve better yields and more sustainable agricultural practices.
