In the realm of modern agriculture, satellite-based monitoring has revolutionized the way farmers manage their crops. Farmonaut’s web app for satellite agricultural monitoring offers a comprehensive solution for agri crop health management, providing farmers with valuable insights and tools to optimize their farming practices. This tutorial will guide you through the key features and functionalities of Farmonaut’s satellite agriculture monitoring platform, empowering you to make data-driven decisions for your fields.
🌱 Step 1: Getting Started with Field Management
The first step in utilizing Farmonaut’s satellite crop monitoring system is setting up your fields. This process is straightforward and user-friendly, even for those new to satellite-based monitoring in agriculture.
Adding a New Field
To begin, follow these steps:
- Click on the “Add a New Field” button
- You’ll be directed to a map interface
- Search for your field using an address or coordinates
- Alternatively, upload a KML or shape file
Once you’ve located your field, mapping it is simple:
- Tap on the boundary points of your field
- The app will create the boundary as you tap
- Click “Submit for Pre-processing” when finished
After mapping, you’ll proceed to the payment screen where you can select the number of observations you need and complete the transaction.
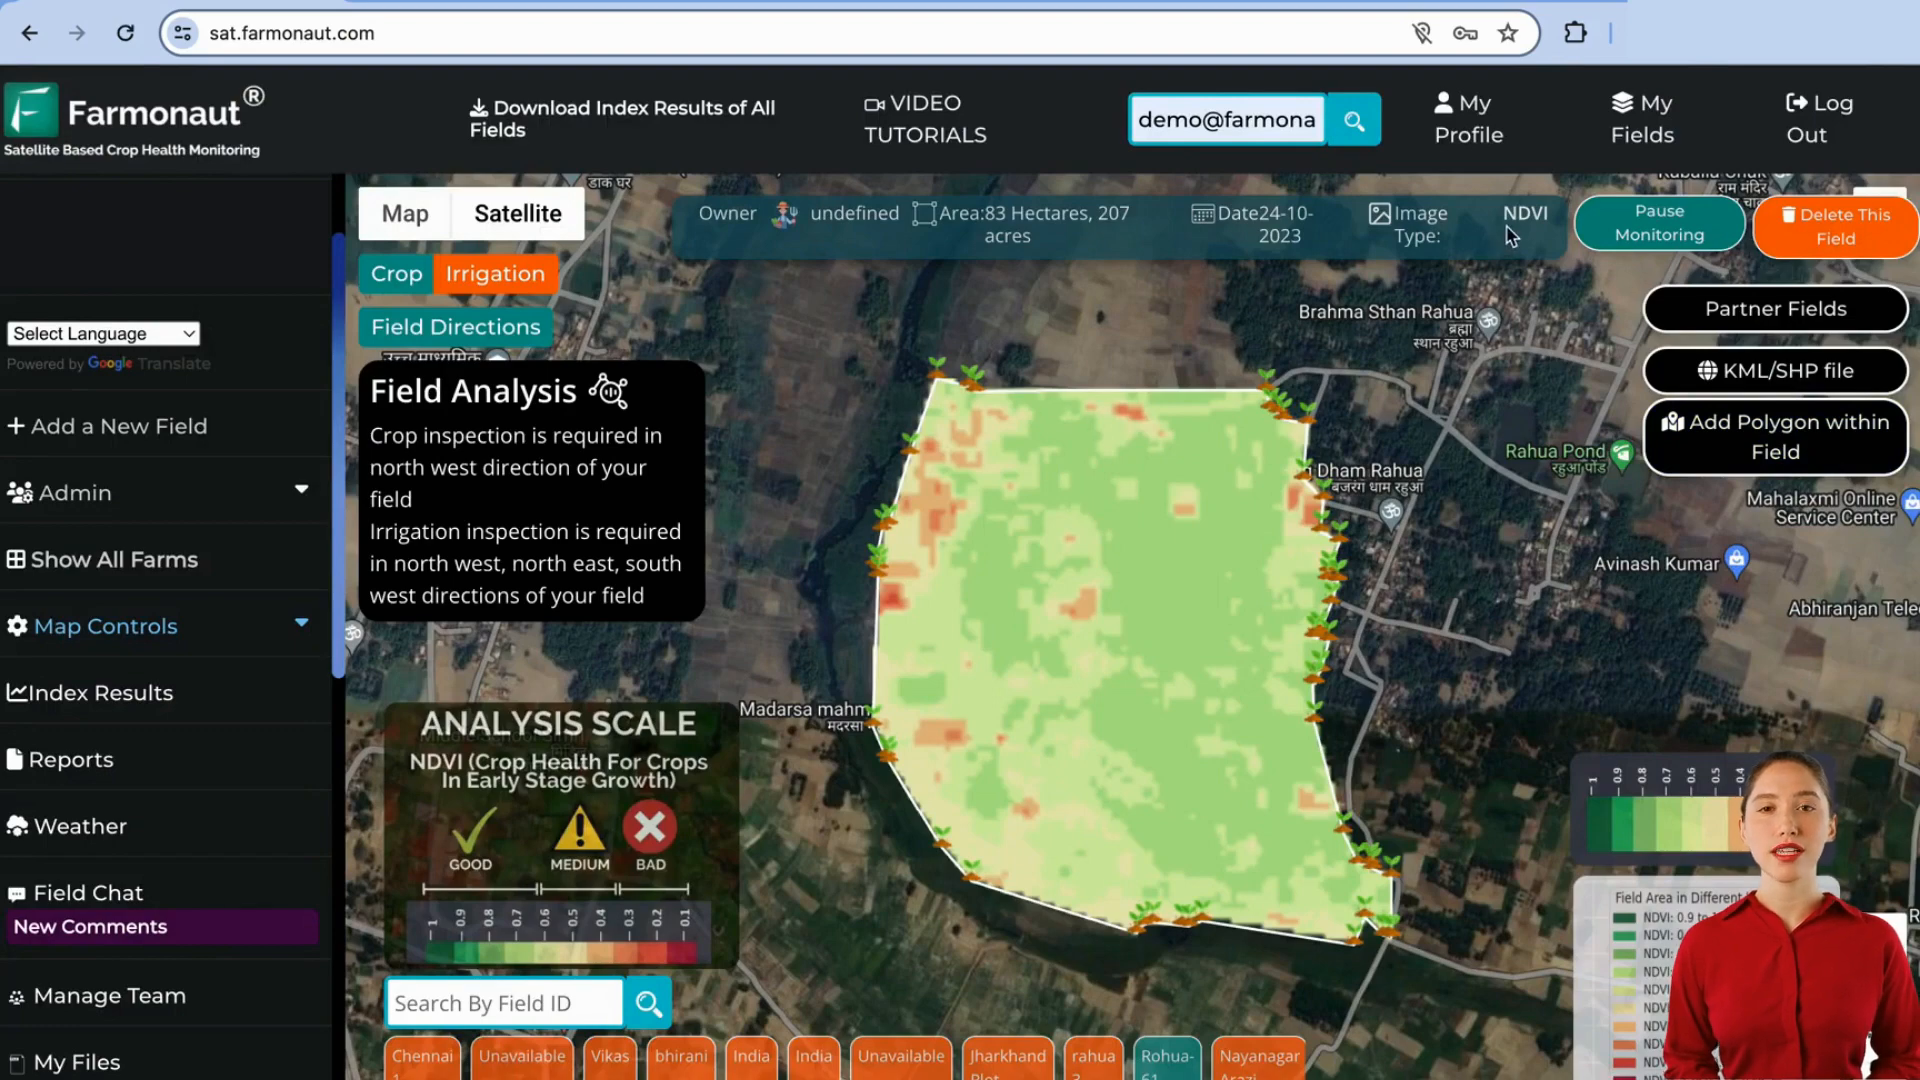
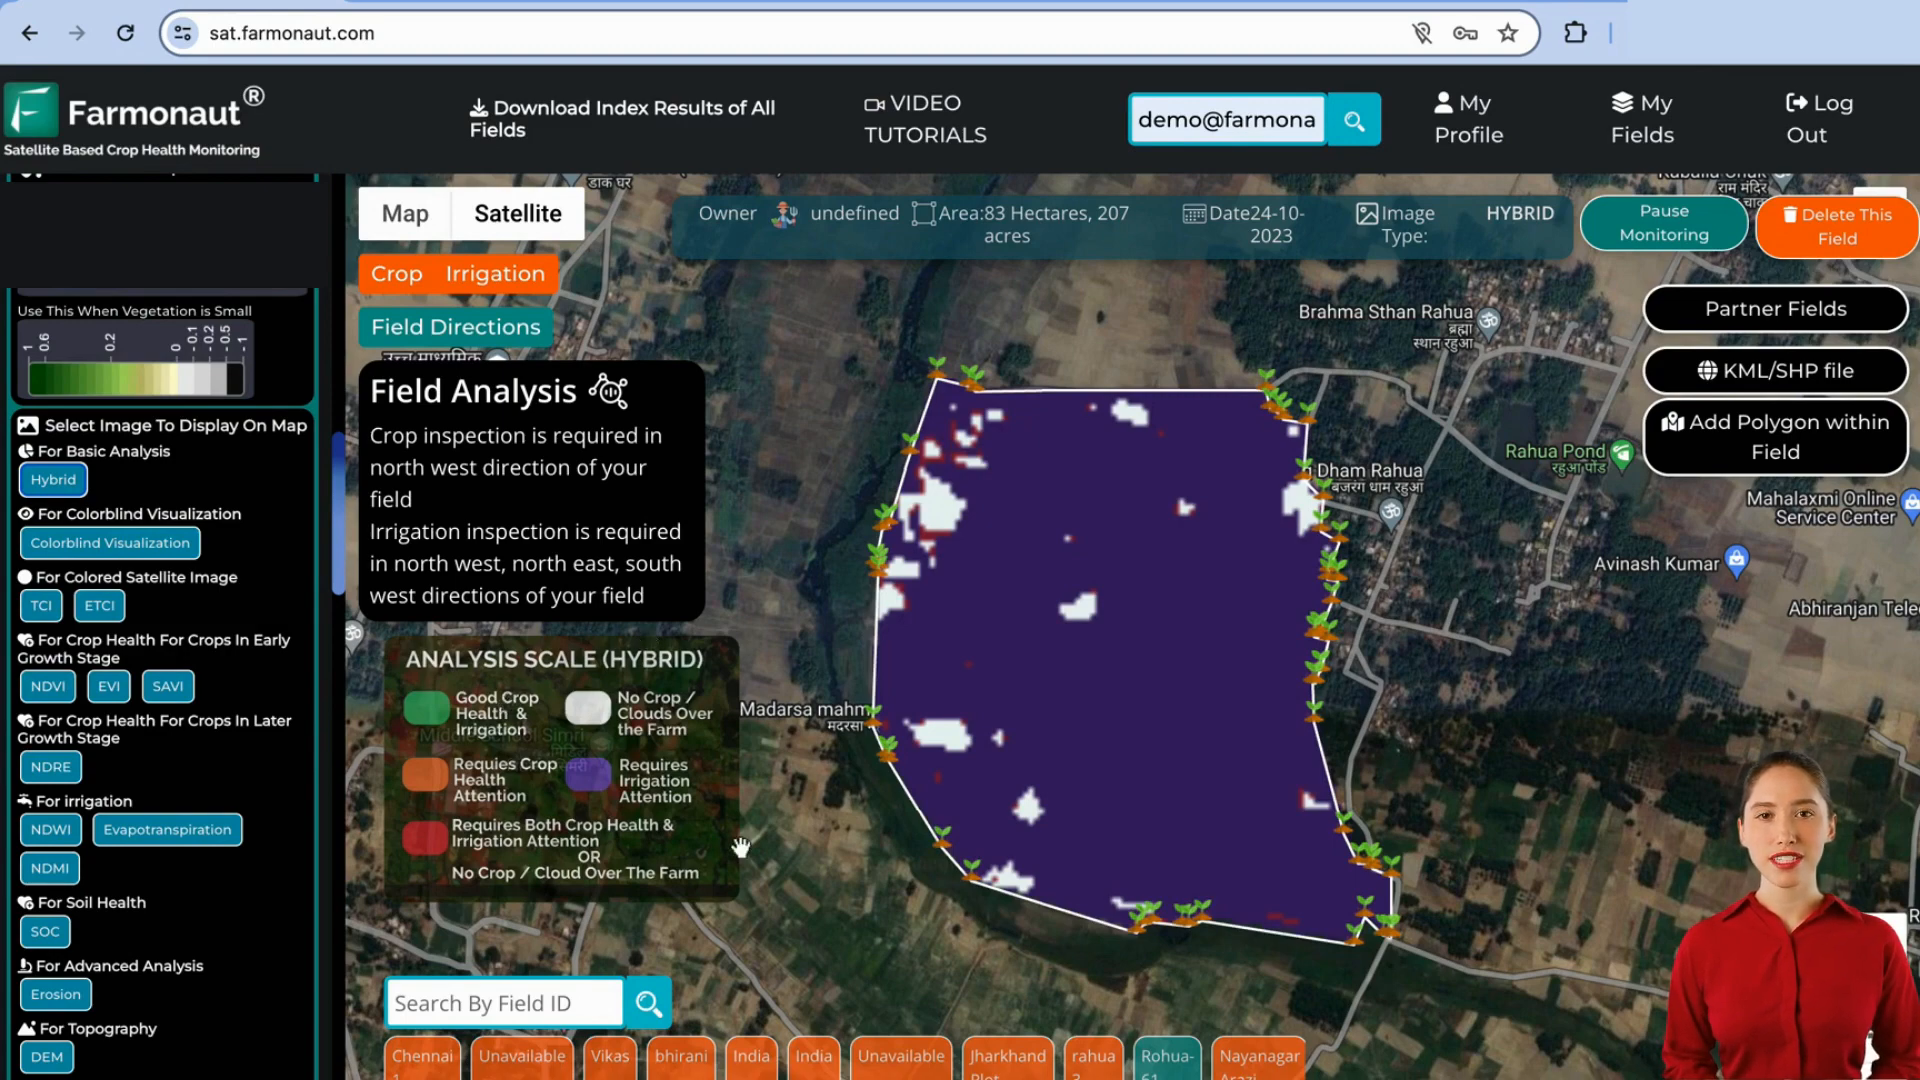
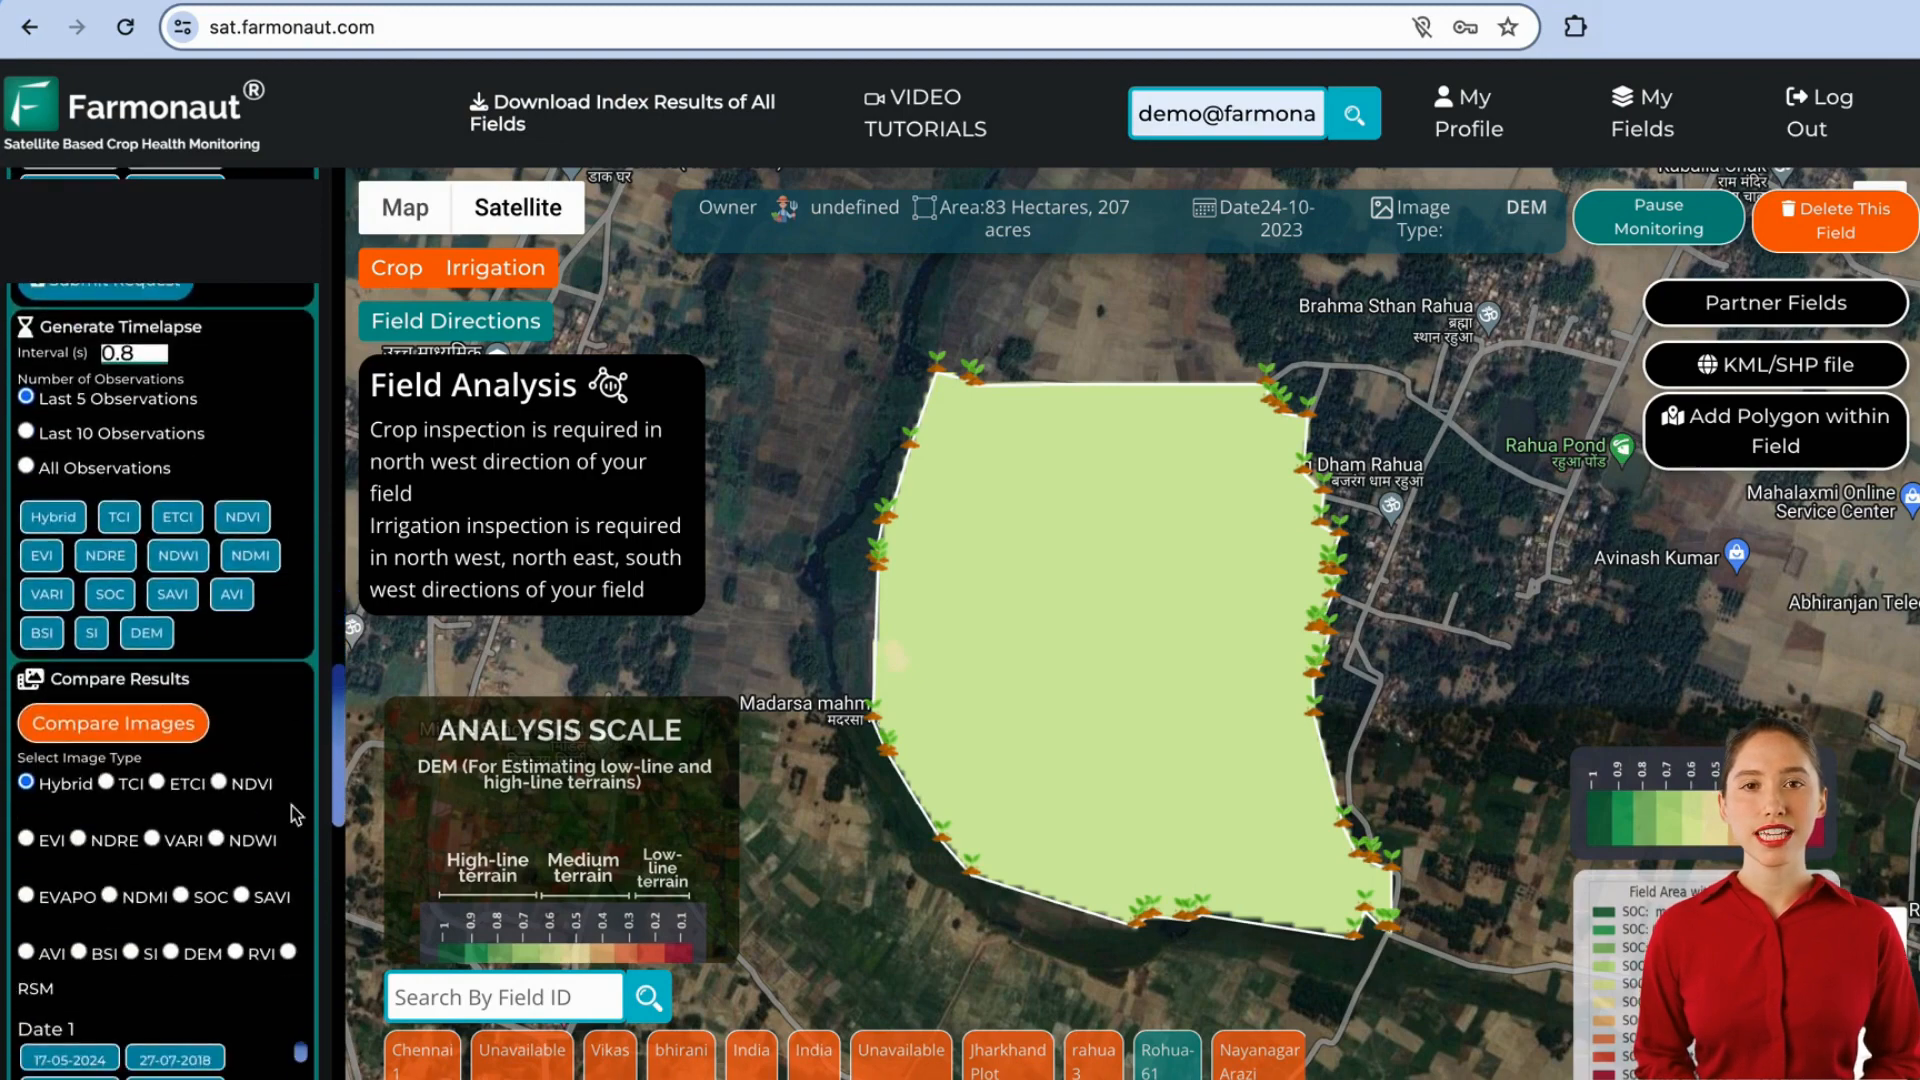
🔍 Step 2: Understanding the Analysis Scale
Farmonaut’s satellite agriculture monitoring system uses a color-coded analysis scale to make interpretation easy for farmers of all experience levels.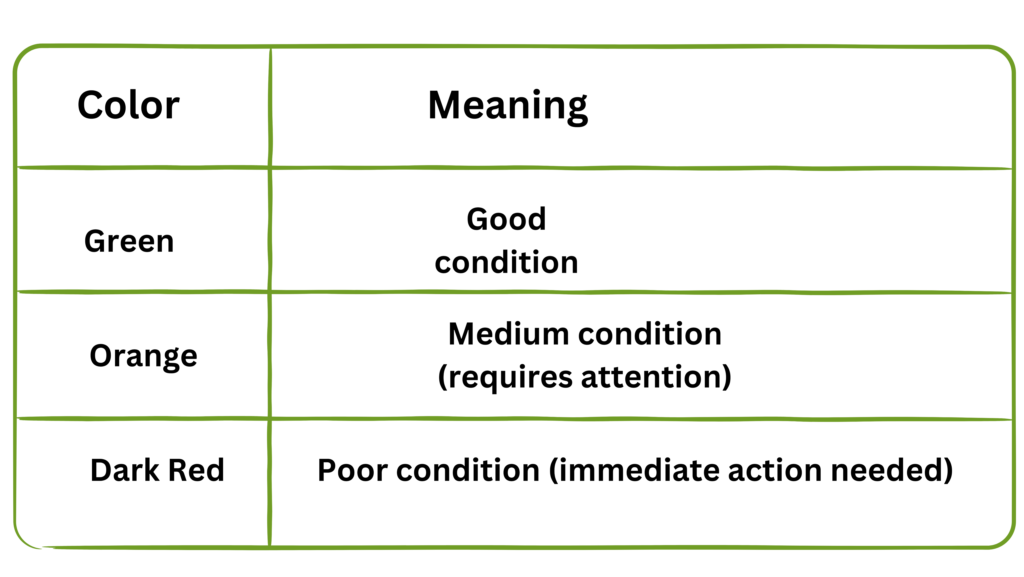
📊 Step 3: Exploring Crop Health Indices
Farmonaut’s satellite crop monitoring system offers various indices for comprehensive agri crop health management. Let’s explore the key indices:
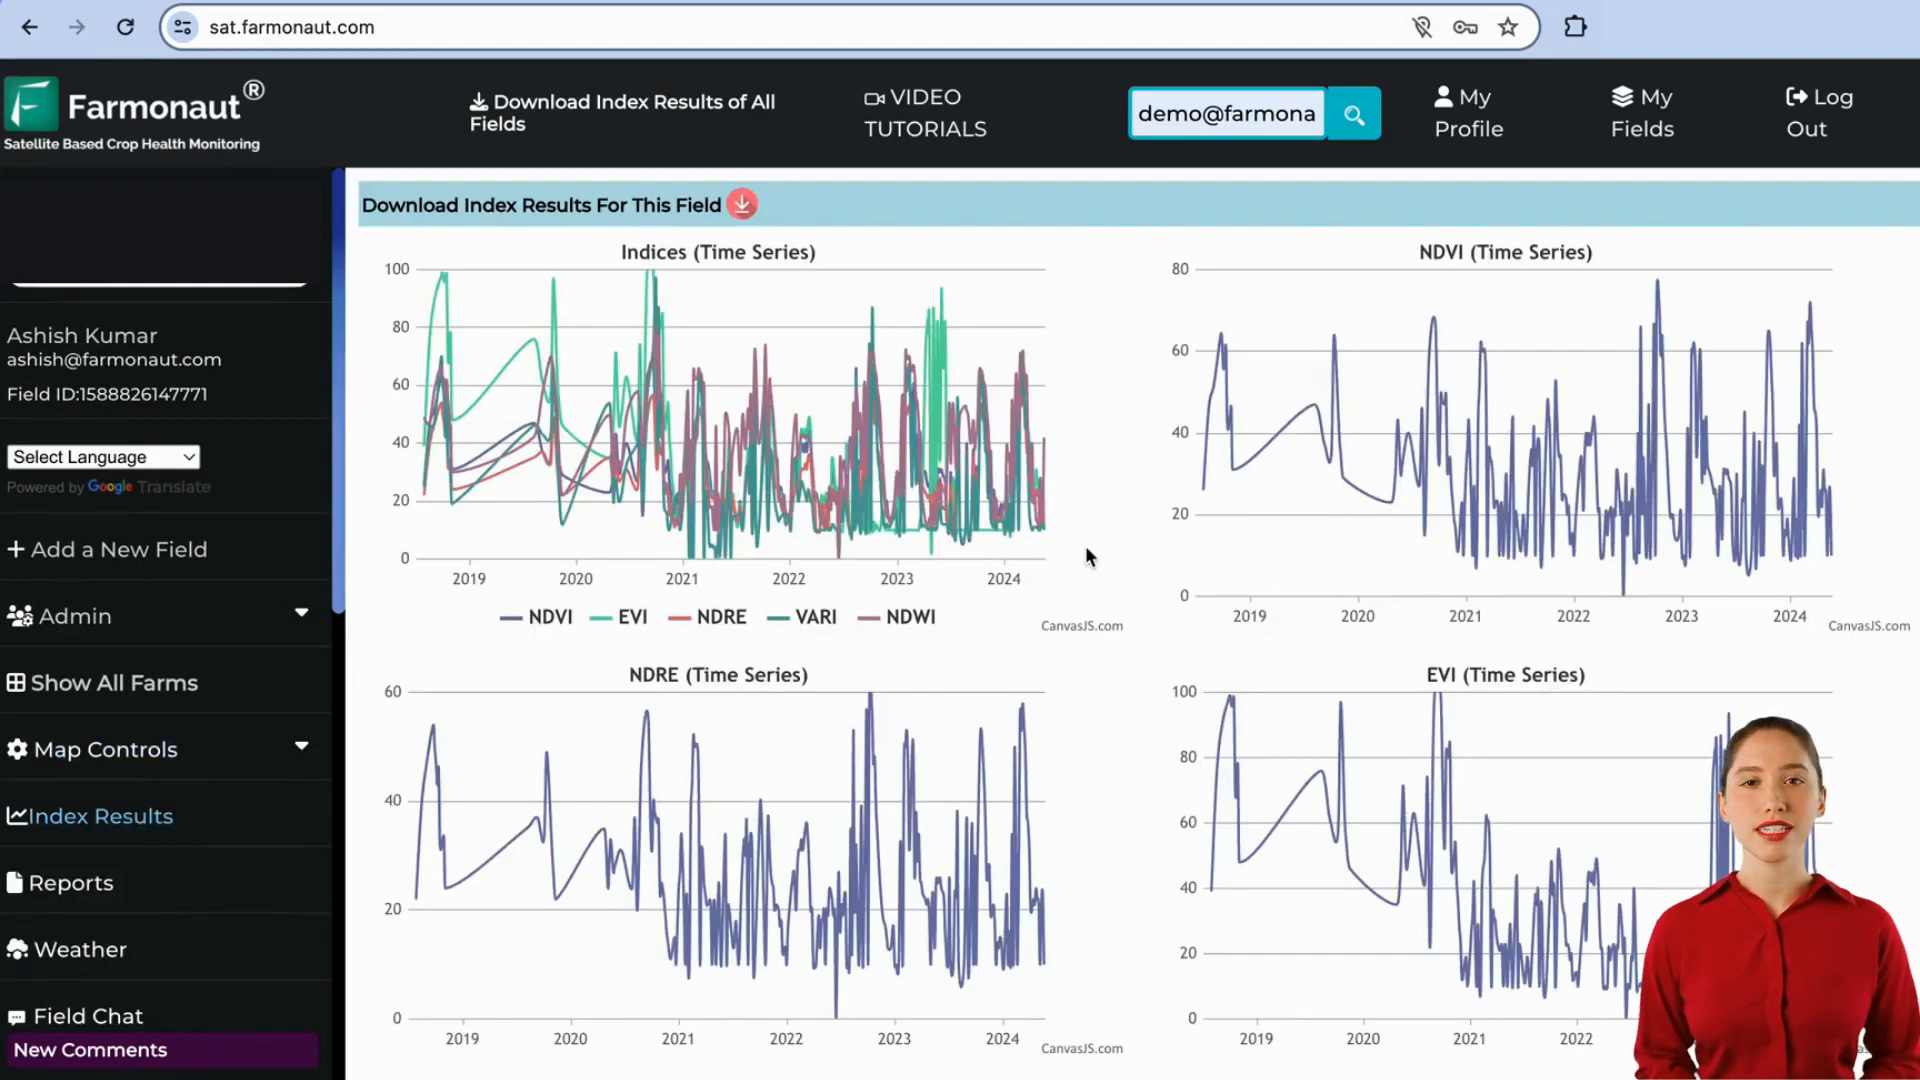
NDVI (Normalized Difference Vegetation Index)
NDVI is a crucial parameter for crop health assessment, especially in early growth stages or for crops with less dense canopies.
NDRE (Normalized Difference Red Edge)
For crops with denser canopies like soybeans or maize, or in later growth stages, NDRE is recommended for more accurate crop health assessment.
Hybrid Index
This index combines crop health and irrigation status, making it ideal for farmers who prefer a simplified overview:
- Green: Good crop health and irrigation
- Orange: Crop health requires attention
- Purple: Irrigation requires attention
- Red: Both crop health and irrigation need attention
- White: Cloud cover or no crop present
💧 Step 4: Monitoring Irrigation Status
Effective water management is crucial in agriculture. Farmonaut’s satellite-based monitoring system provides three key parameters for irrigation assessment:
- NDWI (Normalized Difference Water Index): Identifies areas with low water content
- Evapotranspiration: Measures water evaporation rate from plants and soil
- NDMI (Normalized Difference Moisture Index): Assesses soil moisture levels
By combining these three data points, farmers can gain a comprehensive understanding of their field’s irrigation status.
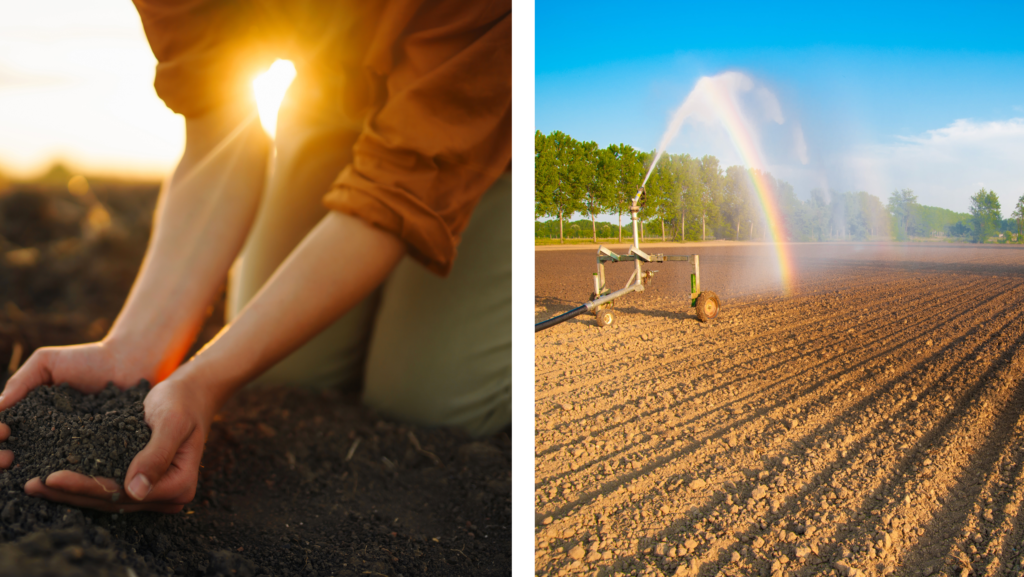
🌿 Step 5: Assessing Soil Health
Soil health is a critical factor in agri crop health management. Farmonaut’s platform includes a Soil Organic Carbon (SOC) index, which is particularly useful before sowing and after harvesting.
Strategic Soil Sampling
Instead of random soil sampling, Farmonaut recommends:
- Identify areas with low organic carbon on the map
- Take soil samples from these locations
- These areas are likely to have deficiencies in other nutrients as well

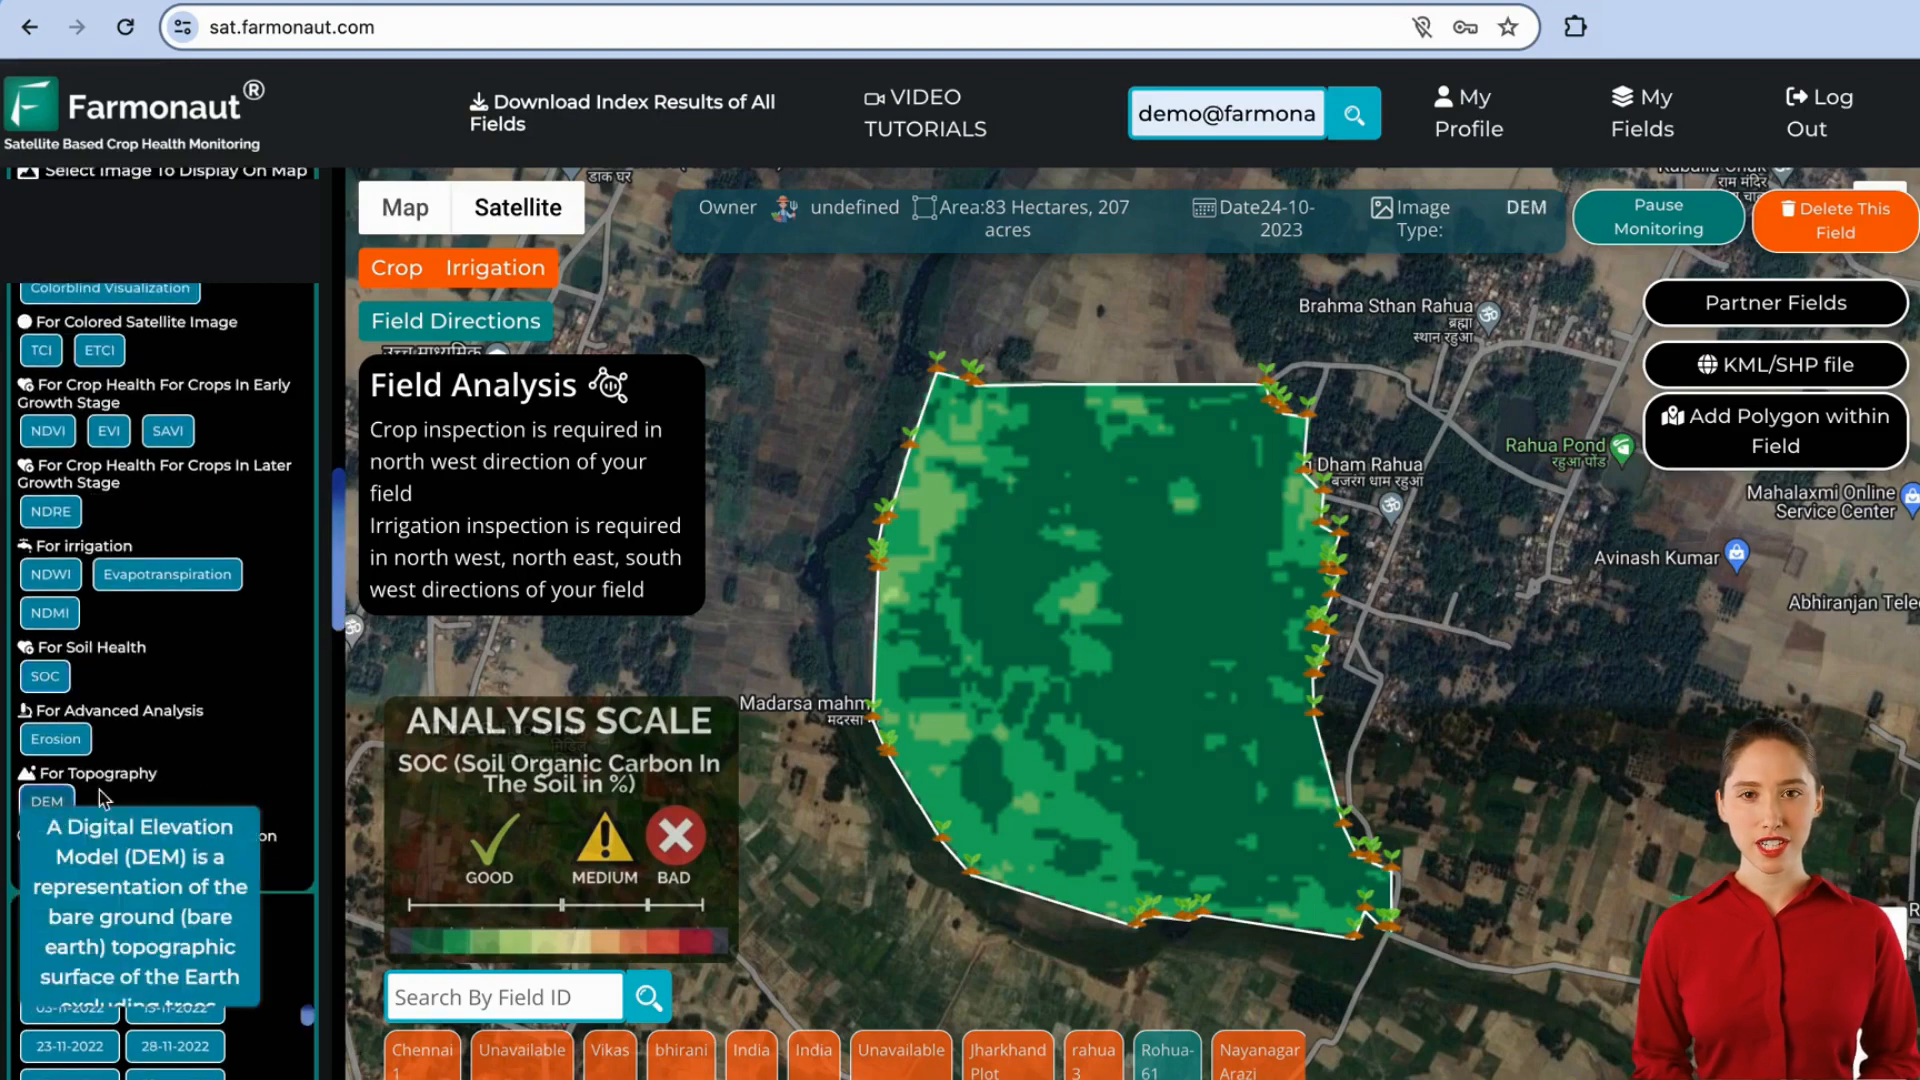
🏞️ Step 6: Utilizing the Digital Elevation Model (DEM)
The DEM feature helps farmers understand the topography of their fields:
- Identifies high, medium, and low-lying areas
- Helps predict potential water logging spots
- Allows for preemptive measures like leveling or drainage planning
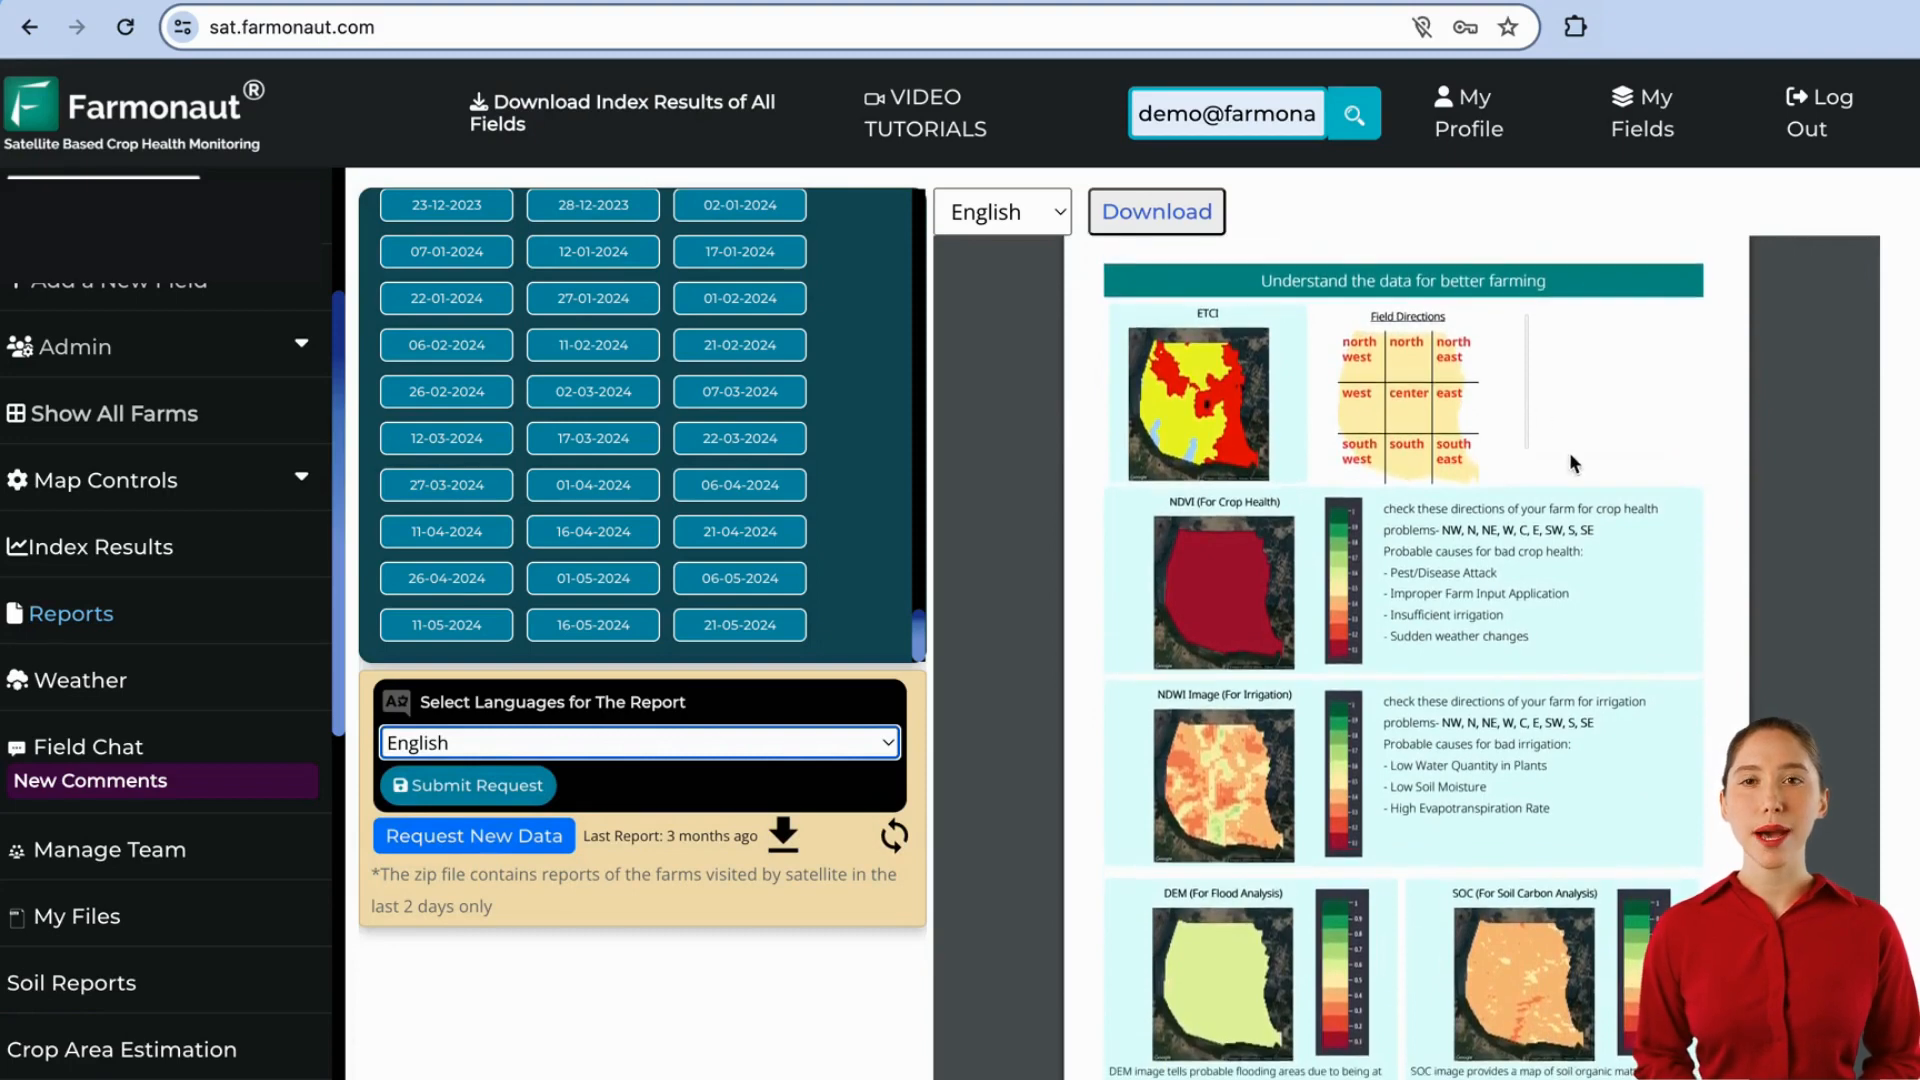
📑 Step 7: Interpreting Satellite Reports
Farmonaut’s satellite agriculture monitoring system provides regular reports based on satellite visits every 3-5 days. These reports are crucial for ongoing agri crop health management:
- Reports are delivered within 24 hours of a satellite visit
- Available via WhatsApp, dashboard, mobile apps, and email
- Include a field map divided into nine sections for easy navigation
- Highlight areas requiring attention for crop health and irrigation
🌦️ Step 8: Leveraging Advanced Features
Farmonaut’s satellite-based monitoring system goes beyond basic indices to provide comprehensive agri crop health management tools:
Radar Data for Cloud Cover
When optical satellite data is unavailable due to cloud cover, the system automatically switches to radar data (SAR – Synthetic Aperture Radar) for continuous monitoring.
Historical Data Analysis
Access satellite data from 2017 onwards to:
- Generate time-lapses
- Compare different indices side by side
- Analyze long-term trends in crop health and field conditions
🔄 Step 9: Monitoring Index Results Over Time
The Index Results section provides time series data for major indices, allowing farmers to track changes in crop health and field conditions over weeks or months. This feature is invaluable for long-term agri crop health management strategies.
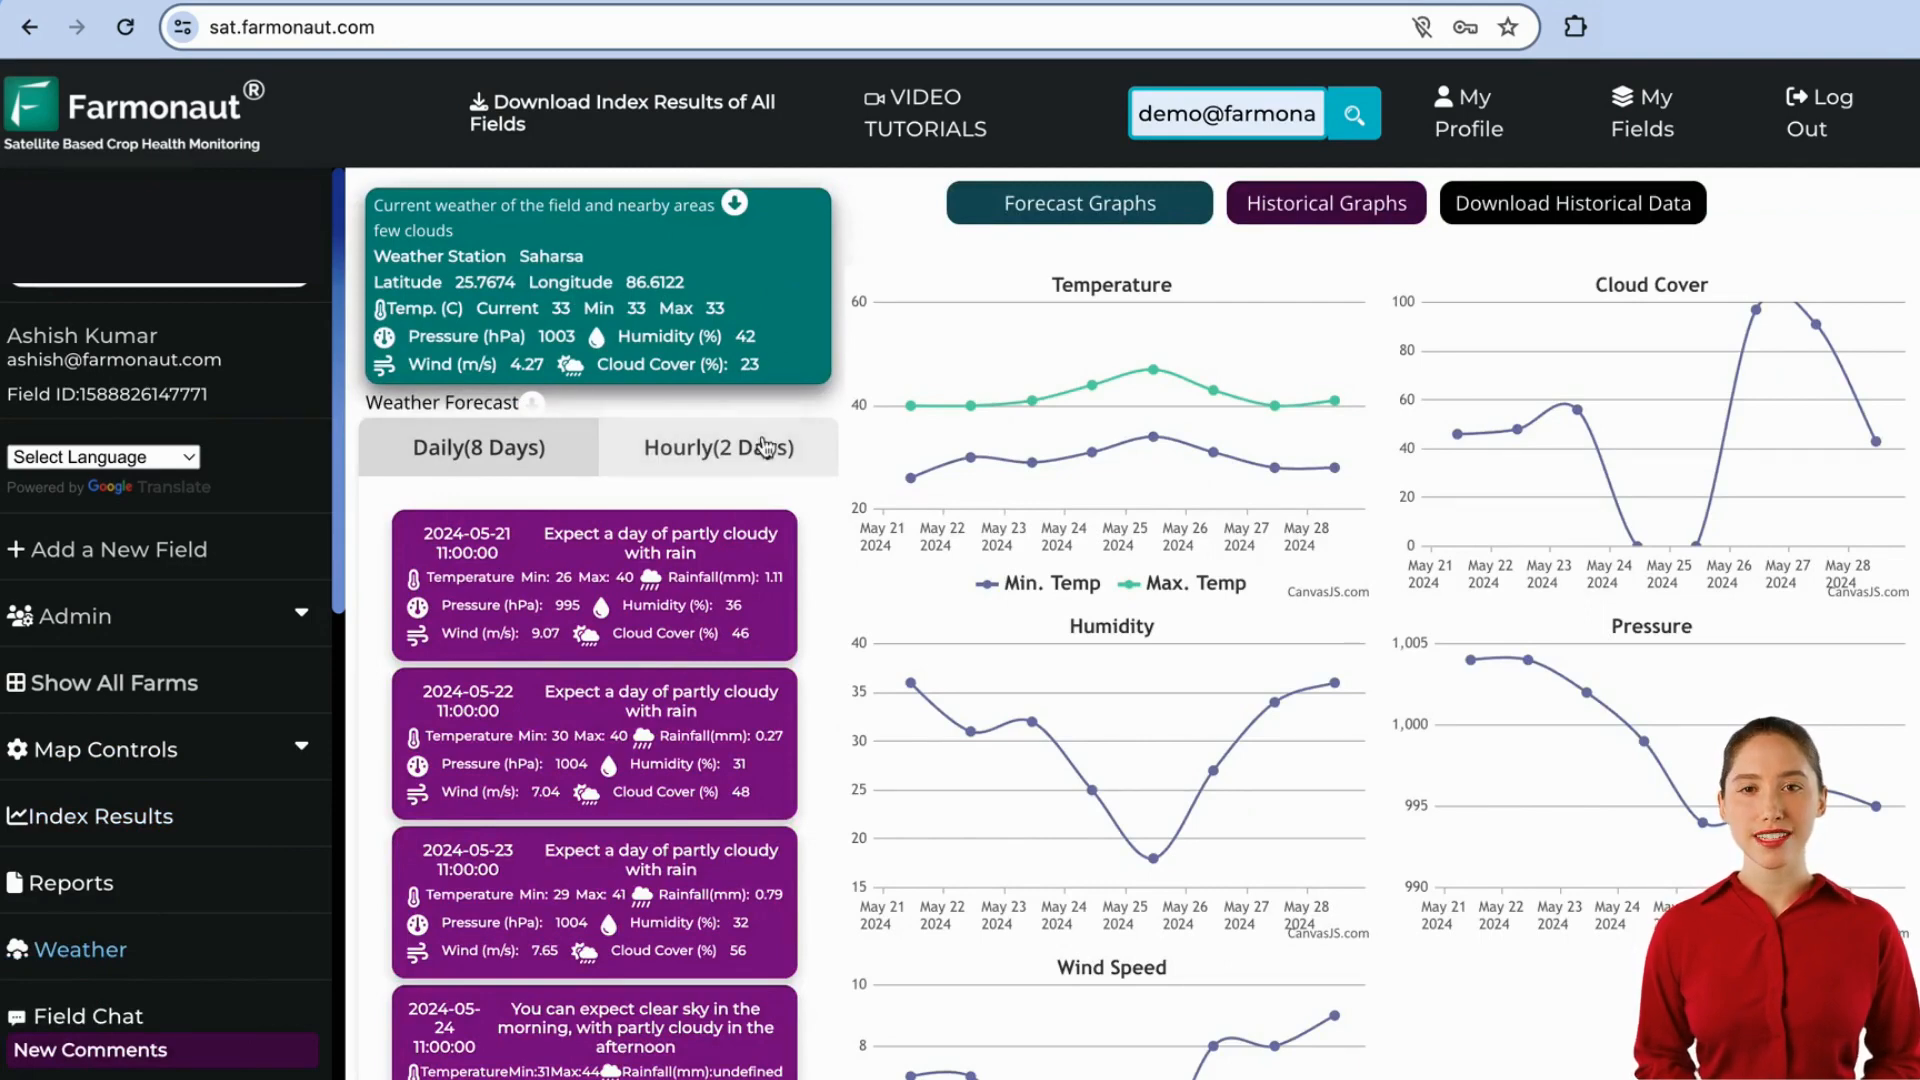
☀️ Step 10: Utilizing Weather Forecasts
Farmonaut’s platform integrates weather forecasting to support informed decision-making:
- Hourly forecasts for the next 2 days
- Daily forecasts for up to 8 days
This feature allows farmers to plan their activities in conjunction with expected weather conditions, optimizing crop management practices.
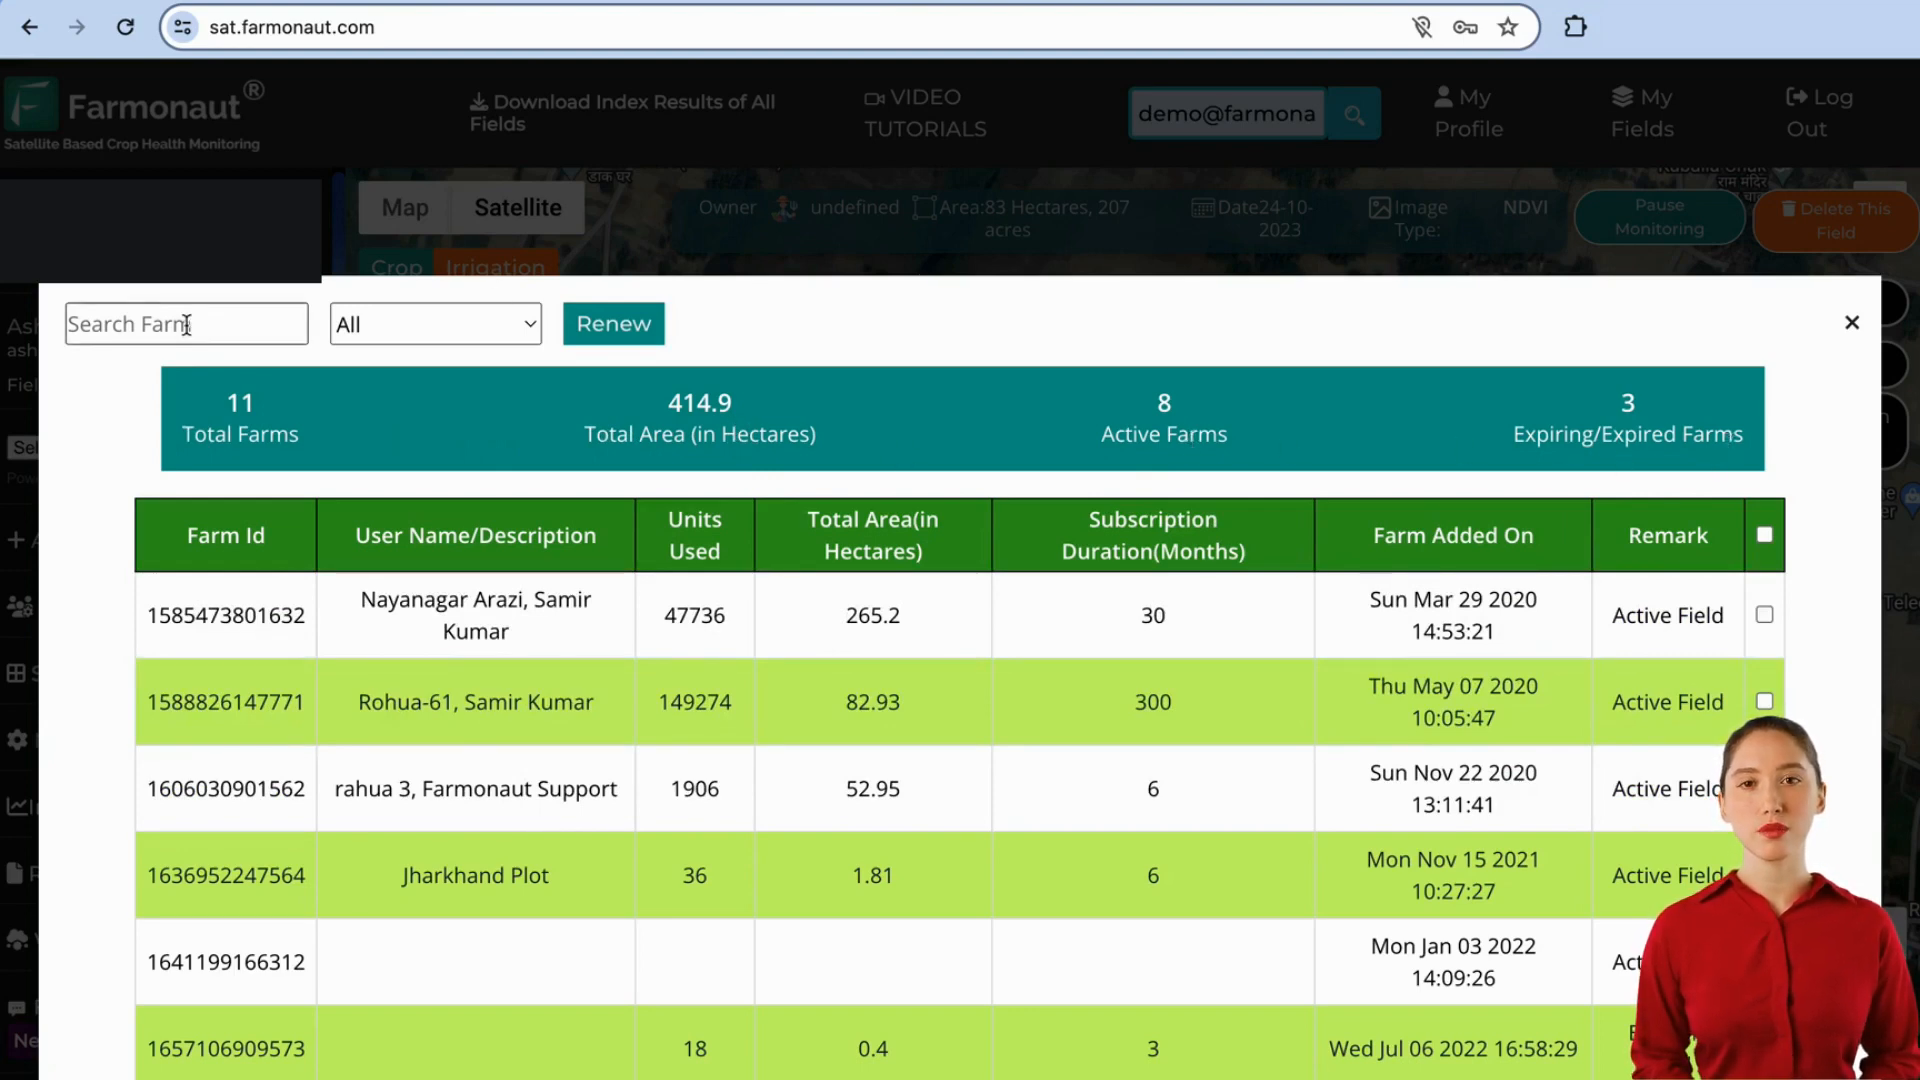
🔄 Step 11: Managing and Renewing Subscriptions
To ensure continuous access to satellite agricultural monitoring:
- Navigate to the “Show All Farms” section
- Review details like Farm ID, area, and subscription status
- Select farms for renewal
- Choose the desired subscription duration
- Complete the payment process