In today’s rapidly evolving agricultural landscape, technology integration is crucial for optimizing crop health and yields. The Farmonaut Agro admin app addresses challenges in large-scale farm management, crop health optimization, and efficient task management. By leveraging satellite data, robust analytics, and team management features, it enhances farm management capabilities and revolutionizes the way we approach agriculture.
 The app utilizes various satellite indexes, including:
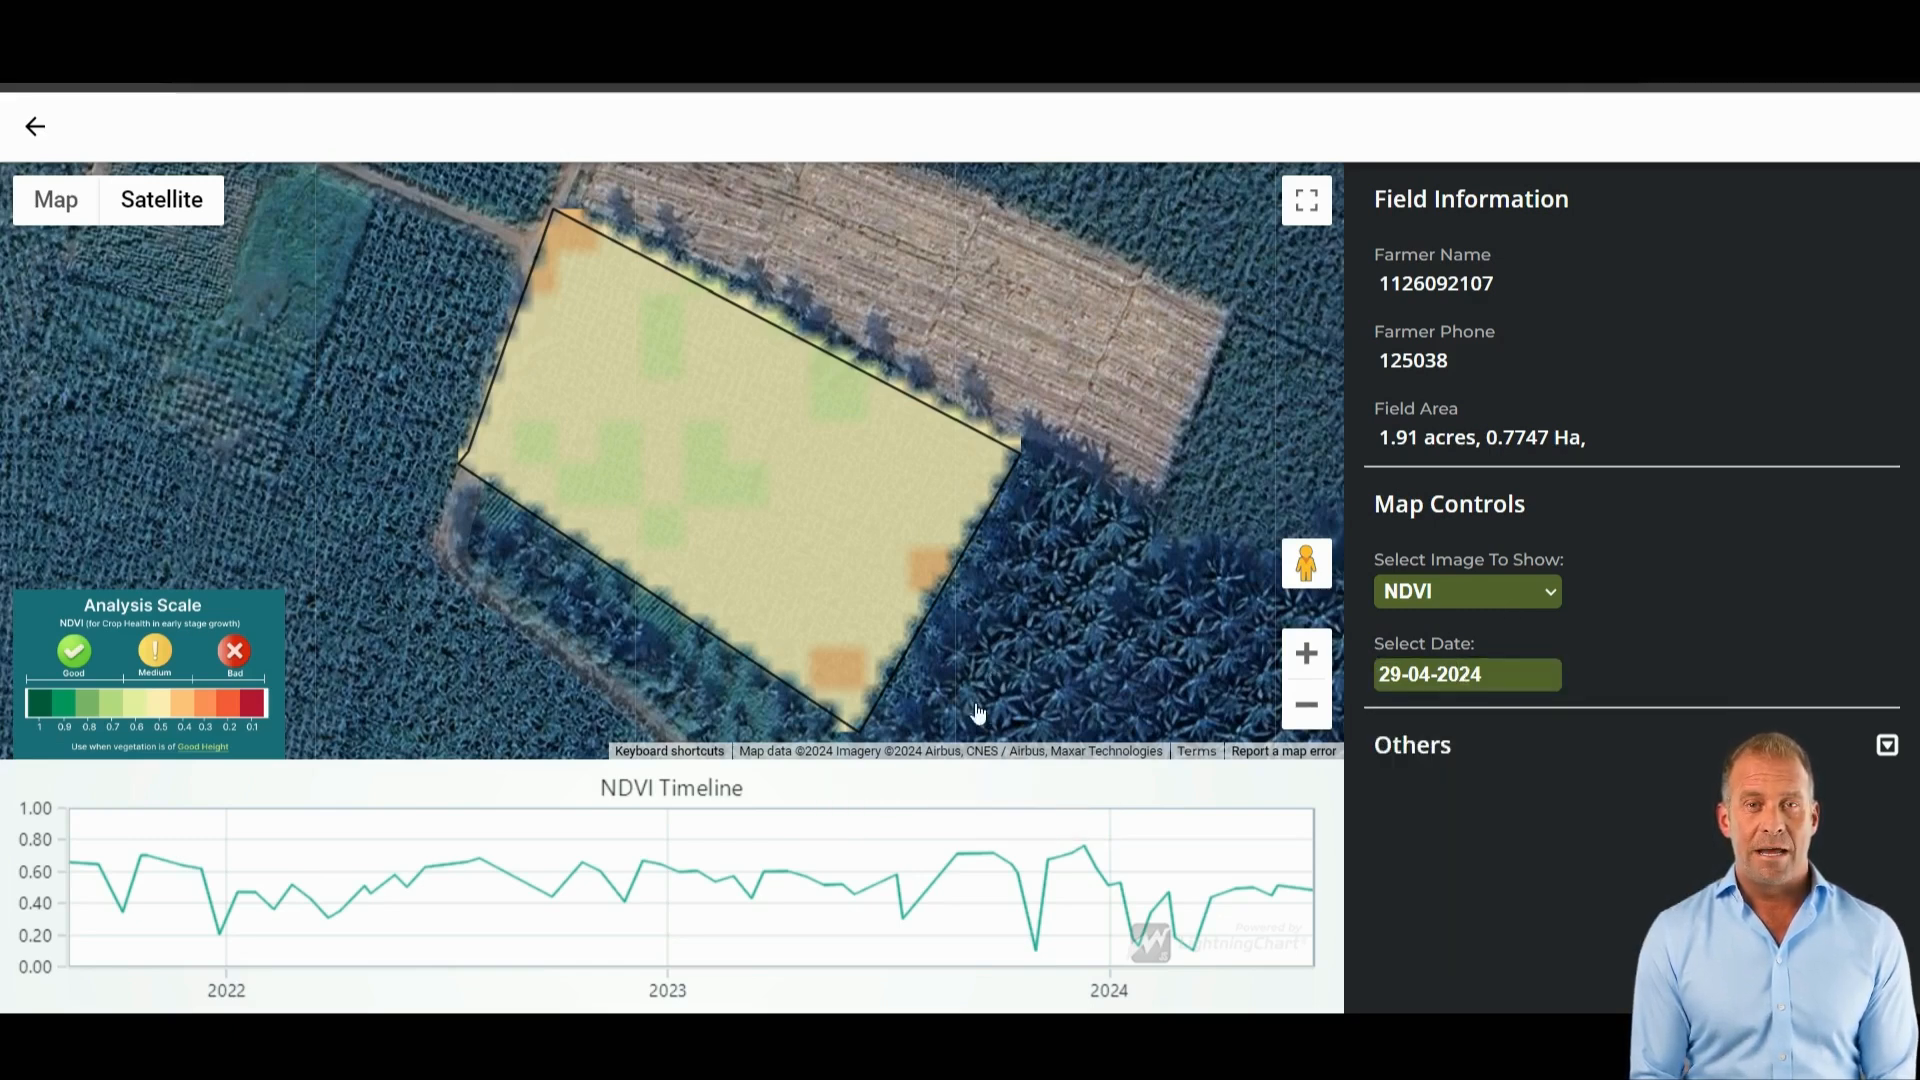
 Selecting any blue cell in the table takes users to a detailed page where they can view in-depth information about a specific field. This includes satellite visit dates and index values, providing a comprehensive overview of the field’s health and status.
 The color-coded scale on the Field Analysis page helps users easily interpret the data, allowing them to identify areas needing attention and take proactive measures to address issues before they escalate.
 Users can view data by the number of fields or percentage of fields, and filter data by location (state, district, or village) and time period (weekly, monthly, or custom date range). Additionally, data can be grouped by different region levels to gain insights into specific areas, such as individual districts within a state.

 This flexible task management system ensures that all team members are on the same page and can efficiently complete their assigned tasks, leading to improved farm management and productivity.
 These features ensure that team members have access to the relevant data and resources they need to perform their tasks effectively, contributing to overall farm management efficiency.

Understanding the Normalized Difference Vegetation Index (NDVI)
At the heart of the Farmonaut Agro admin app’s capabilities lies the normalized difference vegetation index (NDVI). This powerful tool is essential for monitoring crop health and optimizing agricultural practices. But what is normalized difference vegetation index, and how does it work? The normalized difference vegetation index formula is a simple yet effective method for quantifying vegetation by measuring the difference between near-infrared (which vegetation strongly reflects) and red light (which vegetation absorbs). The formula is:NDVI = (NIR – Red) / (NIR + Red)Where NIR is the near-infrared reflectance and Red is the red reflectance. This formula produces values between -1 and 1, with higher values indicating healthier vegetation. The NDVI is crucial for identifying healthy vegetation. Typically, NDVI healthy vegetation values range from 0.3 to 0.8, with higher values indicating denser and healthier plant growth. This index is invaluable for farmers and agronomists in assessing crop health, predicting yields, and making informed decisions about irrigation and fertilization.
Field Analysis: The Central Hub for Satellite Data
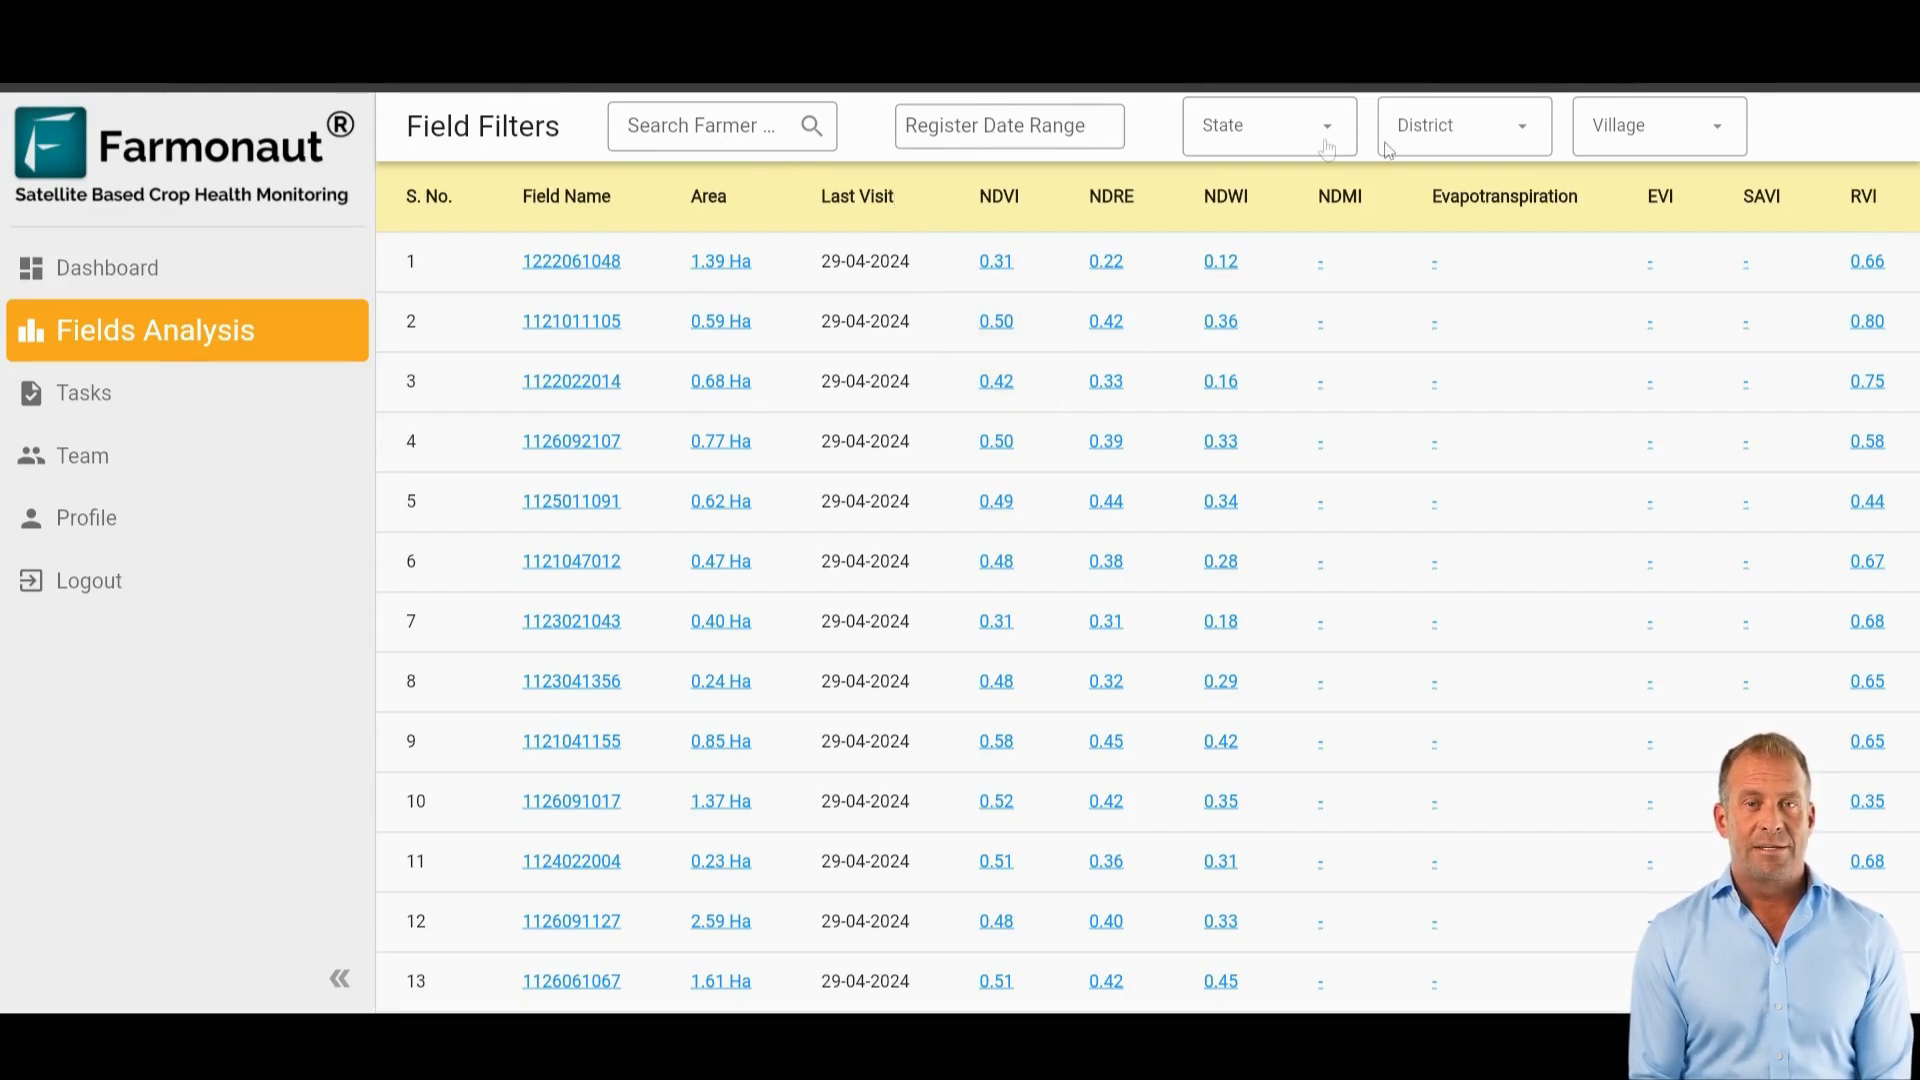
The Field Analysis page serves as the epicenter for accessing and interpreting satellite data. Here, users can find a comprehensive list of all their farms, complete with the latest satellite data and additional metadata displayed in a user-friendly table format. This feature allows for near real-time insights into the status of farms, including:- Crop health assessment
- Irrigation level monitoring
- Pest infestation detection
- Soil moisture analysis
The app utilizes various satellite indexes, including:
- NDVI (Normalized Difference Vegetation Index)
- NDWI (Normalized Difference Water Index)
- Enhanced Vegetation Index
Navigating the Field Analysis Page
The Field Analysis page is designed for ease of use and quick access to crucial information. Key features include:- Search bar for locating specific farms
- Filtering options based on location or registration date
- Color-coded data for easy interpretation
- Detailed information pages for each field
Selecting any blue cell in the table takes users to a detailed page where they can view in-depth information about a specific field. This includes satellite visit dates and index values, providing a comprehensive overview of the field’s health and status.
Making Data-Driven Decisions with Satellite Insights
The normalised difference vegetation index and other satellite-derived data provide real-time insights that enable farmers to make informed, timely decisions. This technology optimizes resource use, increases yields, and mitigates risks, ultimately enhancing productivity and sustainability in farming operations. Key benefits of using satellite data include:- Early detection of crop stress
- Precise irrigation management
- Targeted pest and disease control
- Optimized fertilizer application
The color-coded scale on the Field Analysis page helps users easily interpret the data, allowing them to identify areas needing attention and take proactive measures to address issues before they escalate.
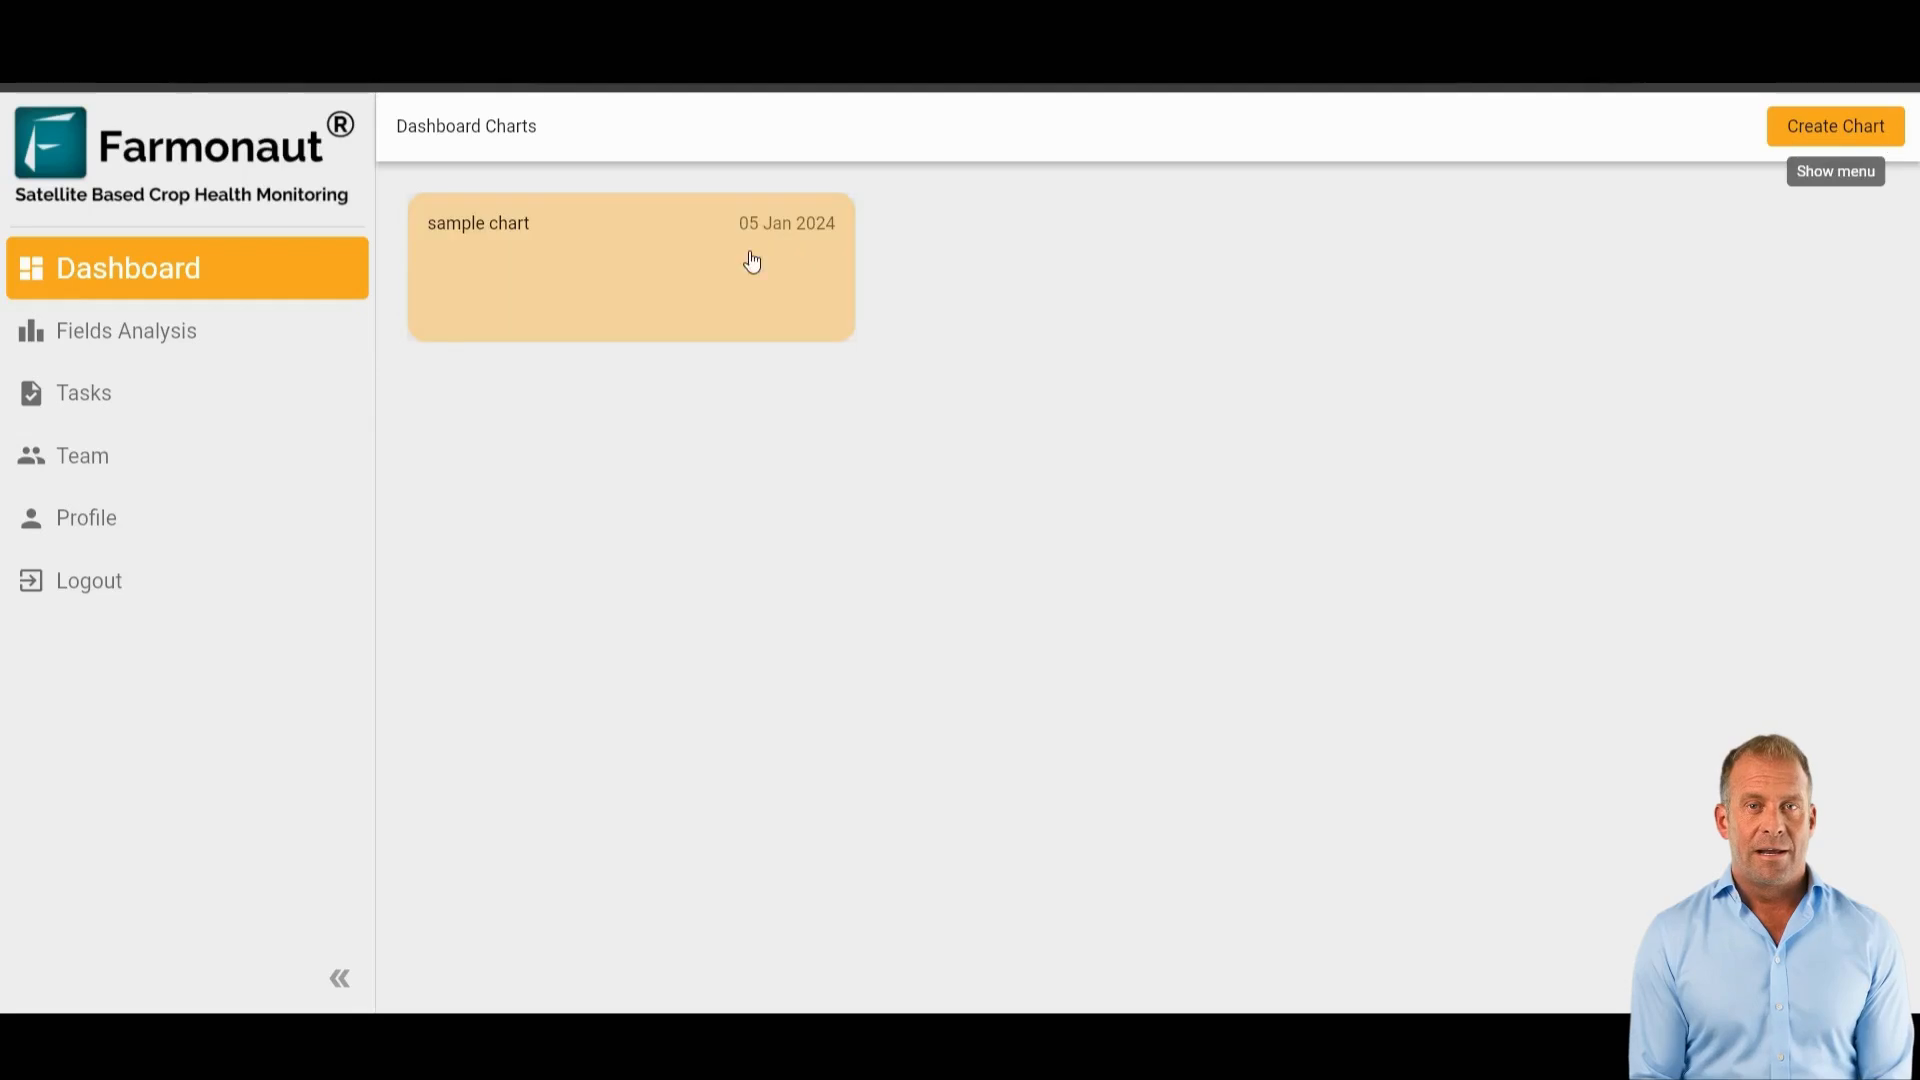
Analytics Dashboard: Visualizing Farm Performance
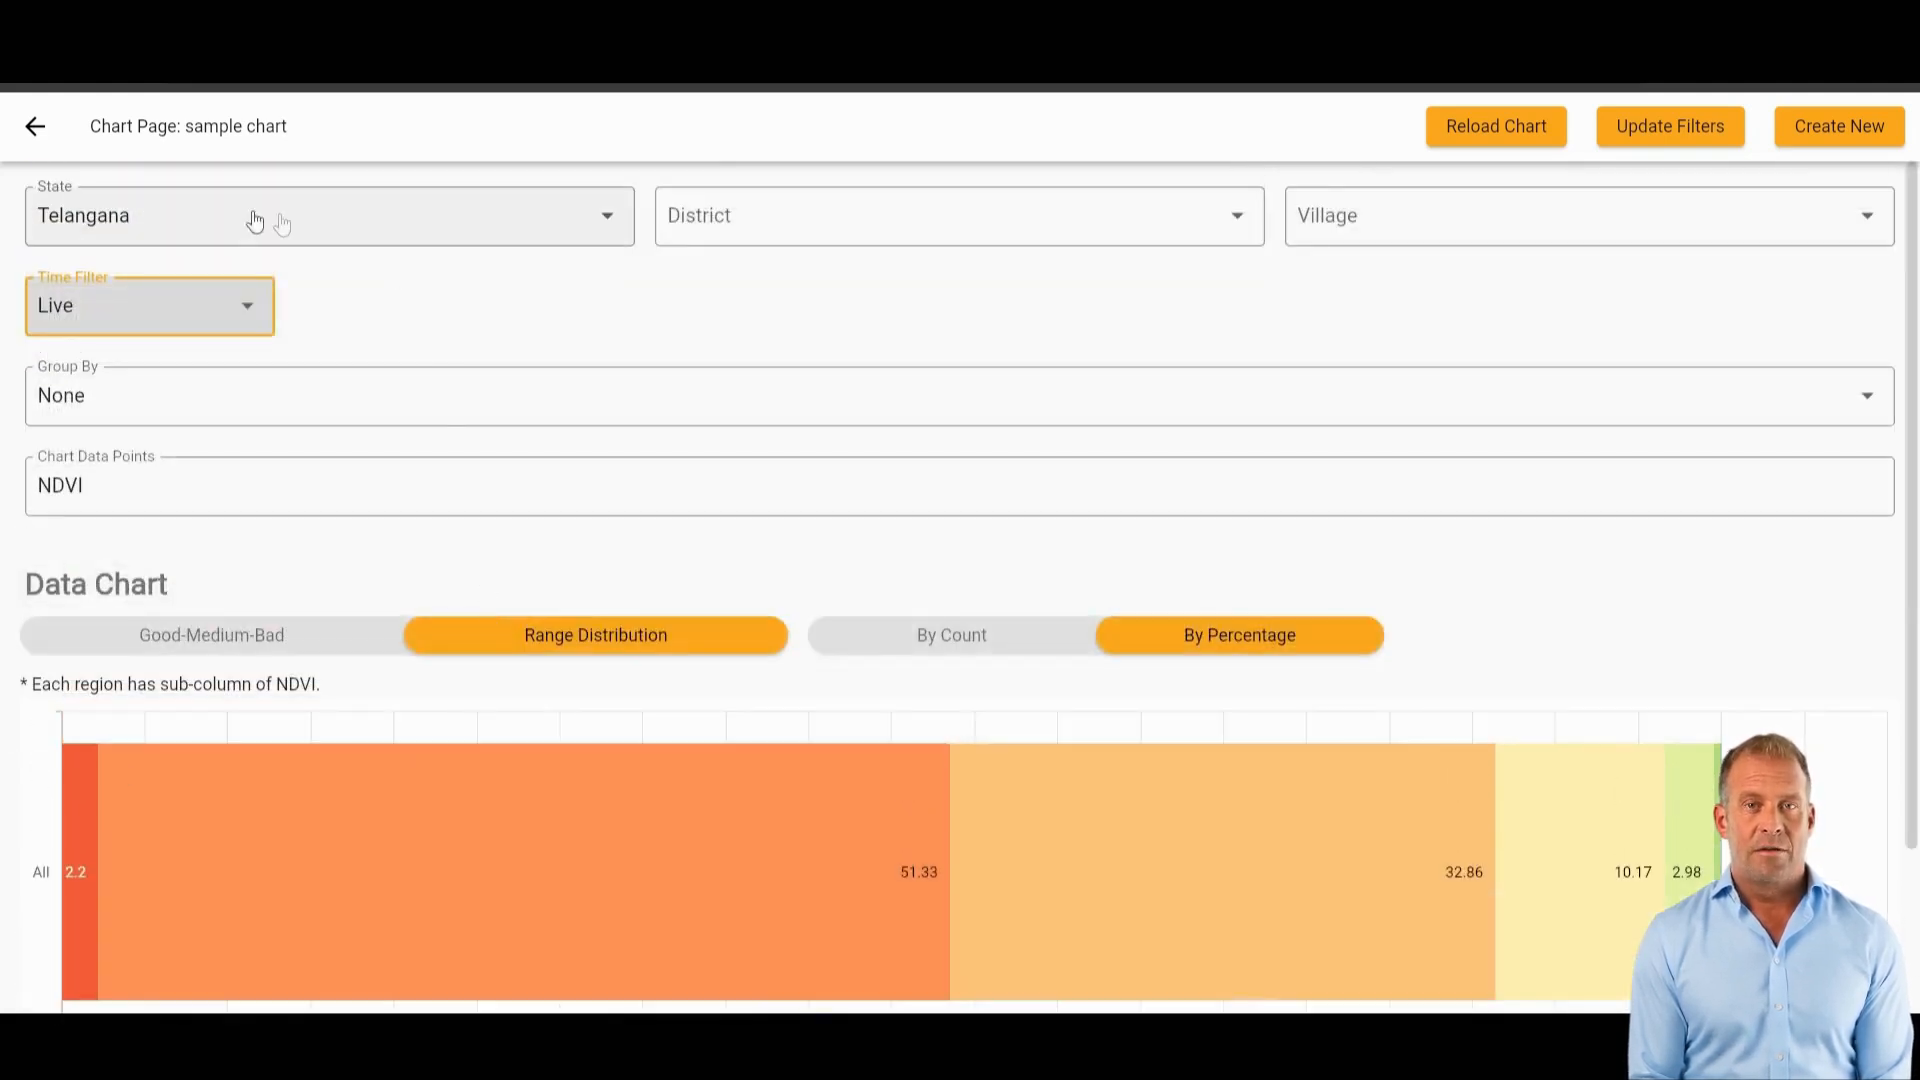
The Analytics Dashboard is another powerful feature of the Farmonaut Agro admin app. It allows users to visualize and analyze the performance of their farms over different regions and time periods. The dashboard presents data in the form of graphs and charts, making it easy to identify trends and patterns. Creating charts on the Analytics Dashboard is straightforward:- Click the “Create Chart” button
- Select the type of data to display
- Choose filters for location and time period
- Customize the range distribution of the data
Users can view data by the number of fields or percentage of fields, and filter data by location (state, district, or village) and time period (weekly, monthly, or custom date range). Additionally, data can be grouped by different region levels to gain insights into specific areas, such as individual districts within a state.
Leveraging the Normalized Differential Vegetation Index
The normalized differential vegetation index is a key component of the analytics provided by the Farmonaut Agro admin app. For example, users can create a chart to analyze NDVI values across their fields. This comprehensive analysis helps make data-driven decisions to improve farm management practices. By utilizing the normalized difference vegetation index formula, farmers can:- Monitor crop growth stages
- Identify areas of stress or poor growth
- Assess the impact of management practices
- Predict crop yields
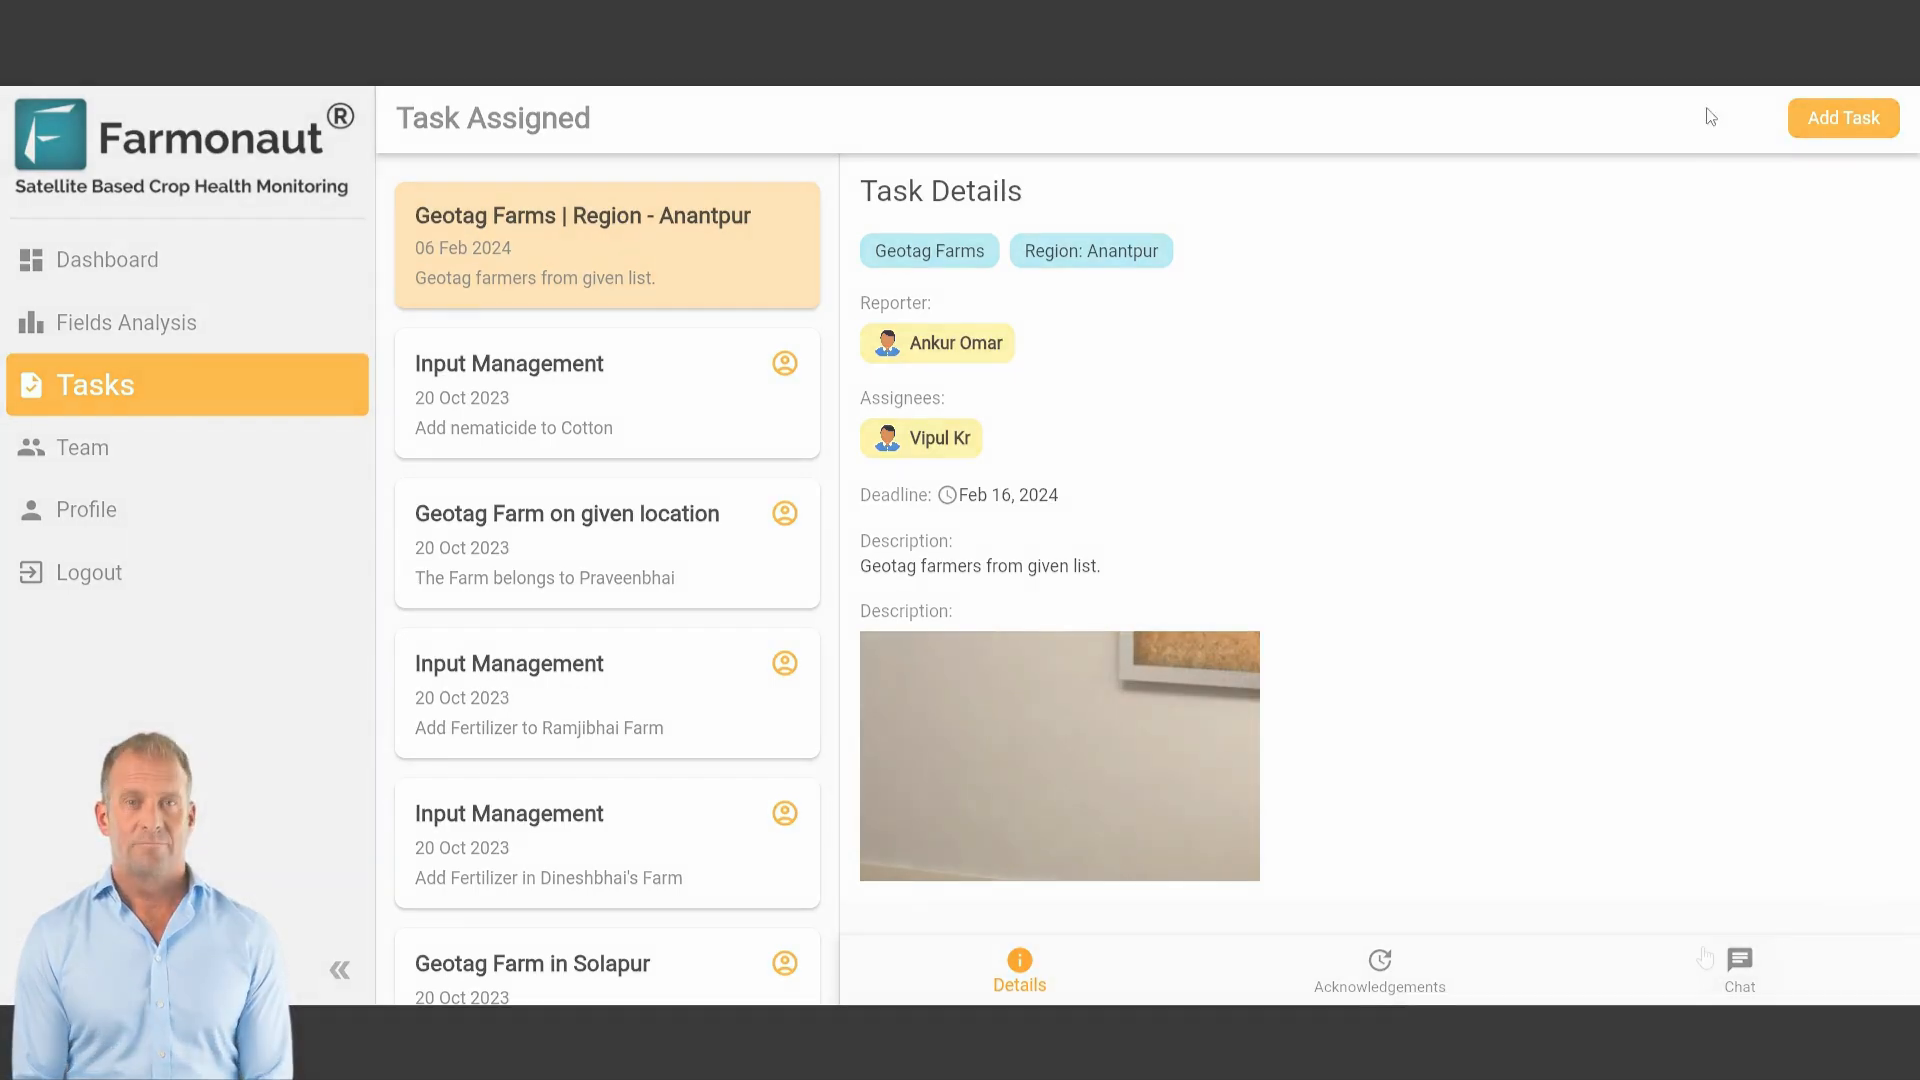
Efficient Task Management System
Efficient task management is crucial for large agricultural operations, and the Farmonaut Agro admin app provides a robust system to streamline this process. The Task page allows users to:- Assign tasks to team members
- Track task progress
- Receive real-time notifications about updates
- Details tab: Add essential task information
- Acknowledgements tab: Manage subtasks
- Chat tab: Facilitate team communication
This flexible task management system ensures that all team members are on the same page and can efficiently complete their assigned tasks, leading to improved farm management and productivity.
Team Management Features
Managing a large team can be challenging, but the Farmonaut Agro admin app simplifies this process with its Team Management features. The Teams page allows users to oversee team members and organize them into specific groups based on their roles and responsibilities. Key features of the Team Management system include:- User management with search functionality
- Team creation and editing
- Field association for users and teams
- Role-based access control
These features ensure that team members have access to the relevant data and resources they need to perform their tasks effectively, contributing to overall farm management efficiency.
Boosting Efficiency in Large Agricultural Operations
The Farmonaut Agro admin app boosts efficiency for large agricultural operations by integrating satellite data, providing robust analytics, and streamlining task management. By leveraging tools like the normalized difference vegetation index formula and other advanced satellite indexes, farmers can make data-driven decisions, optimize farm practices, and enhance productivity. Key benefits of using the Farmonaut Agro admin app include:- Improved crop health monitoring
- Optimized resource allocation
- Enhanced team collaboration
- Data-driven decision making
- Increased farm productivity and sustainability
