Revolutionizing Agriculture: Farmonaut’s Comprehensive Field Reports and Satellite-Based Farm Management
At Farmonaut, we are committed to transforming the agricultural landscape by harnessing the power of cutting-edge technology. Our latest innovation in precision agriculture is set to redefine how farmers monitor and manage their fields. We’re excited to announce a groundbreaking feature that will provide farmers with comprehensive field reports of their agricultural land, delivered automatically whenever a satellite crosses their location.
The Power of Satellite-Based Farm Management
For years, we at Farmonaut have been at the forefront of helping farmers identify unhealthy crop regions and water stress in their fields through satellite imagery. Our advanced satellite-based farm management system offers numerous advantages over traditional methods, drone-based monitoring, and IoT sensors. Let’s take a closer look at how Farmonaut’s solution stands out:
| Feature |
Farmonaut Satellite System |
Drone-based Monitoring |
IoT Sensors |
| Coverage Area |
Entire farm at once |
Limited by flight time and regulations |
Limited to sensor placement |
| Frequency of Data Collection |
Regular satellite passes (typically every 3-5 days) |
Manual flights required |
Continuous but localized |
| Initial Setup Cost |
Low (subscription-based) |
High (equipment purchase) |
Medium to High (sensors and network setup) |
| Maintenance |
Minimal (handled by Farmonaut) |
Regular drone maintenance required |
Ongoing sensor maintenance and battery replacement |
| Data Processing |
Automated with AI and machine learning |
Often requires manual processing |
Automated but limited to sensor capabilities |
| Scalability |
Highly scalable to large areas |
Limited by operational constraints |
Requires additional sensors for larger areas |
| Weather Independence |
Can operate in various weather conditions |
Limited by weather conditions |
Generally weather-independent |
Introducing Comprehensive Field Reports
Our latest update takes farm management to new heights. Now, farmers will receive detailed reports encompassing a wide range of crucial data points. These reports are designed to provide a holistic view of your agricultural land, empowering you to make informed decisions and optimize your farming practices.
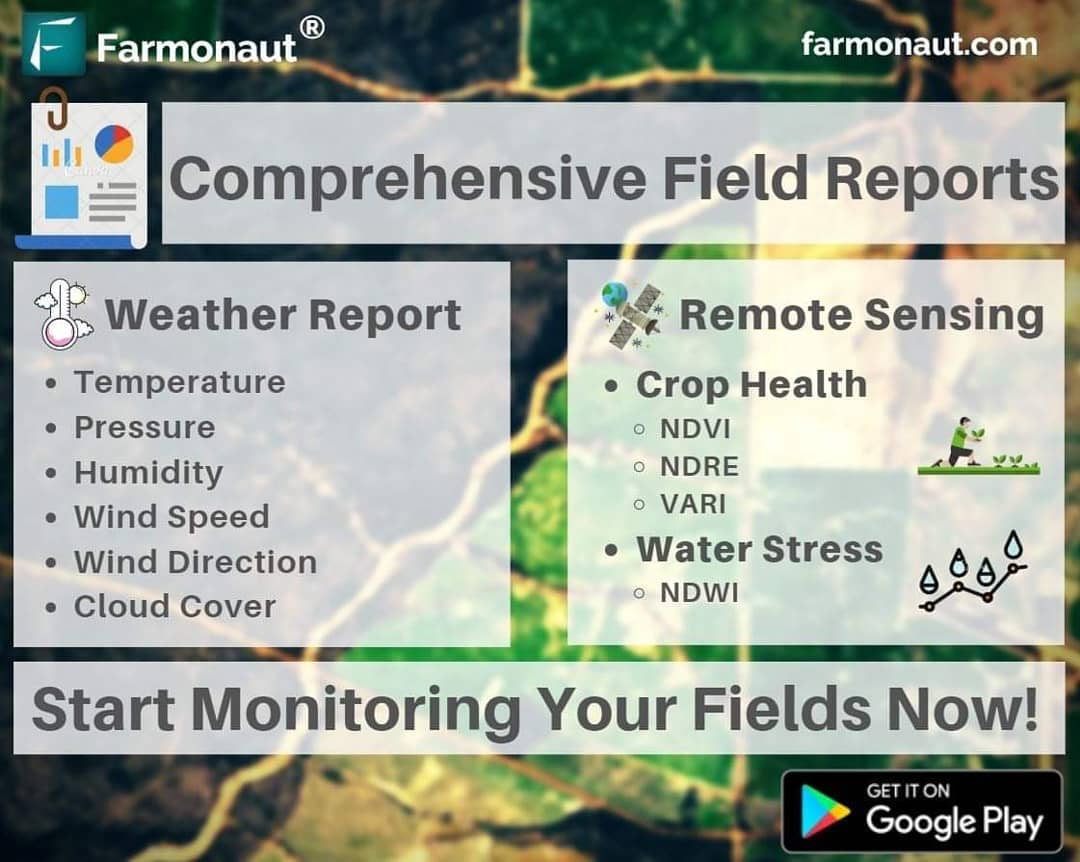
What’s Included in the Comprehensive Field Reports?
Our field reports are divided into two main sections:
A. Remote Sensing Data
This section offers a continuous analysis of crop health and water stress through various indices:
- NDVI (Normalized Difference Vegetation Index): A crucial indicator of crop health and biomass.
- NDRE (Normalized Difference Red Edge): Provides insights into chlorophyll content and nitrogen levels in crops.
- VARI (Visible Atmospherically Resistant Index): Helps in assessing vegetation fraction and leaf area index.
- NDWI (Normalized Difference Water Index): Measures water content in vegetation and assesses water stress.
These indices are presented through easy-to-understand tables, graphs, and color-coded maps, allowing you to quickly identify areas of concern in your fields.
B. Continuous Weather Data
Understanding how your fields perform under different weather conditions is crucial for optimal crop management. Our reports include comprehensive weather data, enabling you to correlate field performance with various weather parameters. This information is invaluable for planning irrigation, predicting pest outbreaks, and making informed decisions about planting and harvesting times.
The Science Behind Our Reports
Remote Sensing Data: A Deeper Dive
Remote sensing data forms the backbone of our comprehensive field reports. By utilizing multispectral satellite imagery, we can analyze various aspects of
crop health and field conditions without the need for on-ground sensors or time-consuming field visits.
Understanding NDVI (Normalized Difference Vegetation Index)
NDVI is a crucial indicator in precision agriculture. It measures the difference between near-infrared (which vegetation strongly reflects) and red light (which vegetation absorbs). NDVI values range from -1 to +1, with higher values indicating healthier vegetation.
Formula: NDVI = (NIR – Red) / (NIR + Red)
Where:
- NIR = Near-infrared reflectance
- Red = Red light reflectance
NDVI helps farmers:
- Identify areas of stress in crops before they’re visible to the naked eye
- Monitor crop growth and vigour throughout the growing season
- Estimate crop yields
- Detect pest infestations and disease outbreaks early
NDRE (Normalized Difference Red Edge): Advanced Crop Health Analysis
NDRE is particularly useful for assessing the chlorophyll content in crops, which is directly related to their nitrogen status. This index is more sensitive to changes in crop health, especially in the mid to late growing season when NDVI might saturate.
Formula: NDRE = (NIR – RedEdge) / (NIR + RedEdge)
Where:
- NIR = Near-infrared reflectance
- RedEdge = Reflectance in the red edge band
Benefits of NDRE:
- More accurate assessment of crop nitrogen content
- Better performance in dense canopy conditions
- Improved yield prediction capabilities
VARI (Visible Atmospherically Resistant Index): Assessing Vegetation Fraction
VARI is designed to minimize atmospheric effects in visible bands. It’s particularly useful for estimating the fraction of vegetation in a given area and can provide insights into leaf area index.
Formula: VARI = (Green – Red) / (Green + Red – Blue)
Where:
- Green = Reflectance in the green band
- Red = Reflectance in the red band
- Blue = Reflectance in the blue band
Applications of VARI:
- Estimating crop cover percentage
- Monitoring crop growth stages
- Assessing the impact of environmental stresses on vegetation
NDWI (Normalized Difference Water Index): Water Stress Detection
NDWI is crucial for assessing water content in vegetation and identifying areas of water stress. This index uses near-infrared (NIR) and short-wave infrared (SWIR) bands to detect changes in water content of leaves.
Formula: NDWI = (NIR – SWIR) / (NIR + SWIR)
Where:
- NIR = Near-infrared reflectance
- SWIR = Short-wave infrared reflectance
NDWI helps farmers:
- Identify areas of water stress before visible symptoms appear
- Optimize irrigation scheduling
- Monitor drought conditions
- Assess plant water content throughout the growing season
Weather Data: The Environmental Context
Our comprehensive
weather data provides the environmental context necessary to interpret the remote sensing data effectively. By combining crop health indices with detailed weather information, farmers can gain a holistic understanding of their field’s performance.
Key Weather Parameters in Our Reports
- Temperature: Daily minimum, maximum, and average temperatures
- Precipitation: Rainfall amounts and patterns
- Humidity: Relative humidity levels
- Wind Speed and Direction: Important for understanding evapotranspiration rates and potential for wind damage
- Solar Radiation: Crucial for photosynthesis and crop growth
- Evapotranspiration: Helps in irrigation planning
Integrating Weather Data with Crop Health Indices
By correlating weather data with crop health indices, farmers can:
- Understand how different weather conditions impact crop health
- Predict potential stress periods based on weather forecasts
- Optimize resource allocation (e.g., irrigation, fertilizer application) based on weather patterns
- Make informed decisions about planting and harvesting times
- Develop strategies to mitigate weather-related risks
How to Access Your Comprehensive Field Reports
We’ve made accessing your field reports as easy as possible. Here’s how you can get your hands on this valuable information:
- Automatic Email Delivery: Reports will be automatically sent to the email address registered with your Farmonaut account. Ensure your email is up to date in your profile settings.
- In-App Download: You can directly download the reports through the Farmonaut app. Simply navigate to the ‘Reports’ section and select the field and date range you want.
- Web Portal Access: Log in to your Farmonaut account on our web portal to view and download your reports anytime.
To take advantage of this new feature, ensure you have the latest version of the Farmonaut app installed on your device. You can update or download the app from the following links:
Leveraging Your Field Reports for Better Farm Management
The comprehensive field reports provided by Farmonaut are powerful tools for improving your farm management practices. Here are some ways you can leverage this information:
1. Precision Irrigation
By combining NDWI data with weather information, you can:
- Identify areas of your field that require more or less water
- Optimize irrigation schedules based on crop water needs and weather forecasts
- Reduce water waste and associated costs
- Prevent over-irrigation, which can lead to nutrient leaching and root diseases
2. Targeted Fertilizer Application
Using NDVI and NDRE indices, you can:
- Identify areas of nutrient deficiency in your fields
- Apply fertilizers only where and when they’re needed
- Reduce overall fertilizer use, cutting costs and minimizing environmental impact
- Improve crop uniformity across your fields
3. Early Pest and Disease Detection
By monitoring changes in crop health indices over time, you can:
- Spot potential pest infestations or disease outbreaks before they become severe
- Target scouting efforts to specific areas of concern
- Implement timely and localized treatments, reducing the need for broad-spectrum pesticide applications
4. Yield Prediction and Harvest Planning
Analyzing NDVI trends along with weather data allows you to:
- Estimate crop yields more accurately
- Plan harvest logistics based on expected yields and crop readiness
- Make informed decisions about crop marketing and storage
5. Climate-Smart Agriculture
By understanding how your crops respond to different weather conditions, you can:
- Adjust planting dates based on long-term weather trends
- Select crop varieties that are better suited to your local climate
- Implement conservation practices to improve soil health and water retention
The Future of Farming with Farmonaut
At Farmonaut, we’re committed to continually improving our services and pushing the boundaries of what’s possible in precision agriculture. Here’s a glimpse into what the future holds:
1. AI-Powered Predictive Analytics
We’re developing advanced AI algorithms that will not only analyze current crop conditions but also predict future challenges and opportunities. This will enable farmers to take proactive measures to optimize crop yields and minimize risks.
2. Integration with IoT Devices
While our satellite-based system offers numerous advantages, we recognize the value of on-ground data. We’re working on integrating our platform with IoT devices like soil moisture sensors and weather stations to provide an even more comprehensive view of field conditions.
3. Blockchain-Based Traceability
For our corporate clients, we’re developing blockchain solutions to ensure complete traceability of agricultural products from farm to table. This will enhance trust, reduce fraud, and meet the growing consumer demand for transparency in food production.
4. Carbon Footprint Monitoring
As sustainability becomes increasingly important in agriculture, we’re developing tools to help farmers monitor and reduce their carbon footprint. This will not only benefit the environment but also potentially open up new revenue streams through carbon credits.
5. Expanded Crop-Specific Insights
We’re constantly refining our algorithms to provide more accurate and detailed insights for a wider range of crops. This includes developing crop-specific health indices and growth stage monitoring.
For Developers: Integrate Farmonaut’s Power into Your Own Applications
Are you a developer working on agricultural applications? Farmonaut offers robust APIs that allow you to integrate our satellite and weather data into your own systems. This opens up a world of possibilities for creating innovative farming solutions.
Check out our API documentation to get started:
Frequently Asked Questions (FAQ)
Q: How often will I receive field reports?
A: Field reports are generated and sent each time a satellite passes over your registered field locations. This typically occurs every 3-5 days, depending on your geographical location.
Q: Can I customize the information included in my field reports?
A: Currently, all reports include a standard set of information. However, we’re working on customizable reports as a future feature. Stay tuned for updates!
Q: How accurate is the satellite data compared to on-ground measurements?
A: Our satellite data is highly accurate and correlates well with on-ground measurements. However, factors like cloud cover can occasionally affect data quality. We use advanced algorithms to filter and verify data for maximum reliability.
Q: Is my farm data kept confidential?
A: Absolutely. At Farmonaut, we take data privacy very seriously. All farm data is encrypted and stored securely. We never share individual farm data without explicit permission.
Q: Can Farmonaut’s system work for small farms?
A: Yes! Our system is designed to work for farms of all sizes, from small holdings to large commercial operations.
Q: Do I need any special equipment to use Farmonaut’s services?
A: No special equipment is needed. All you need is a smartphone or computer to access our app or web portal.
Q: How can I get technical support if I have issues?
A: Our dedicated support team is always ready to help. You can reach out through the app, email, or phone during business hours.
Q: Can Farmonaut’s system work for all types of crops?
A: Our system works well for a wide variety of crops. However, the accuracy and usefulness of certain indices may vary depending on the crop type. We’re continuously expanding our crop-specific algorithms.
Q: Is there a mobile app available?
A: Yes, we have mobile apps available for both Android and iOS devices. You can download them from the Google Play Store and Apple App Store respectively.
Q: Can I share my field reports with my agronomist or consultant?
A: Absolutely! You can easily share your reports via email or by granting access to your Farmonaut account.
Conclusion: Embracing the Future of Agriculture
At Farmonaut, we believe that the future of agriculture lies in the intelligent use of technology to support sustainable and profitable farming practices. Our comprehensive field reports, powered by advanced satellite technology and data analytics, represent a significant step forward in precision agriculture.
By providing farmers with detailed, timely, and actionable insights into their crop health and field conditions, we’re empowering them to make informed decisions that can lead to increased yields, reduced resource use, and improved environmental stewardship.
As we continue to innovate and expand our services, we remain committed to our mission of making precision agriculture accessible and affordable for farmers worldwide. Whether you’re managing a small family farm or overseeing large-scale agricultural operations, Farmonaut is here to support your success.
Join us in revolutionizing agriculture. Update your Farmonaut app today and start experiencing the benefits of comprehensive field reports and satellite-based farm management.
Happy Farming!
Ready to take your farming to the next level?
Download the Farmonaut app now and start your journey towards smarter, more efficient agriculture.
