In the ever-evolving world of agriculture, satellite technology in agriculture has emerged as a game-changing tool for farmers and agricultural professionals. Farmonaut’s web app for satellite monitoring is at the forefront of this revolution, offering a sophisticated platform that harnesses the power of satellite imagery in farming to provide comprehensive insights into field conditions. This article will delve into the features and benefits of Farmonaut’s web app, exploring how satellite images for agriculture are transforming the way we approach farming in the 21st century.
🌿 Understanding Farmonaut’s Satellite Monitoring Web App
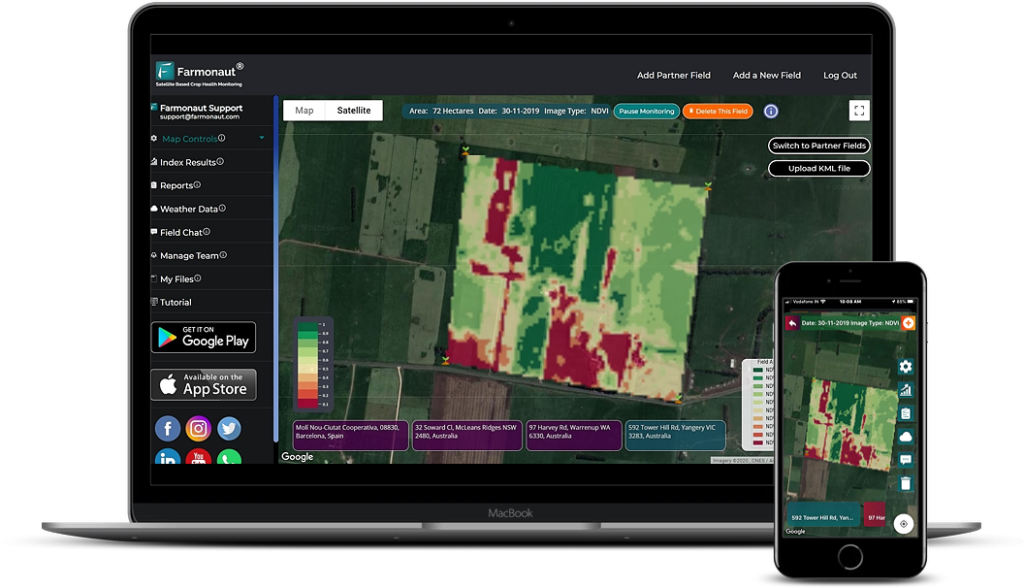
Farmonaut’s web app is designed to make satellite imaging in agriculture accessible and actionable for farmers of all technical backgrounds. The platform utilizes advanced satellite technology in agriculture to provide real-time data and analysis of crop health, irrigation needs, and soil conditions.
Upon logging in, users are greeted with a clear and intuitive interface displaying their fields. The app employs a simple color-coding system that allows even novice users to quickly interpret the data:
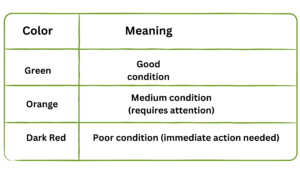
This user-friendly approach ensures that farmers can easily identify areas of concern without the need for extensive technical knowledge.
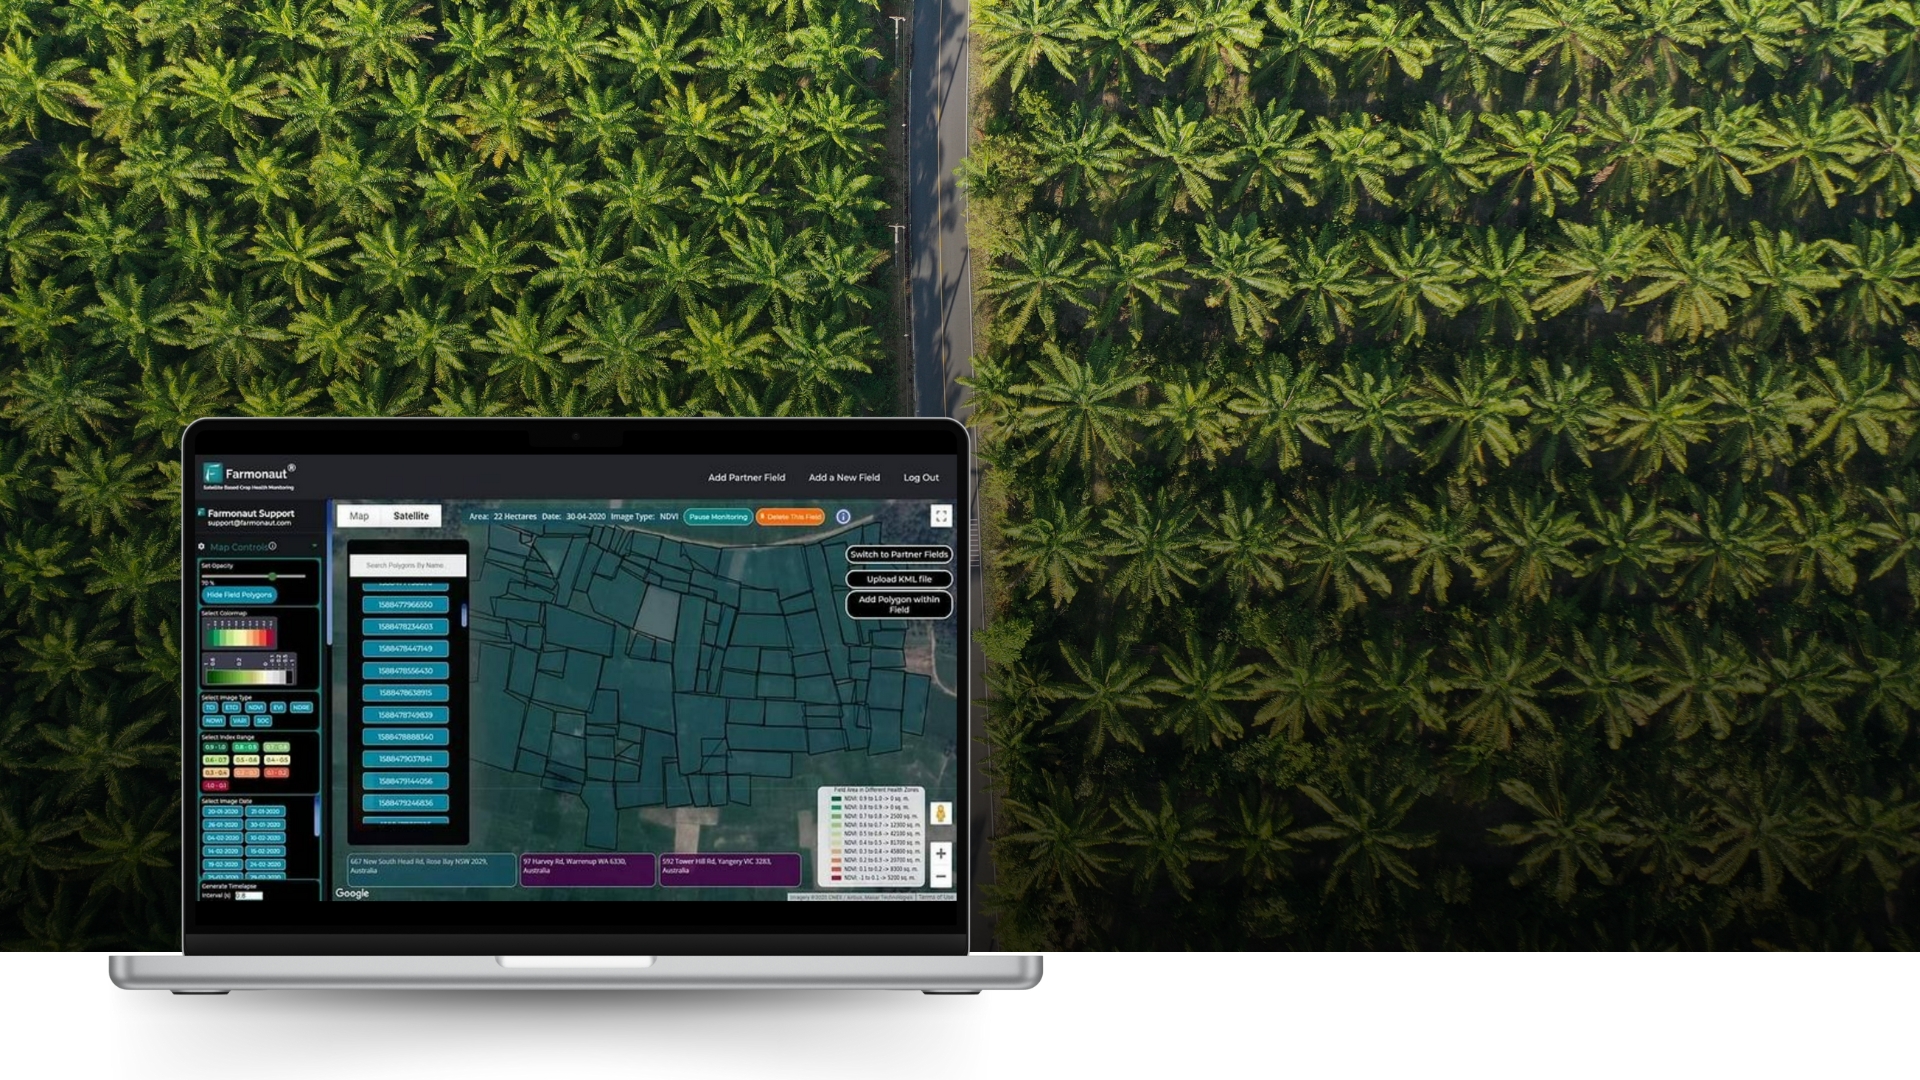
🗺️ Adding and Mapping Fields
One of the key features of Farmonaut’s platform is the ease with which users can add and map their fields. The app offers multiple methods to accomplish this:
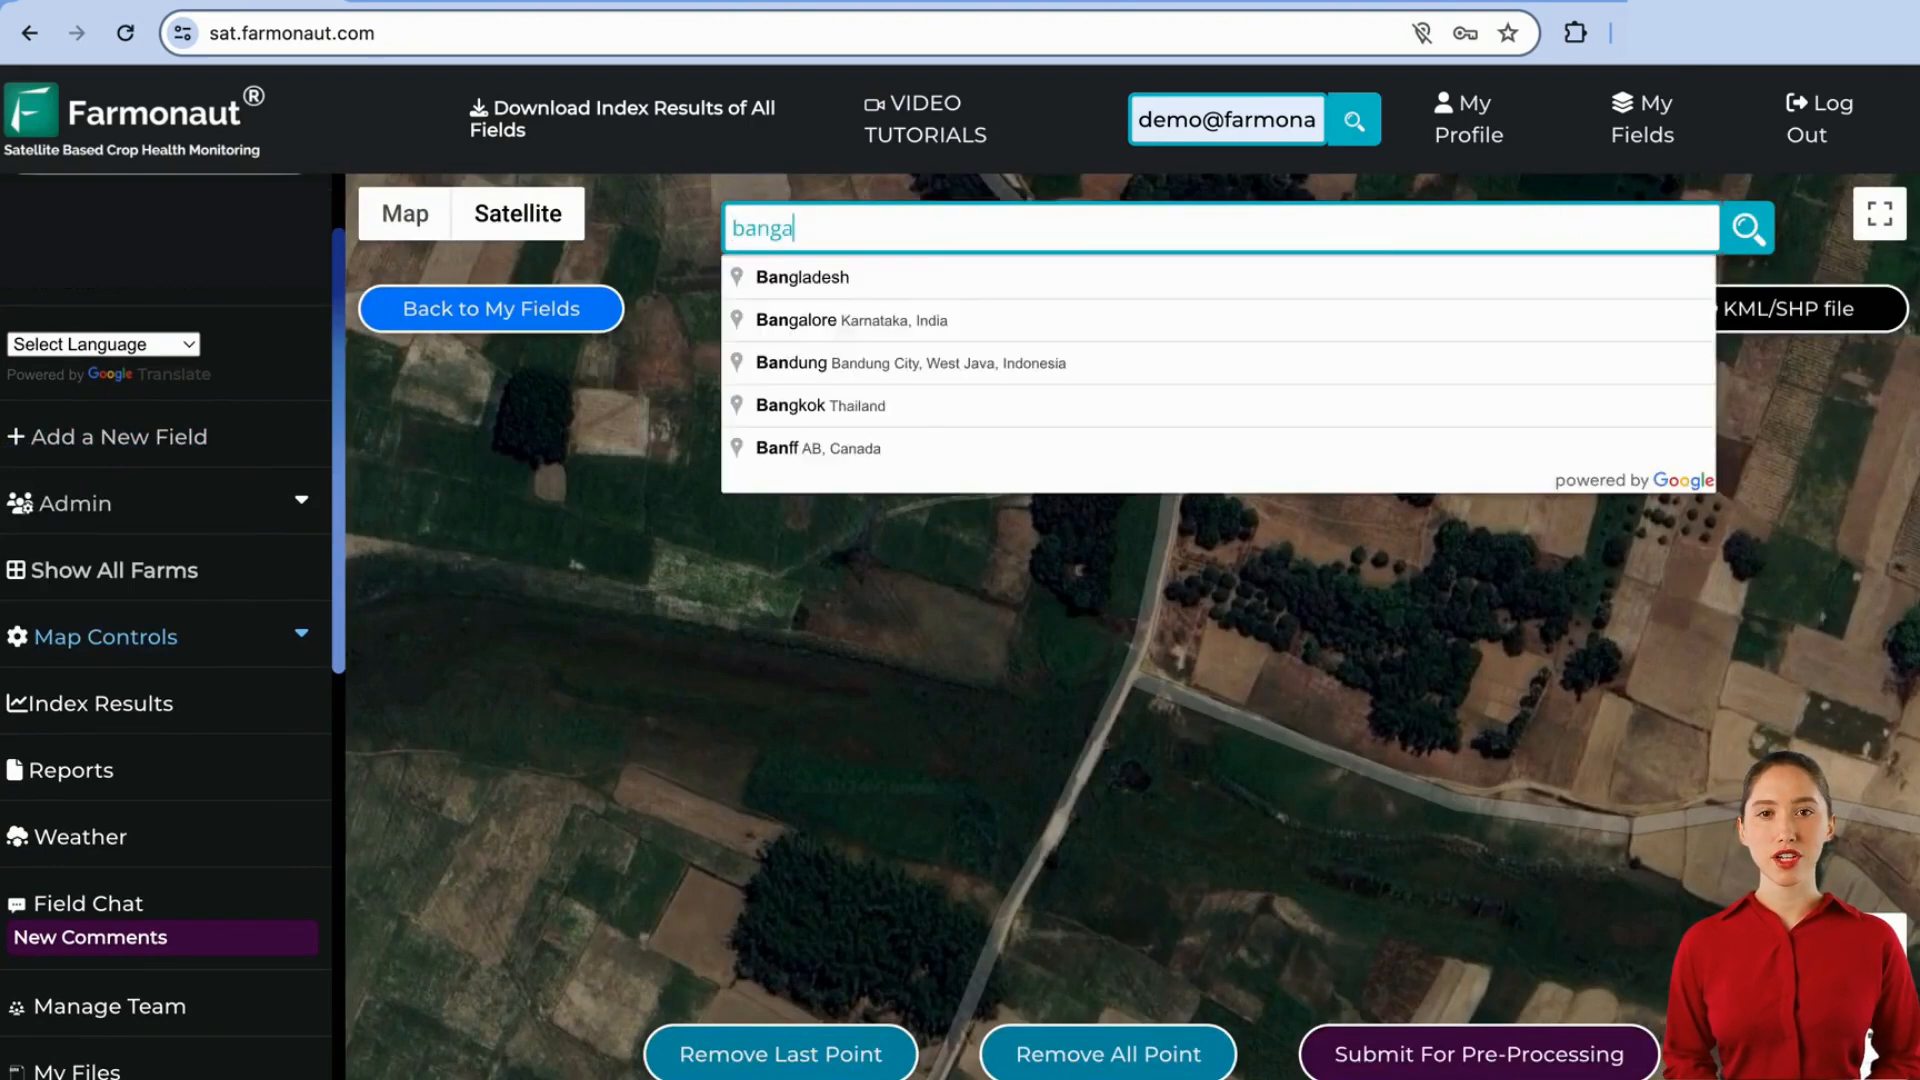
- Search by address or coordinates
- Upload KML or shape files
- Manual boundary mapping
The manual mapping process is particularly straightforward. Users simply tap on the boundary points of their field, and the app creates the outline. This flexibility ensures that farmers can accurately represent their land within the system, regardless of their technical expertise.
📊 Comprehensive Field Analysis
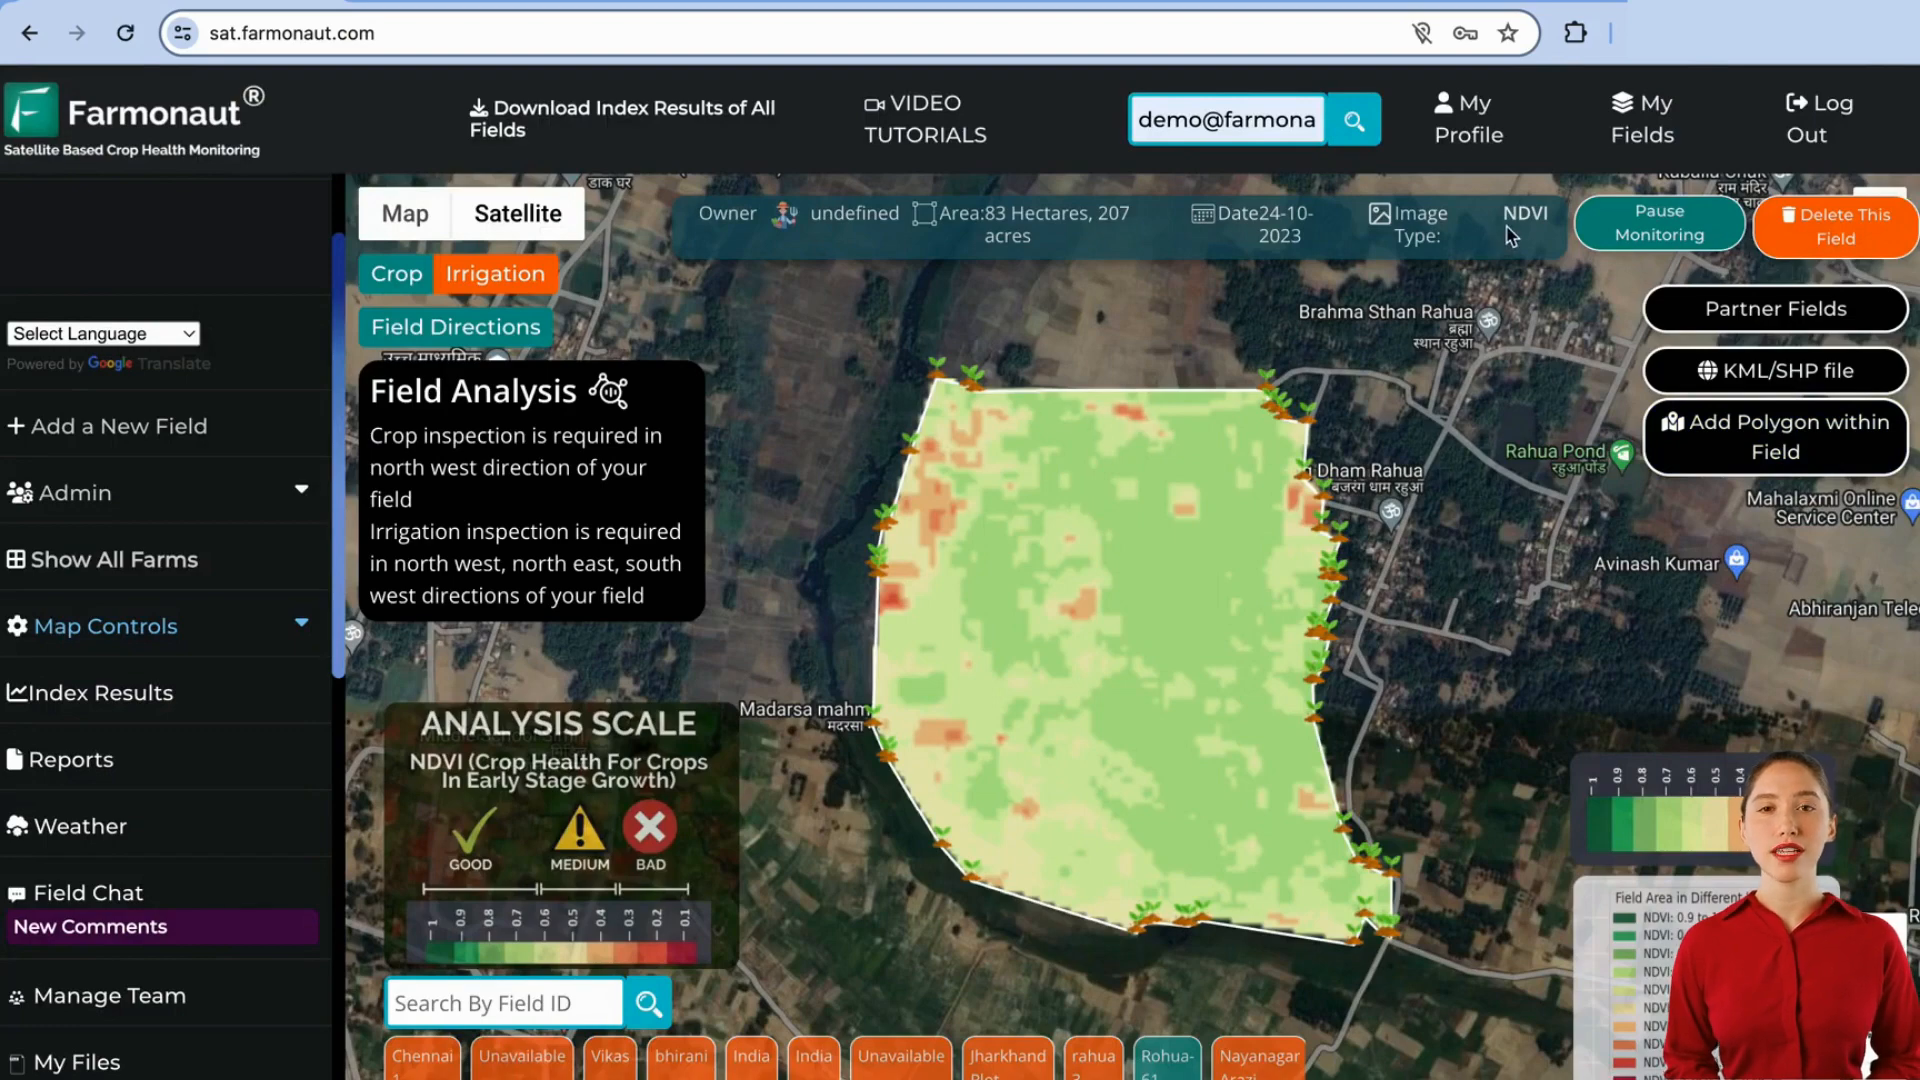
At the heart of Farmonaut’s web app is its powerful analysis capabilities. The platform offers a range of indices and parameters that provide deep insights into field conditions:
Crop Health Indices
- NDVI (Normalized Difference Vegetation Index)
- NDRE (Normalized Difference Red Edge)
These indices are crucial for assessing crop health at various growth stages. NDVI is particularly useful for early growth stages or crops with less dense canopies, while NDRE is recommended for later stages or denser crops like soybeans or maize.
Irrigation Parameters
- NDWI (Normalized Difference Water Index)
- Evapotranspiration
- NDMI (Normalized Difference Moisture Index)
By combining these three parameters, farmers gain a comprehensive understanding of their field’s irrigation status, helping to optimize water usage and prevent water stress.
Soil Health Analysis
The app includes a Soil Organic Carbon (SOC) index, which is particularly useful before sowing and after harvesting. This feature guides farmers in selecting optimal locations for soil sampling, focusing on areas where organic carbon levels are lower and other nutrients may be depleted.
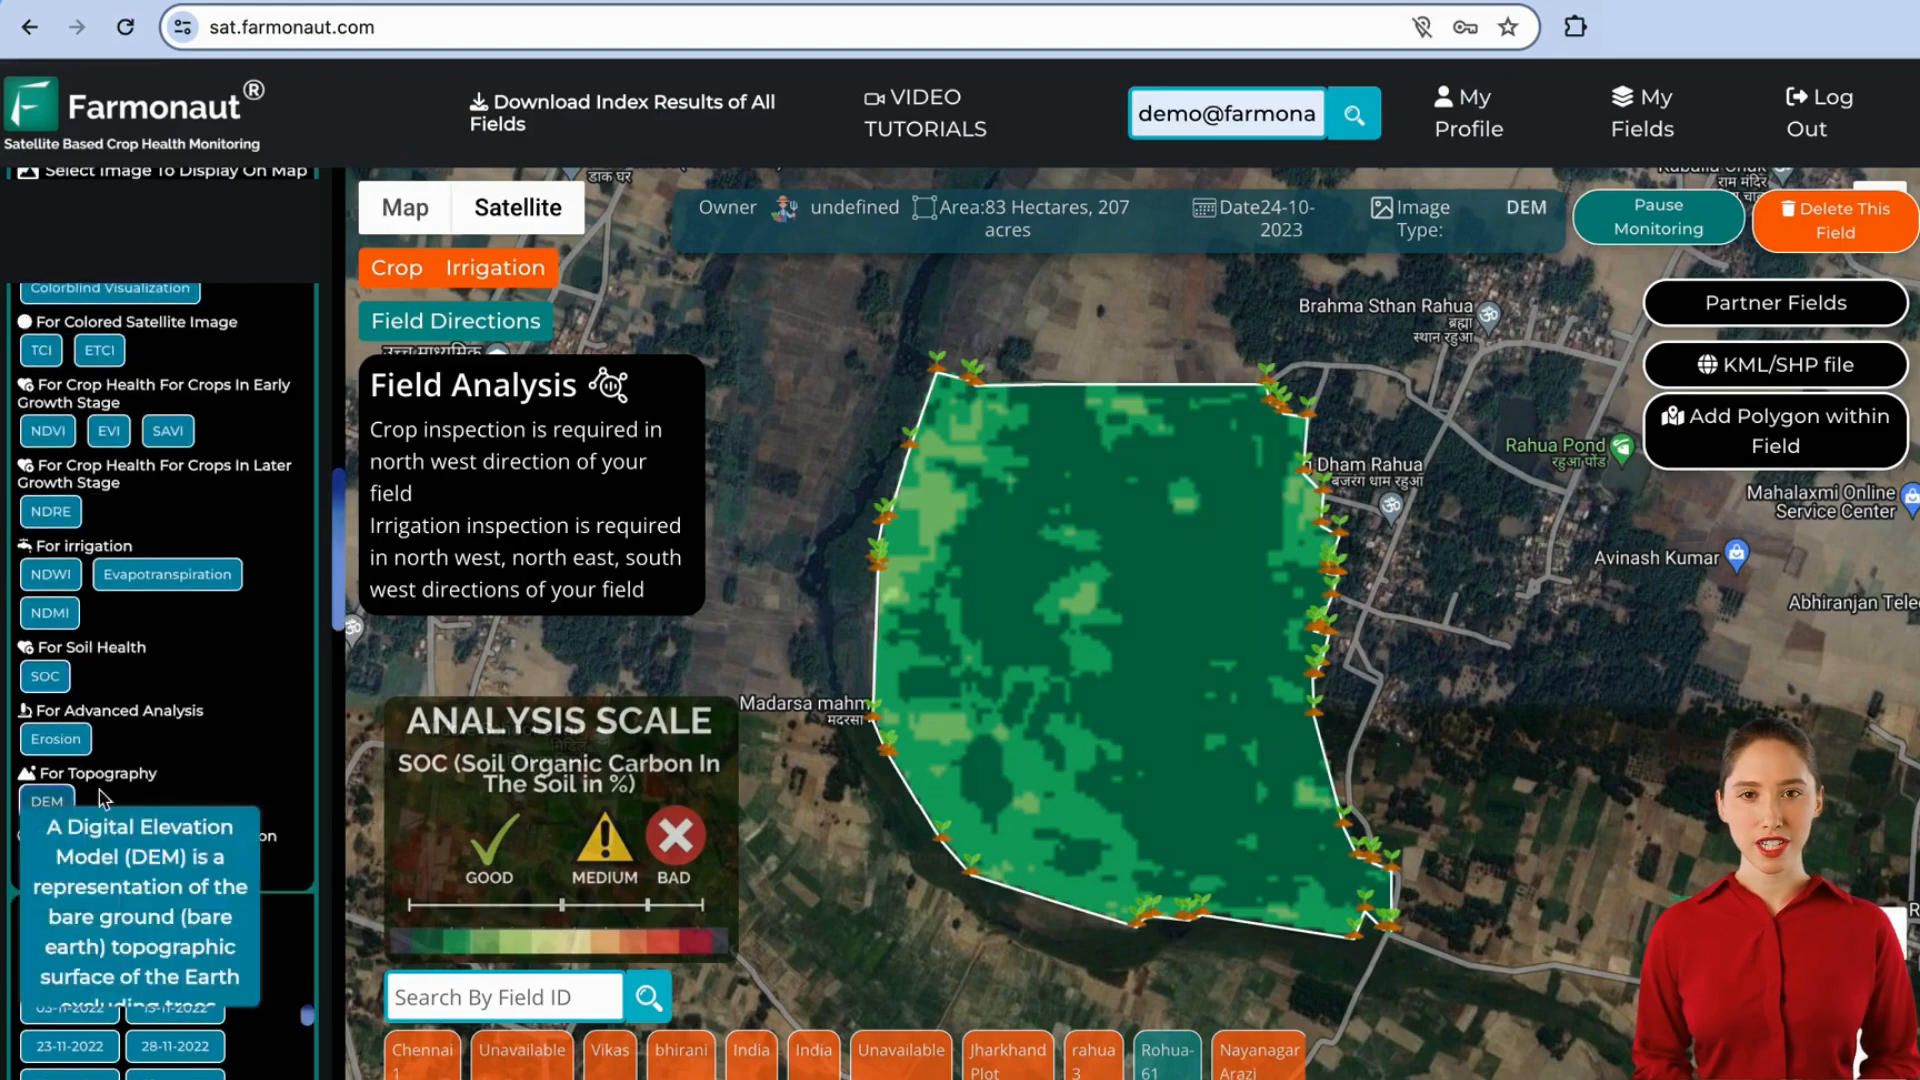
Terrain Analysis
The Digital Elevation Model (DEM) feature helps farmers understand the topography of their land, identifying areas prone to water logging. This information is invaluable for planning drainage systems or leveling fields to improve overall crop health.
📑 Comprehensive Reporting System
Farmonaut’s Advanced Satellite-Based Crop Health Monitoring System: Comprehensive Reporting for Precision Agriculture
Farmonaut’s cutting-edge Satellite-Based Crop Health Monitoring System delivers a powerful suite of tools for modern farmers, combining real-time data capture, automated reporting, and multi-platform accessibility. This system generates detailed field results and downloadable reports with each satellite pass, providing farmers with critical insights even in offline scenarios.
Report Generation and Delivery:
- Frequency: Reports generated every 3-5 days
- Turnaround Time: Delivered within 24 hours of satellite data capture
- Accessibility: Available via multiple channels including WhatsApp, web dashboard, mobile apps, and email
- Offline Capability: Downloadable reports for use without internet connectivity
Report Contents:
- Weather Statistics (Capture Date):
- Weather station information
- Temperature range (minimum and maximum)
- Atmospheric pressure
- Humidity levels
- Wind speed and direction
- Cloud cover percentage
- Weather Visualization:
- Interactive weather graphs
- 7-day weather forecast
- Crop Health Indices:
- Current index data
- Time series trends
- Scientific background and interpretation guide
- Satellite Imagery:
- High-resolution field captures
- Nine-section field map highlighting areas of concern
- Field Health Analysis:
- Breakdown of field area by health zones for each index
- Quick identification of regions requiring attention (crop health or irrigation)
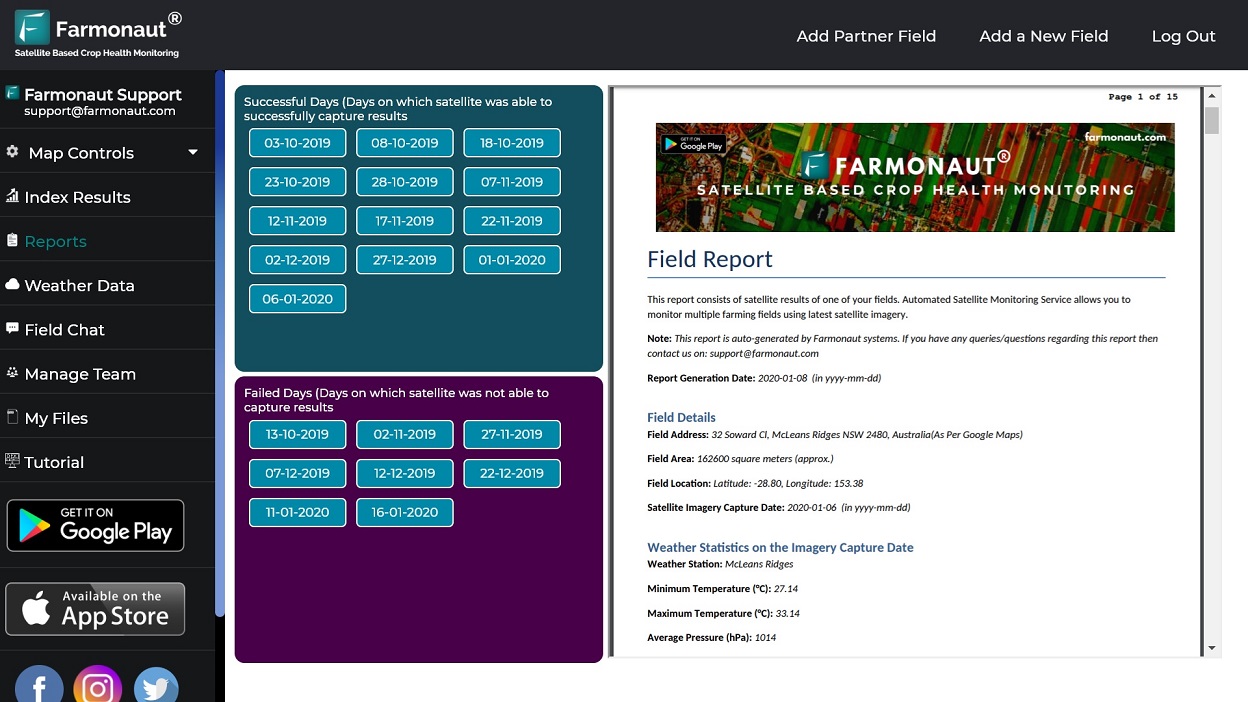
User Interface: The reporting interface is intuitively divided into three main sections:
- Successful Captures (Top Left): Chronological list of dates with successful satellite data acquisition
- Unsuccessful Attempts (Bottom Left): Dates when adverse weather conditions prevented data capture (Note: Reports are still generated for these dates using available data)
- Report Display (Right Side): Interactive area for viewing selected field reports
Key Benefits:
- Timely Insights: Regular reports enable proactive field management
- Multi-Platform Access: Flexibility to view reports across various devices and channels
- Offline Functionality: Crucial data available even without internet connectivity
- Visual Clarity: Nine-section field map allows for quick problem identification
- Comprehensive Data: Combination of weather, crop health, and satellite imagery provides a holistic view of field conditions
- Historical Analysis: Ability to review past reports for trend identification and long-term planning
Farmonaut’s Satellite-Based Crop Health Monitoring System represents a significant advancement in precision agriculture. By providing farmers with detailed, timely, and actionable insights, this system empowers agricultural professionals to make data-driven decisions, optimize resource allocation, and ultimately improve crop yields and farm profitability.
🌦️ Weather Forecasting and Historical Data
Comprehensive Weather Intelligence for Precision Agriculture
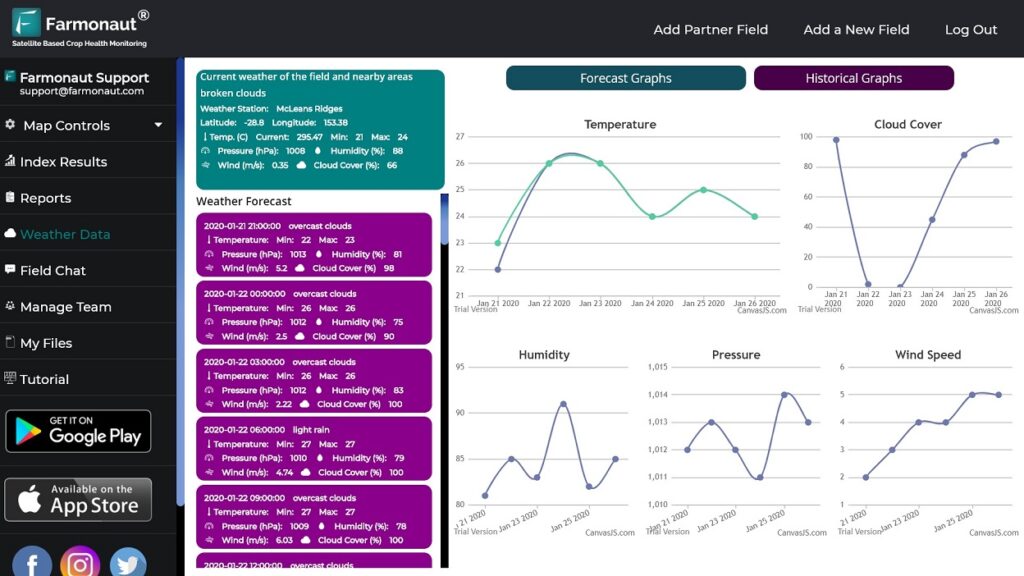
Farmonaut’s web app delivers a powerful suite of weather monitoring and forecasting tools, empowering farmers with crucial environmental insights. The intuitive interface is divided into three key sections:
- Current Conditions (Top Left): Provides real-time weather data for the selected field, including:
- Weather station information
- Concise weather description
- Temperature range (minimum and maximum)
- Atmospheric pressure (hPa)
- Relative humidity (%)
- Wind speed (m/s)
- Cloud cover percentage
- Detailed Forecasts (Bottom Left): Offers precise weather predictions to support proactive farm management:
- 3-hour interval forecasts for the next 5 days
- Hourly forecasts for the upcoming 48 hours
- Daily forecasts extending 8 days into the future
- Visual Analytics (Right Side): Presents five interactive graphs for in-depth analysis:
- Temperature trends
- Cloud cover patterns
- Humidity fluctuations
- Pressure systems
- Wind speed variations
Users can toggle between forecast projections and historical data, with records dating back to the field’s initial satellite monitoring date. This feature extends even further, granting access to satellite imagery archives from 2017 onward, enabling long-term trend analysis and data-driven decision-making.
By consolidating current conditions, short-term forecasts, and historical data in a single, user-friendly interface, Farmonaut equips farmers with the tools to optimize crop management, mitigate weather-related risks, and boost overall farm productivity. This comprehensive approach to weather intelligence sets a new standard for precision agriculture, allowing farmers to make informed decisions based on past trends, current conditions, and future predictions.
🔬 Advanced Satellite Technology Integration
Farmonaut’s commitment to providing comprehensive satellite telemetry for agriculture is evident in its integration of advanced technologies:
- Microwave data for cloud cover situations
- Synthetic Aperture Radar (SAR) data
- RVI and RSM parameters for crop health and soil moisture
This multi-sensor approach ensures that farmers have access to crucial data even in challenging weather conditions, making the satellite monitoring services reliable year-round.
💼 Farm Management and Subscription Features
The web app includes robust farm management tools that allow users to:
- View details of all farms
- Track subscription status
- Renew subscriptions for multiple farms
This centralized management system simplifies the administrative aspects of using satellite technology in agriculture, allowing farmers to focus on what matters most – their crops.
