Mastering Vegetation Indices: From NDVI to VARI – Enhancing Crop Monitoring with Advanced Remote Sensing Techniques
In the ever-evolving world of precision agriculture, we at Farmonaut are constantly striving to bring you the most advanced and effective tools for crop monitoring and management. One of the key areas where we excel is in the application of different vegetation indices to provide farmers with comprehensive insights into their crop health and overall field conditions. In this extensive blog post, we’ll dive deep into the world of vegetation indices, exploring their significance, applications, and how they can revolutionize your farming practices.
Table of Contents
- Introduction to Vegetation Indices
- The Importance of NDVI in Agriculture
- Exploring Enhanced Vegetation Index (EVI)
- Understanding the Normalized Multi-Band Drought Index (NMDI)
- The Visible Atmospherically Resistant Index (VARI)
- How Farmonaut Utilizes Vegetation Indices
- Comparing Satellite, Drone, and IoT-based Farm Monitoring
- Implementing Vegetation Indices in Your Farming Practices
- Future Trends in Remote Sensing for Agriculture
- FAQs
1. Introduction to Vegetation Indices
Vegetation indices are quantitative measurements derived from mathematical combinations of spectral bands. These indices are designed to enhance the vegetation signal in satellite imagery while minimizing the influence of background factors such as soil brightness, topography, and atmospheric conditions. By utilizing these indices, we can gain valuable insights into various aspects of vegetation, including:
- Biomass
- Leaf Area Index (LAI)
- Chlorophyll content
- Plant vigor
- Water stress
At Farmonaut, we harness the power of these indices to provide our users with detailed, actionable information about their crops. Our satellite-based crop health monitoring system integrates multiple vegetation indices to offer a comprehensive view of field conditions.
2. The Importance of NDVI in Agriculture
The Normalized Difference Vegetation Index (NDVI) is perhaps the most well-known and widely used vegetation index in agriculture. NDVI is calculated using the following formula:
NDVI = (NIR – Red) / (NIR + Red)
Where NIR represents the near-infrared reflectance and Red represents the red reflectance.
NDVI values range from -1 to +1, with higher values indicating healthier vegetation. This index is particularly useful for:
- Assessing crop health and vigor
- Monitoring biomass changes over time
- Detecting stress in plants before visible symptoms appear
- Estimating crop yields
At Farmonaut, we use NDVI as a cornerstone of our crop monitoring services. Our platform provides regular NDVI updates, allowing farmers to track their crop’s health throughout the growing season and make informed decisions about irrigation, fertilization, and pest management.
3. Exploring Enhanced Vegetation Index (EVI)
While NDVI is incredibly useful, it has some limitations, particularly in areas with dense vegetation or varying atmospheric conditions. This is where the Enhanced Vegetation Index (EVI) comes into play. EVI was developed to address some of the shortcomings of NDVI and provide more accurate vegetation monitoring in diverse environments.
The EVI formula is more complex than NDVI:
EVI = G * ((NIR – Red) / (NIR + C1 * Red – C2 * Blue + L))
Where:
- G is a gain factor
- C1 and C2 are coefficients for atmospheric resistance
- L is a soil adjustment factor
EVI offers several advantages over NDVI:
- Improved sensitivity in high biomass regions
- Reduced atmospheric influences
- Decreased saturation in dense vegetation areas
At Farmonaut, we incorporate EVI into our analysis to provide a more nuanced understanding of crop health, especially in regions with dense vegetation or challenging atmospheric conditions. This allows us to offer more accurate and reliable insights to our users.
4. Understanding the Normalized Multi-Band Drought Index (NMDI)
Drought monitoring is a critical aspect of agricultural management, especially in regions prone to water scarcity. The Normalized Multi-Band Drought Index (NMDI) is a powerful tool for assessing soil and vegetation water content, making it invaluable for drought detection and monitoring.
The NMDI is calculated using the following formula:
NMDI = (NIR – (SWIR1 – SWIR2)) / (NIR + (SWIR1 – SWIR2))
Where:
- NIR is the near-infrared band
- SWIR1 and SWIR2 are shortwave infrared bands
The NMDI offers several benefits for agricultural monitoring:
- High sensitivity to drought conditions
- Ability to distinguish between soil and vegetation water content
- Reduced sensitivity to atmospheric effects
At Farmonaut, we integrate NMDI data into our platform to provide early warnings of drought stress and help farmers optimize their water management practices. This index is particularly valuable in regions where water conservation is a priority.
5. The Visible Atmospherically Resistant Index (VARI)
The Visible Atmospherically Resistant Index (VARI) is another valuable tool in our remote sensing arsenal. Unlike indices that rely on near-infrared bands, VARI uses only visible light bands, making it useful for applications where NIR data may not be available or reliable.
The VARI formula is:
VARI = (Green – Red) / (Green + Red – Blue)
VARI offers several advantages for agricultural monitoring:
- Reduced sensitivity to atmospheric effects
- Ability to estimate vegetation fraction
- Useful for assessing crop health using standard RGB imagery
At Farmonaut, we use VARI in conjunction with other indices to provide a comprehensive view of crop health. This index is particularly useful for rapid assessments and in situations where more advanced spectral data may not be available.
6. How Farmonaut Utilizes Vegetation Indices
At Farmonaut, we leverage the power of multiple vegetation indices to provide our users with comprehensive, actionable insights into their crop health and field conditions. Our platform integrates data from various satellites and combines it with advanced algorithms to deliver accurate, timely information to farmers and agribusinesses.
Here’s how we apply vegetation indices in our services:
- Crop Health Monitoring: We use NDVI and EVI to provide regular updates on crop vigor and overall health, allowing farmers to identify potential issues early.
- Drought Detection: By incorporating NMDI data, we offer early warnings of water stress, helping farmers optimize their irrigation practices.
- Yield Estimation: We combine various vegetation indices with historical data and machine learning algorithms to provide accurate yield predictions.
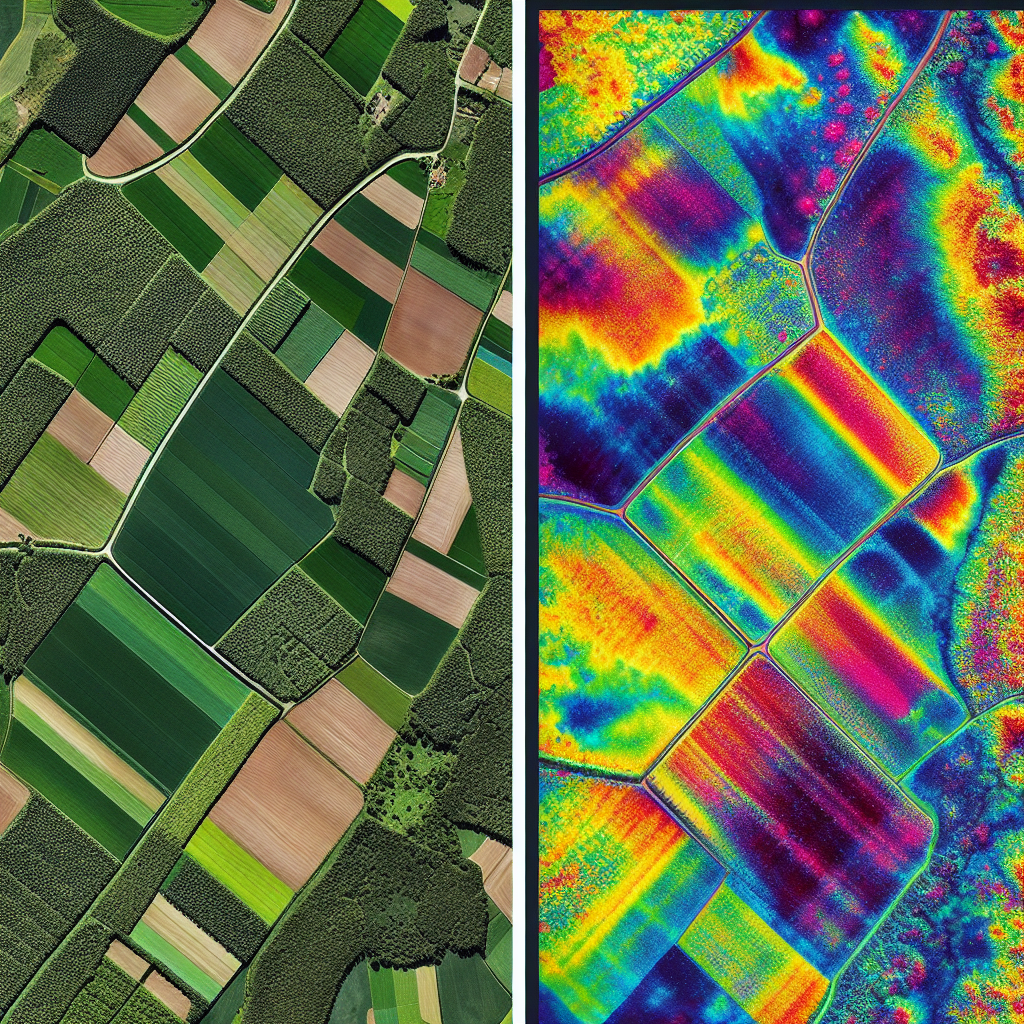
- Precision Agriculture: Our platform uses vegetation index maps to identify variability within fields, enabling targeted application of inputs like fertilizers and pesticides.
- Temporal Analysis: We track changes in vegetation indices over time, providing insights into crop growth patterns and potential anomalies.
To access these powerful tools and start optimizing your farming practices, visit our Farmonaut app or explore our API services for integration with your existing systems.
7. Comparing Satellite, Drone, and IoT-based Farm Monitoring
While there are various methods for farm monitoring, satellite-based systems like Farmonaut offer distinct advantages over drone and IoT-based solutions. Here’s a comparison table highlighting the benefits of our satellite system:
| Feature | Farmonaut Satellite System | Drone-based Monitoring | IoT-based Monitoring |
|---|---|---|---|
| Coverage Area | Large scale (entire farms/regions) | Limited (depends on flight time) | Limited (depends on sensor placement) |
| Frequency of Updates | Regular (every few days) | On-demand (requires manual flights) | Continuous (but localized) |
| Initial Setup Cost | Low | High (equipment purchase) | Medium to High (sensor network) |
| Operational Complexity | Low (automated) | High (requires trained operators) | Medium (maintenance required) |
| Data Processing | Automated and scalable | Often requires manual processing | Automated but limited in scope |
| Regulatory Compliance | No issues (uses existing satellites) | May require permits and licenses | Generally no issues |
| Scalability | Highly scalable (global coverage) | Limited by equipment and personnel | Scales with additional sensors |
As you can see, our satellite-based system offers unparalleled coverage, scalability, and ease of use compared to other monitoring methods.
8. Implementing Vegetation Indices in Your Farming Practices
Now that we’ve explored the various vegetation indices and their applications, let’s discuss how you can implement these insights into your farming practices:
- Regular Monitoring: Use our Farmonaut app (Android | iOS) to check your field’s vegetation index maps regularly. This will help you stay on top of your crop’s health and identify potential issues early.
- Targeted Interventions: Use the variability shown in vegetation index maps to guide your field operations. Apply inputs like fertilizers and pesticides only where needed, saving resources and improving efficiency.
- Irrigation Management: Utilize NMDI data to optimize your irrigation practices. Focus on areas showing signs of water stress and adjust your watering schedule accordingly.
- Yield Forecasting: Use our yield prediction tools, which incorporate vegetation index data, to plan your harvesting and marketing strategies more effectively.
- Historical Analysis: Compare current vegetation index values with historical data to identify trends and potential areas for improvement in your farming practices.
By integrating these practices into your farm management routine, you can significantly improve your crop yields, reduce input costs, and enhance the overall sustainability of your operations.
9. Future Trends in Remote Sensing for Agriculture
As technology continues to advance, we at Farmonaut are always looking ahead to the future of remote sensing in agriculture. Here are some exciting trends we’re keeping an eye on:
- Hyperspectral Imaging: Future satellites may offer hyperspectral capabilities, allowing for even more detailed analysis of crop health and soil conditions.
- AI and Machine Learning: Advanced algorithms will continue to improve the accuracy of crop health assessments and yield predictions based on vegetation index data.
- Integration with IoT: While satellite monitoring offers many advantages, we anticipate increased integration with ground-based IoT sensors for even more comprehensive farm monitoring.
- Real-time Monitoring: Advances in satellite technology may soon allow for near-real-time monitoring of crop conditions, enabling even faster responses to potential issues.
- Customized Indices: As our understanding of different crops and regions grows, we may see the development of more specialized vegetation indices tailored to specific agricultural needs.
At Farmonaut, we’re committed to staying at the forefront of these technological advancements, ensuring that our users always have access to the most cutting-edge tools for farm management.
10. FAQs
Q: How often are the vegetation index maps updated on Farmonaut?
A: Our vegetation index maps are typically updated every 3-5 days, depending on satellite availability and cloud cover.
Q: Can Farmonaut’s vegetation indices detect specific crop diseases?
A: While vegetation indices can indicate overall plant health, they cannot directly identify specific diseases. However, they can help detect stress patterns that may be indicative of disease, prompting further investigation.
Q: How accurate are the yield predictions based on vegetation indices?
A: Our yield predictions, which incorporate vegetation index data along with other factors, typically have an accuracy of 85-90%. However, this can vary depending on crop type and local conditions.
Q: Can I use Farmonaut’s vegetation index data for crop insurance claims?
A: Yes, many insurance providers accept vegetation index data as supporting evidence for crop loss claims. Our reports can be used to document crop health throughout the growing season.
Q: How does cloud cover affect the vegetation index calculations?
A: Cloud cover can interfere with satellite imagery acquisition. However, our system uses advanced cloud masking techniques and combines data from multiple satellite passes to minimize the impact of cloud cover on our vegetation index maps.
Conclusion
Vegetation indices are powerful tools that have revolutionized the way we monitor and manage agricultural lands. At Farmonaut, we’re proud to be at the forefront of applying these advanced remote sensing techniques to help farmers optimize their operations, increase yields, and promote sustainable farming practices.
By leveraging the power of different vegetation indices like NDVI, Enhanced Vegetation Index, Normalized Multi-Band Drought Index, and Visible Atmospherically Resistant Index, we provide our users with comprehensive, actionable insights into their crop health and field conditions.
We invite you to explore the power of vegetation indices and satellite-based farm monitoring by trying out our Farmonaut app or integrating our API into your existing systems. Together, we can build a more efficient, productive, and sustainable future for agriculture.
For more information on our API services and documentation, visit our API documentation page.
Ready to take your farming to the next level? Subscribe to Farmonaut today:
