Unlocking Crop Health Insights: A Deep Dive into NDVI Indices and Advanced Remote Sensing Technology

In the ever-evolving world of precision agriculture, we at Farmonaut are at the forefront of leveraging cutting-edge technology to revolutionize farming practices. One of the most powerful tools in our arsenal is the use of NDVI indices, a cornerstone of modern remote sensing in agriculture. In this comprehensive blog post, we’ll explore the intricacies of NDVI indices, their applications in crop health monitoring, and how they’re shaping the future of sustainable farming.
Table of Contents
- Understanding NDVI Indices
- The Science Behind NDVI
- Applications of NDVI in Agriculture
- Farmonaut’s Approach to NDVI Analysis
- Comparing Satellite, Drone, and IoT-based Monitoring
- Case Studies and Success Stories
- Future Trends in Remote Sensing for Agriculture
- FAQs
1. Understanding NDVI Indices
NDVI, or Normalized Difference Vegetation Index, is a key player in the world of remote sensing and precision agriculture. At Farmonaut, we utilize NDVI indices as a fundamental tool in our satellite-based crop health monitoring system. But what exactly are NDVI indices, and why are they so crucial?
What are NDVI Indices?
NDVI indices are numerical indicators that use the visible and near-infrared bands of the electromagnetic spectrum to analyze remote sensing measurements. These indices provide valuable information about vegetation density and health.
The formula for NDVI is:
NDVI = (NIR – RED) / (NIR + RED)
Where:
- NIR = reflection in the near-infrared spectrum
- RED = reflection in the red range of the spectrum
This simple yet powerful formula allows us to quantify vegetation by measuring the difference between near-infrared (which vegetation strongly reflects) and red light (which vegetation absorbs).
The Significance of NDVI Indices
NDVI indices are crucial because they provide a standardized way of measuring healthy vegetation. Healthy plants absorb most of the visible light that hits them and reflect a large portion of near-infrared light. Unhealthy or sparse vegetation, on the other hand, reflects more visible light and less near-infrared light.
At Farmonaut, we leverage these indices ndvi to offer farmers unprecedented insights into their crop health, enabling them to make data-driven decisions that optimize yield and resource use.
2. The Science Behind NDVI
To truly appreciate the power of NDVI indices, it’s essential to understand the underlying science. At Farmonaut, we believe that knowledge is power, and we’re committed to helping our users understand the tools at their disposal.
The Electromagnetic Spectrum and Plant Physiology
Plants interact with light in complex ways. Chlorophyll, the pigment responsible for photosynthesis, strongly absorbs visible light (especially in the red and blue wavelengths) for use in photosynthesis. However, it doesn’t absorb near-infrared light. Instead, plant cells have evolved to reflect near-infrared light, as absorbing it would overheat the plant and damage its tissues.
This differential interaction with visible and near-infrared light forms the basis of NDVI. By measuring the reflectance in these specific bands, we can infer a great deal about the plant’s health and vigor.
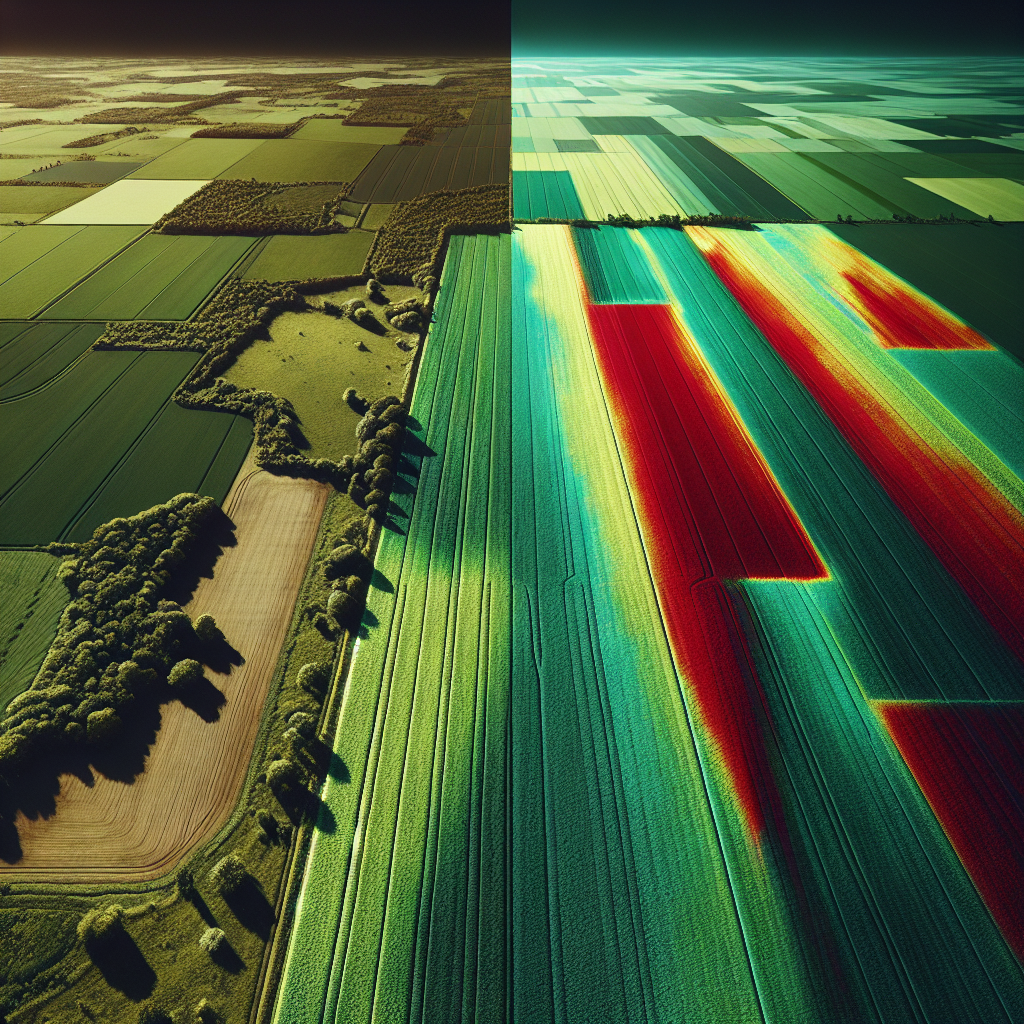
Interpreting NDVI Values
NDVI values range from -1 to +1. Here’s a general guide to interpreting these values:
- -1 to 0: Non-vegetation areas like water, barren land, ice, snow, or clouds
- 0 to 0.1: Rocks, sand, or snow
- 0.2 to 0.5: Sparse vegetation (shrubs, grasslands, or senescing crops)
- 0.6 to 1.0: Dense vegetation (temperate and tropical forests or crops at their peak growth stage)
At Farmonaut, our advanced algorithms process these NDVI indices to provide farmers with actionable insights about their crops’ health status.
3. Applications of NDVI in Agriculture
The applications of NDVI indices in agriculture are vast and varied. At Farmonaut, we harness the power of these indices to provide a range of services that revolutionize farming practices.
Crop Health Monitoring
One of the primary applications of NDVI indices is in crop health monitoring. By analyzing NDVI data over time, we can detect early signs of crop stress, disease, or pest infestation. This early detection allows farmers to take prompt action, potentially saving entire crops from failure.
Yield Prediction
NDVI indices are strongly correlated with biomass and leaf area index, making them valuable tools for yield prediction. At Farmonaut, we combine NDVI data with other parameters like weather data and historical yield information to provide accurate yield forecasts.
Irrigation Management
NDVI can also indicate water stress in plants. By monitoring NDVI indices, we help farmers optimize their irrigation schedules, ensuring that crops receive the right amount of water at the right time.
Fertilizer Application
NDVI maps can reveal areas of a field where crops are underperforming. This information allows for targeted fertilizer application, reducing waste and improving overall crop performance.
Crop Insurance and Risk Assessment
Insurance companies and financial institutions use NDVI data to assess crop health and potential risks. At Farmonaut, we provide this data to help streamline crop loan approvals and reduce fraudulent insurance claims.
4. Farmonaut’s Approach to NDVI Analysis
At Farmonaut, we’ve developed a sophisticated approach to NDVI analysis that sets us apart in the field of precision agriculture.
Advanced Satellite Imagery
We use high-resolution multispectral satellite imagery to calculate NDVI indices. Our satellites capture imagery at various wavelengths, allowing for precise NDVI calculations.
AI-Powered Analysis
Our Jeevn AI Advisory System doesn’t just calculate NDVI indices; it interprets them in context. By considering factors like crop type, growth stage, local climate, and historical data, our AI provides nuanced, actionable insights.
Temporal Analysis
We don’t just look at single-point-in-time NDVI values. Our system analyzes NDVI trends over time, providing a more comprehensive picture of crop health and development.
Integration with Other Data Sources
We integrate NDVI data with other sources like weather forecasts, soil moisture data, and historical yield information. This holistic approach allows for more accurate predictions and recommendations.
User-Friendly Visualization
We present NDVI data in easy-to-understand formats, including color-coded maps and trend graphs. This makes it simple for farmers to identify problem areas and track crop progress.
5. Comparing Satellite, Drone, and IoT-based Monitoring
While there are various methods for farm monitoring, at Farmonaut, we believe that satellite-based systems offer significant advantages. Here’s a comparison of how our Satellite System stacks up against drone and IoT-based monitoring:
| Feature | Farmonaut Satellite System | Drone-based Monitoring | IoT-based Monitoring |
|---|---|---|---|
| Coverage Area | Large scale (100s to 1000s of hectares) | Medium scale (10s to 100s of hectares) | Small scale (typically <10 hectares) |
| Frequency of Data Collection | Regular (every few days) | On-demand (limited by battery life and regulations) | Continuous |
| Initial Setup Cost | Low | High (drone purchase, training) | Medium to High (sensor network setup) |
| Ongoing Operational Cost | Low | Medium (maintenance, pilot costs) | Low to Medium (sensor maintenance) |
| Ease of Use | High (no on-site equipment needed) | Medium (requires trained operator) | Medium (requires technical setup and maintenance) |
| Data Processing Time | Fast (automated processing) | Medium (manual flight planning and data processing) | Fast (real-time data) |
| Weather Dependency | Low (can penetrate clouds) | High (affected by wind, rain) | Low |
| Regulatory Compliance | Easy (no special permissions needed) | Complex (aviation regulations) | Moderate (depends on local IoT regulations) |
As you can see, our satellite-based system offers a unique combination of wide coverage, cost-effectiveness, and ease of use that makes it ideal for precision agriculture at scale.
6. Case Studies and Success Stories
At Farmonaut, we’ve had the privilege of working with farmers and agribusinesses across the globe, helping them leverage NDVI indices to improve their operations. Here are a few success stories:
Large-Scale Wheat Farming in India
A cooperative of wheat farmers in Punjab, India, used our NDVI-based crop health monitoring to optimize their fertilizer application. By identifying areas of low NDVI, they were able to apply fertilizer more precisely, resulting in a 15% increase in yield and a 20% reduction in fertilizer costs.
Vineyard Management in California
A vineyard in Napa Valley used our NDVI analysis to detect early signs of grapevine leafroll disease. Early intervention based on our data allowed them to contain the spread of the disease, saving an estimated $100,000 in potential crop losses.
Coffee Plantation in Brazil
A large coffee plantation in Brazil used our temporal NDVI analysis to optimize their irrigation schedule. By correlating NDVI trends with water stress, they were able to reduce water usage by 30% while maintaining crop quality.
7. Future Trends in Remote Sensing for Agriculture
As leaders in agricultural technology, we at Farmonaut are always looking ahead to the future of remote sensing and precision agriculture. Here are some trends we’re excited about:
Hyperspectral Imaging
While NDVI indices use a few specific bands of the electromagnetic spectrum, hyperspectral imaging captures data from across the spectrum. This could allow for even more detailed crop health analysis, potentially detecting specific nutrient deficiencies or diseases.
Integration with IoT
While our satellite-based system offers many advantages, we see potential in integrating it with ground-based IoT sensors. This could provide a more comprehensive picture of crop health and field conditions.
Advanced AI and Machine Learning
As AI technology advances, we anticipate being able to provide even more accurate predictions and personalized recommendations based on NDVI and other remote sensing data.
Blockchain for Data Integrity
We’re exploring the use of blockchain technology to ensure the integrity and traceability of remote sensing data, which could be particularly valuable for organic certification and supply chain transparency.
8. FAQs
Q: What is the difference between NDVI and other vegetation indices?
A: While NDVI is one of the most widely used vegetation indices, there are others like EVI (Enhanced Vegetation Index) and SAVI (Soil-Adjusted Vegetation Index). These indices may be better suited for specific conditions or environments. At Farmonaut, we use NDVI as our primary index due to its reliability and wide applicability, but we also incorporate other indices where appropriate.
Q: How often should I monitor NDVI for my crops?
A: The frequency of NDVI monitoring depends on various factors including crop type, growth stage, and local conditions. Generally, we recommend monitoring every 5-7 days during critical growth stages. Our Farmonaut app provides regular updates based on the optimal monitoring frequency for your specific crops.
Q: Can NDVI detect specific diseases or pests?
A: While NDVI can detect general plant stress, it typically can’t identify specific diseases or pests. However, our AI system uses NDVI data in combination with other factors to suggest potential causes of stress, which can include specific diseases or pests common to your region and crop type.
Q: How accurate are yield predictions based on NDVI?
A: The accuracy of yield predictions based on NDVI can vary depending on factors like crop type, environmental conditions, and the stage of the growing season. In general, our yield predictions become more accurate as the season progresses. We typically achieve accuracy rates of 85-90% for major grain crops when combining NDVI with our other data sources and AI analysis.
Q: Can NDVI be used for all types of crops?
A: NDVI is useful for most types of crops, but its effectiveness can vary. It’s particularly effective for crops with broad leaves and dense canopies. For some crops, like certain vegetables or orchard crops, we may use additional indices or analysis methods to provide the most accurate insights.
Conclusion
NDVI indices have revolutionized the way we monitor and manage crops, providing invaluable insights into crop health and productivity. At Farmonaut, we’re proud to be at the forefront of this technology, leveraging advanced satellite imagery and AI to make precision agriculture accessible to farmers worldwide.
Whether you’re a small-scale farmer looking to optimize your crop yield or a large agribusiness seeking to manage vast tracts of land more efficiently, our NDVI-based solutions can help you achieve your goals. We invite you to explore our services and see how Farmonaut can transform your farming practices.
Ready to experience the power of NDVI and advanced remote sensing for yourself? Visit our app page to get started, or check out our API documentation if you’re a developer looking to integrate our technology into your own systems.
Download our app now:
For more technical details on our satellite and weather API, check out our developer documentation.
Ready to take your farming to the next level? Subscribe to Farmonaut today:
Join us in revolutionizing agriculture with the power of NDVI indices and advanced remote sensing technology!
