

Mining economics · Cost and margin guide
Is Mining a Good Business? Margins and AISC by Metal
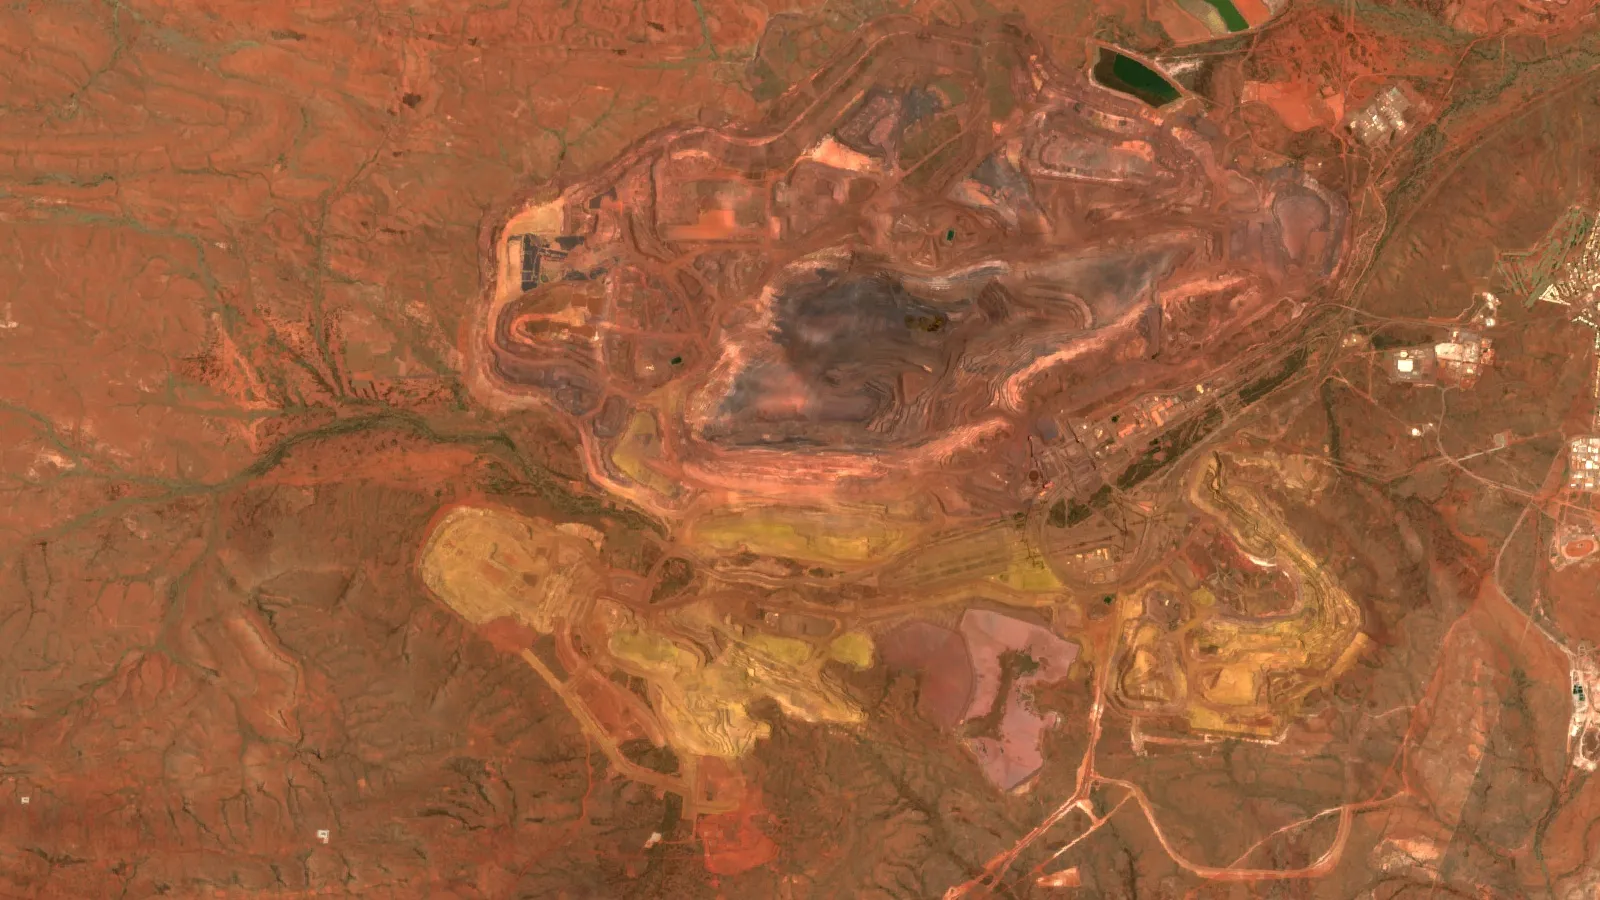
Large producers earned a wide gap between price and cost in 2026: 58% of the gold price at Barrick, 75% of silver at Pan American Silver. The gap is not profit, and it moves with grade, fuel and price.
Key takeaways
- Barrick: realised gold US$4,417/oz vs AISC US$1,866/oz in Q2 2026, a gap of 58% of price (Barrick, Aug 2026).
- Rio Tinto first-half 2026 EBITDA margins: copper about 66%, iron ore 48%, aluminium and lithium 33% (Rio Tinto, 29 Jul 2026).
- Newmont site AISC ranged from US$1,128 to US$3,151/oz in Q2 2026, so company averages hide the real spread (Newmont, 2026).
- AISC leaves out growth capital, tax and interest, so a wide gap is not profit.
- Gold, silver, copper and iron ore prices moved very differently from 2021 to 2025 (USGS, 2026).
In this article
- Is mining a good business? What company results show
- Which mining is most profitable? Margins by commodity
- What all-in sustaining cost (AISC) means
- AISC by mine: the same metal, very different costs
- What drives a mine's margin: grade, cost and by-products
- How price swings change profit
- Is mining gold profitable?
- What a mine costs before it earns anything
- Check a mine's margin with your own numbers
- How to judge a mining project before you commit
- Frequently asked questions
Mining can be a very profitable business, but the margin depends on one gap: the metal price minus the cost of producing it. In the second quarter of 2026, Barrick reported a realised gold price of US$4,417 per ounce against an all-in sustaining cost (AISC) of US$1,866 per ounce, a gap of about US$2,551 per ounce, or 58% of the price (Barrick, Q2 2026 results, August 2026). The gap can shrink fast: Barrick’s AISC rose 11% in a year, and one Newmont site went from US$1,109 to US$3,151 per ounce between the second quarters of 2025 and 2026.
This guide compares gold, silver, copper and iron ore with dated company figures, explains what AISC counts and leaves out, shows why two mines producing the same metal can differ by a factor of almost three, and ends with a calculator for your own numbers. It reports facts from company filings and government data. It is not investment advice.
Is mining a good business? What company results show
For large producers with a good orebody, recent results say yes: price minus cost left a wide gap in every case below. The harder questions are how long that gap lasts, how much capital it takes to get there, and whether a smaller project has the same costs as a company that runs several mines. The table sets out the latest quarterly or half-year figures from company filings.
| Metal and company (period) | Price | Reported cost | Gap | Cost basis |
|---|---|---|---|---|
| Gold, Barrick (Q2 2026) | US$4,417/oz realised | US$1,866/oz | US$2,551/oz (58%) | AISC |
| Gold, Pan American Silver gold segment (Q2 2026) | US$4,402/oz realised | US$1,984/oz | US$2,418/oz (55%) | AISC net of other-metal credits |
| Silver, Pan American Silver (Q2 2026) | US$70.97/oz realised | US$17.80/oz | US$53.17/oz (75%) | AISC net of other-metal credits |
| Copper, Freeport-McMoRan (Q2 2026) | US$6.17/lb realised | US$1.97/lb | US$4.20/lb (68%) | Unit net cash cost, after by-product credits, before sustaining capital |
| Copper, Barrick (Q2 2026) | US$6.05/lb market average | US$3.95/lb | US$2.10/lb (35%) | AISC |
| Iron ore, Rio Tinto Pilbara (first half 2026) | US$85.2/wmt FOB realised | US$25.0/t | US$60.2/t (71%) | Unit cost, not an AISC |
Sources: Barrick, Pan American Silver, Freeport-McMoRan and Rio Tinto half-year report. Gaps are our subtraction, before income tax, growth capital and financing, so they are not profit. The cost bases differ, which is why the Freeport and Pilbara lines are not directly comparable with an AISC. Gold, silver and copper prices move daily, so check today’s price at LBMA, LME or Kitco before using any of these figures.
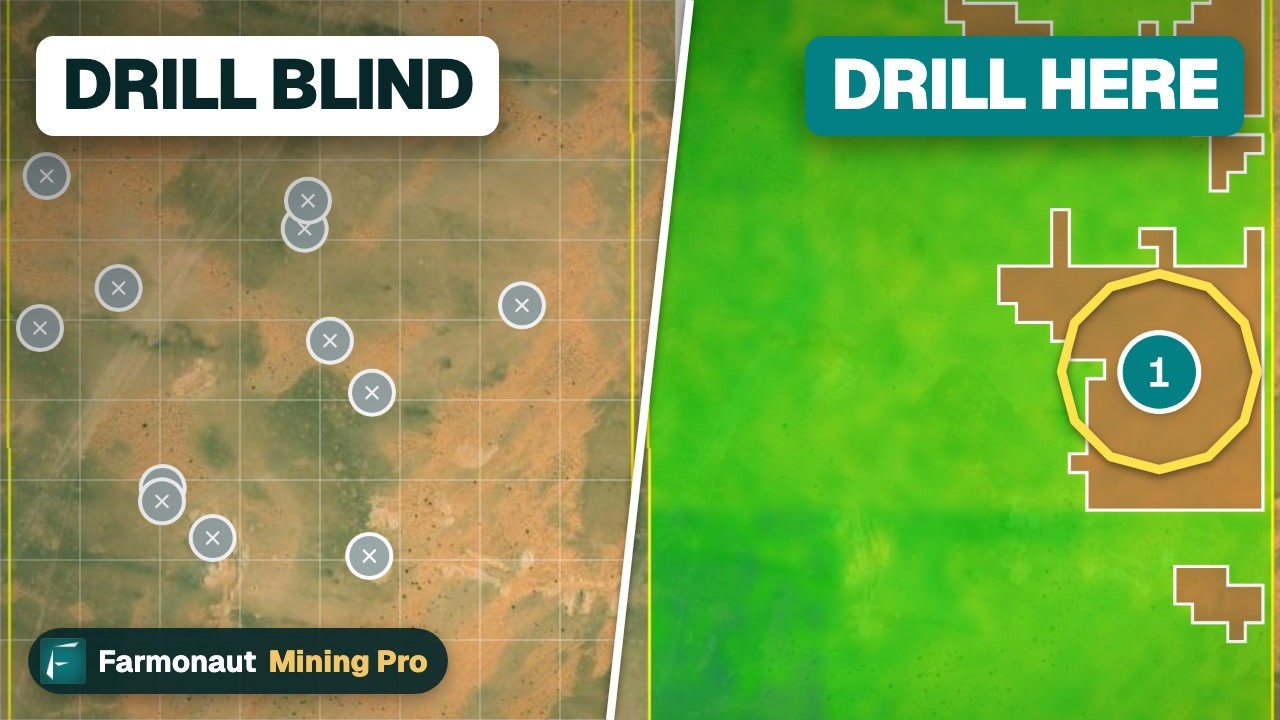
▶ Follows the money from mining: exports, jobs, revenue and energy-transition minerals. · 5:03
Which mining is most profitable? Margins by commodity
Of the three Rio Tinto segments we can compare, copper earned the highest underlying EBITDA margin in the first half of 2026. EBITDA is earnings before interest, tax, depreciation and amortisation. Dividing the segment figures in Rio’s half-year report gives copper 66% (US$5.7 billion on US$8.6 billion of revenue), iron ore 48% (US$6.8 billion on US$14.0 billion) and aluminium and lithium 33% (US$3.3 billion on US$10.0 billion) (Rio Tinto, 2026 half-year results, 29 July 2026). These are margins on sales, a different measure from the per-unit gaps above.
Chart
Underlying EBITDA margin by Rio Tinto segment, first half of 2026
Per cent of segment revenue (our division of Rio’s reported figures)
The ranking is a snapshot of one half-year at one set of prices. Rio reported a realised copper price of 591 US cents per pound, up 35% on the first half of 2025, which helps explain the copper result. Its realised lithium carbonate price was US$18,960 per tonne, up 22%, but the US Geological Survey shows how violent that market is: its annual average battery-grade lithium carbonate price fell from US$63,700 per tonne in 2022 to an estimated US$9,000 in 2025, in real terms (USGS, Mineral Commodity Summaries 2026, lithium). A commodity that is the most profitable this year is often the least profitable a few years later.
As a share of price, silver shows the widest gap in the table above (75%), ahead of Pilbara iron ore (71%) and Freeport copper (68%); gold is lower at 55-58%. Silver is the clearest case: Pan American Silver’s silver AISC fell from US$19.66 to US$17.80 per ounce between the second quarters of 2025 and 2026 while its realised price rose from US$32.91 to US$70.97. Gold followed a similar path in price but costs rose instead of falling, as the next sections show. For a list of the companies behind the biggest gold output, see our guide to the top gold mining companies by output.
What all-in sustaining cost (AISC) means
All-in sustaining cost is the figure most gold and silver miners use to say what it costs to keep a mine running. It was first defined by the World Gold Council in 2013 and the council has since issued an updated guidance note (World Gold Council, all-in sustaining costs). Barrick says its AISC starts with cash costs per ounce and adds sustaining capital spending, sustaining leases, general and administrative costs, mine-site exploration tied to the current mine plan and reclamation costs (Barrick, Q2 2026 results). Fresnillo describes the same idea as a reasonable indicator of a mine’s ability to generate cash when compared with the metal price (Fresnillo, interim results, 30 June 2026).
AISC leaves out growth capital for new projects and major expansions, income tax, and interest. A mine can therefore show a healthy gap on AISC and still earn little after it has paid back a new plant. The World Gold Council also notes that site-level AISC can mislead if corporate overhead is not allocated, and asks companies to say whether they report on a consolidated or attributable basis. When you compare two companies, check both points.
Reporting choices move the number too. Newmont reported a gold co-product AISC of US$1,938 per ounce for the second quarter of 2026, and in the same document a gold by-product AISC of US$1,621 per ounce, because the by-product version treats copper, silver, lead and zinc sales as credits against gold cost (Newmont, Q2 2026 operating statistics). Same mines, same quarter, US$317 apart. The World Gold Council publishes a quarterly global cost curve built by Metals Focus that ranks mines on one definition, which is a fairer way to compare (World Gold Council, AISC cost curve).
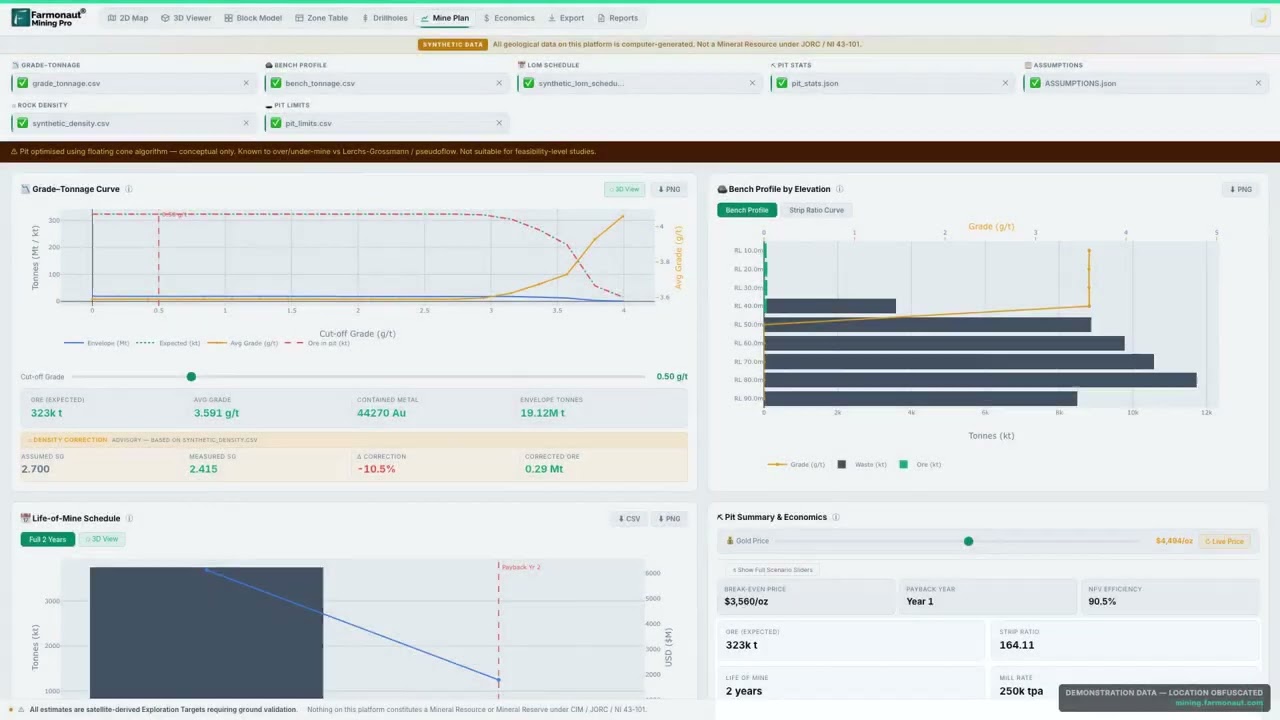
▶ Course chapter on building a cost picture: AISC per ounce, break-even price, NPV and payback. · 14:58
AISC by mine: the same metal, very different costs
Newmont’s second-quarter 2026 statistics list co-product AISC for each site. Yanacocha reported US$1,128 per ounce and Cadia US$3,151, a ratio of 2.8 to 1, inside one company with one set of accountants (Newmont, Q2 2026 operating statistics). Cadia’s figure reflects an operating stoppage after a seismic event in the quarter, so it is an extreme case, but it shows how a single event moves a quarterly number. Tanami (US$2,033) and Brucejack (US$2,156) sit above Nevada Gold Mines (US$1,805) and Boddington (US$1,622).
Chart
Gold co-product AISC at selected Newmont sites, Q2 2026
US$ per ounce
This is why the average cost for a company or a country tells a small owner little. What matters is where a particular mine sits on the cost curve, and whether it stays there when grades fall, fuel prices rise or the local currency strengthens.
What drives a mine’s margin: grade, cost and by-products
Company reports do not rank deposit types, and none says that one geological type earns more than another. What the reports do show is the list of cost drivers that differ from deposit to deposit.
Chart
Gold AISC at selected Newmont sites, a year apart
US$ per ounce, co-product basis
- Grade. Barrick says its second-quarter 2026 gold cost of sales rose to US$1,993 per ounce from US$1,654 mainly because of lower grades processed at Carlin, Cortez and North Mara, together with higher fuel and royalties (Barrick, Q2 2026 results). Grade is the amount of metal per tonne of ore, for example grams per tonne (g/t) for gold. Less metal in each tonne means the same mining and milling cost is spread over fewer ounces.
- Currency and fuel. Rio Tinto’s Pilbara unit cost rose US$0.7 per tonne to US$25.0 in the first half of 2026, including a US$2.1 per tonne headwind from a stronger Australian dollar and US$0.8 from higher diesel prices (Rio Tinto, 2026 half-year results).
- By-products. Several Newmont mines sell more than one metal: Boddington and Cadia report copper alongside gold, and Peñasquito reports silver, lead and zinc (Newmont, Q2 2026 operating statistics). Sales of the second metal can lower the cost of the first, or add price risk to both.
- Royalties. Barrick links part of its cost increase to royalties that rise with the realised gold price, so a higher price does not drop entirely to the bottom line.
- Land access. Rich ground is worth nothing if it cannot be mined, a point our video below makes with a survey where 59% of the anomalous ground sat under a town.
A satellite screen of a licence cannot give a cost per ounce, but it can show which parts of a property have alteration or surface signs worth drilling, and which sit under roads, water or settlements. That narrows the area where grade, the biggest cost driver, has to be proved. Satellite results are exploration targets, not a resource estimate.
How price swings change profit
Cost is only half of the gap. USGS data show how different the price paths of the main metals have been. Between 2021 and 2025 (estimated for 2025), the average gold price rose from US$1,801 to US$3,300 per troy ounce and silver from US$25.23 to US$38, while the US producer price of copper cathode rose from 432.3 to 490 cents per pound and the average unit value of US iron ore fell from US$141.78 to US$89 per tonne (USGS gold, silver, copper and iron ore, Mineral Commodity Summaries 2026). The chart indexes the four series to 2021.
Chart
Average price of four metals, indexed to 2021 = 100
US gold, silver and copper prices and US iron ore unit value; 2025 is an estimate
A producer whose costs rose about 20% over those years was far better off in gold than in iron ore. This is also why mining companies publish a break-even price: the metal price at which the margin is zero. If the gap is wide, a price fall of 30% still leaves a margin. If the gap is narrow, it does not.
Is mining gold profitable?
For the producers in this guide, yes: gold showed a gap of 55-58% of the price in the table, and USGS estimated that US mines produced 160 tonnes of gold in 2025, valued at about US$17 billion, 32% more than in 2024 (USGS, Mineral Commodity Summaries 2026, gold). Barrick produced 796,000 ounces in the second quarter of 2026 at an AISC of US$1,866 per ounce, up 11% on a year earlier, and Newmont’s core portfolio AISC rose from US$1,582 to US$1,938 per ounce (an increase of about 22%).
So gold mining is profitable at this scale, but profits depend on the price staying well above a rising cost. A gold project that needs a price near its AISC to break even carries real risk, while one with a large gap can absorb a price fall. For US gold output by site, see our guide to the largest active US gold mines and the ranking of gold producing countries. For US copper producers, see US copper mining companies ranked by output.
What a mine costs before it earns anything
A margin per ounce is only the later chapter. Before it, a mine spends years on exploration, studies, permits and construction. Rio Tinto’s iron ore capital investment, excluding the Simandou project, rose 34% to US$2.1 billion in the first half of 2026 as it builds replacement mines in the Pilbara, with first production from Brockman Syncline 1, Hope Downs 2 and West Angelas on track for 2027 (Rio Tinto, 2026 half-year results). Barrick lowered its 2026 attributable capital spending guidance to US$3.8-4.2 billion, and says first copper from its Lumwana Super Pit Expansion is targeted for the end of the first quarter of 2028 (Barrick, Q2 2026 results).
For a licence owner, these projects are the scale at which the table margins apply. A smaller operation has to price its own mill, haulage, power, labour and permitting, and cannot assume the same cost as a company that shares overhead across many mines. Closing costs matter as well: tailings, the waste left after milling, must be stored safely for decades. Our guide to tailings management and gold mine costs covers that cost line.
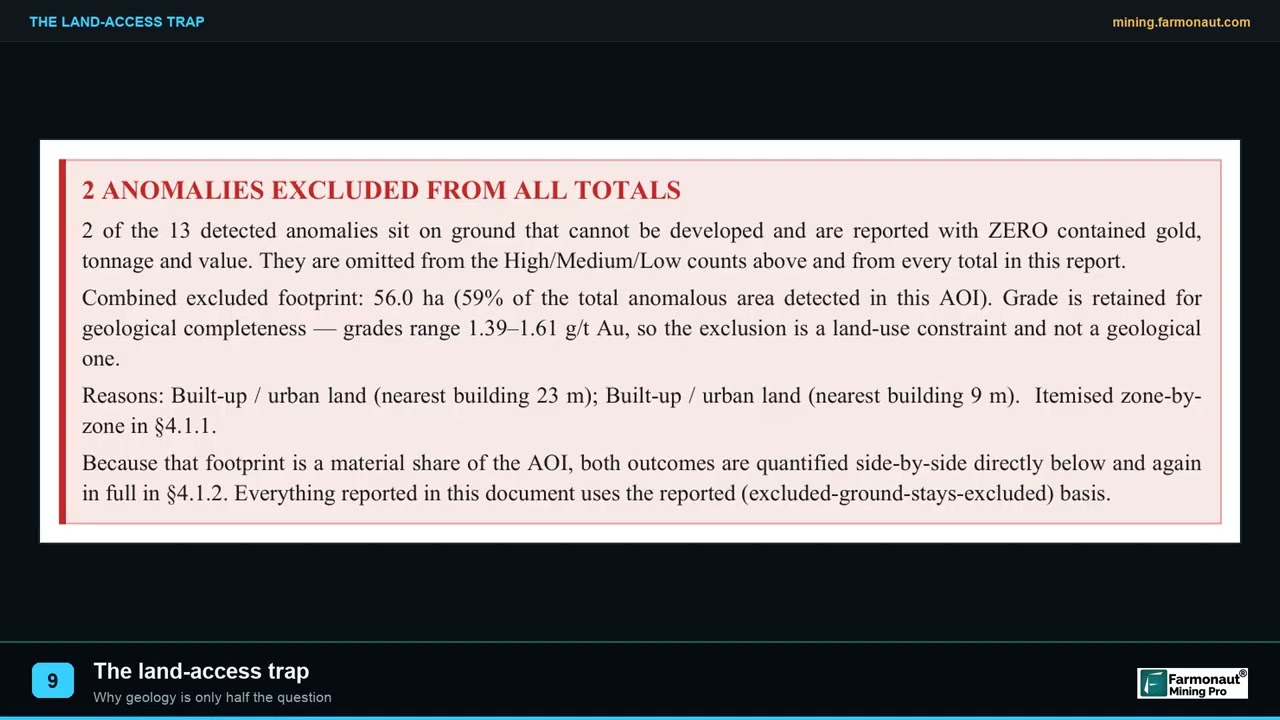
▶ A survey where 59% of the anomalous ground sat under a town: good rock blocked by land access. · 2:05
Check a mine’s margin with your own numbers
The calculator below applies the same arithmetic as the tables. Enter the ounces you expect to sell, your own AISC, and a gold price you choose. The default values are round examples, not a forecast or any company’s figures.
Calculator
What is the margin on a gold mine at my price and cost?
Enter your own ounces, AISC, price, tax rate and growth capital.
- Gap as share of price: 50.0%
- Annual gap before tax: $200,000,000
- Annual gap after tax: $150,000,000
- Years to repay growth capital: 1.0 years
Example values only, not a forecast or any company’s figures. Gold price is an input: example, use today’s price (US$ per troy ounce). Tax is applied as a flat rate on the margin and ignores depreciation, royalties not in AISC and financing, so treat the result as a first screen, not a valuation.
How to judge a mining project before you commit
- Find the cost basis. Ask whether a quoted cost is cash cost, AISC or all-in cost, and whether it is net of by-product credits.
- Place it on the cost curve. Compare the project with the World Gold Council or a similar cost curve, not with a company average.
- Stress the price. Run the margin at a price 20% and 40% below today’s.
- Add what AISC leaves out. Growth capital, tax, royalties and closing costs.
- Check access and permits. Land, water, power and approvals can stop good rock from being mined.
- Check the grade evidence. Grade drives the cost per ounce, so look for drilling, assays and independent review rather than a headline number.
For a resource table, see our explainer on how to read a JORC resource table. Farmonaut can map a licence area from Sentinel-2 and other satellite data in 5 to 20 business days from a KML, KMZ or polygon, which helps screen ground before drilling money is spent.
Frequently asked questions
Is mining a good business?
It can be for producers with a large gap between price and cost. In the second quarter of 2026 that gap was about 58% of the gold price at Barrick and 75% of the silver price at Pan American Silver, before tax and growth capital. It also needs years of capital and carries price and cost risk.
Is mining gold profitable?
For large producers at 2026 prices, yes. Barrick’s AISC was US$1,866 per ounce against a realised US$4,417. Costs are rising, though: Barrick’s AISC rose 11% and Newmont’s core AISC about 22% in a year.
Which mining is most profitable?
In Rio Tinto’s first-half 2026 segments, copper had the highest EBITDA margin at about 66%, ahead of iron ore at 48% and aluminium and lithium at 33%. As a share of price, silver shows the widest gap in the table (75%), then iron ore (71%), Freeport copper (68%) and gold (55-58%), though the cost bases differ. The ranking changes with prices.
Which mining deposits are most profitable right now?
Company filings do not rank deposit types. They show that grade, by-product credits, fuel, currency and royalties decide a mine’s margin, and that cost within one company ranged from US$1,128 to US$3,151 per ounce across Newmont sites in the second quarter of 2026.
What is a good AISC for a gold mine?
There is no fixed number. In the second quarter of 2026, reported figures ranged from US$1,621 per ounce (Newmont, by-product basis) to US$1,866 (Barrick) and US$1,984 (Pan American Silver gold segment), against realised prices near US$4,400; these are dated examples, not a benchmark. Compare the AISC with the gold price and with the world cost curve. The World Gold Council publishes the global AISC curve quarterly, built by Metals Focus.
What are mining industry margins by commodity?
This page gives dated examples: Rio Tinto segment EBITDA margins of about 66% for copper, 48% for iron ore and 33% for aluminium and lithium in the first half of 2026. Margins for other commodities depend on each company’s reports.
How much does a mine make?
It depends on tonnes, grade, recovery, price and cost. A producer selling 100,000 ounces at a US$2,500 gap earns about US$250 million a year before tax and growth capital. Use the calculator on this page with your own inputs.
What does AISC leave out?
Growth capital for new projects, income tax and interest. Check how a company defines it, since reporting choices can change the number by hundreds of dollars per ounce.
Is small-scale mining as profitable as the big companies?
The figures here come from large producers. A small operator has different costs for processing, haulage, power and permits, so use your own quotes in the calculator instead of company averages.
How do I check a mining claim before buying?
Confirm the licence status with the regulator (and get legal advice before you buy), check access and water, and review assays and maps. Satellite screening can show alteration and surface disturbance, but only drilling shows grade.
This page is for information only. It is not investment advice or legal advice. Company figures are as reported for the periods stated and may be restated. Confirm licence and claim rules with the regulator.
Farmonaut mining
Screen your licence area from space
Get a quote for a satellite mineral detection report on your licence, to prioritise ground before drilling.
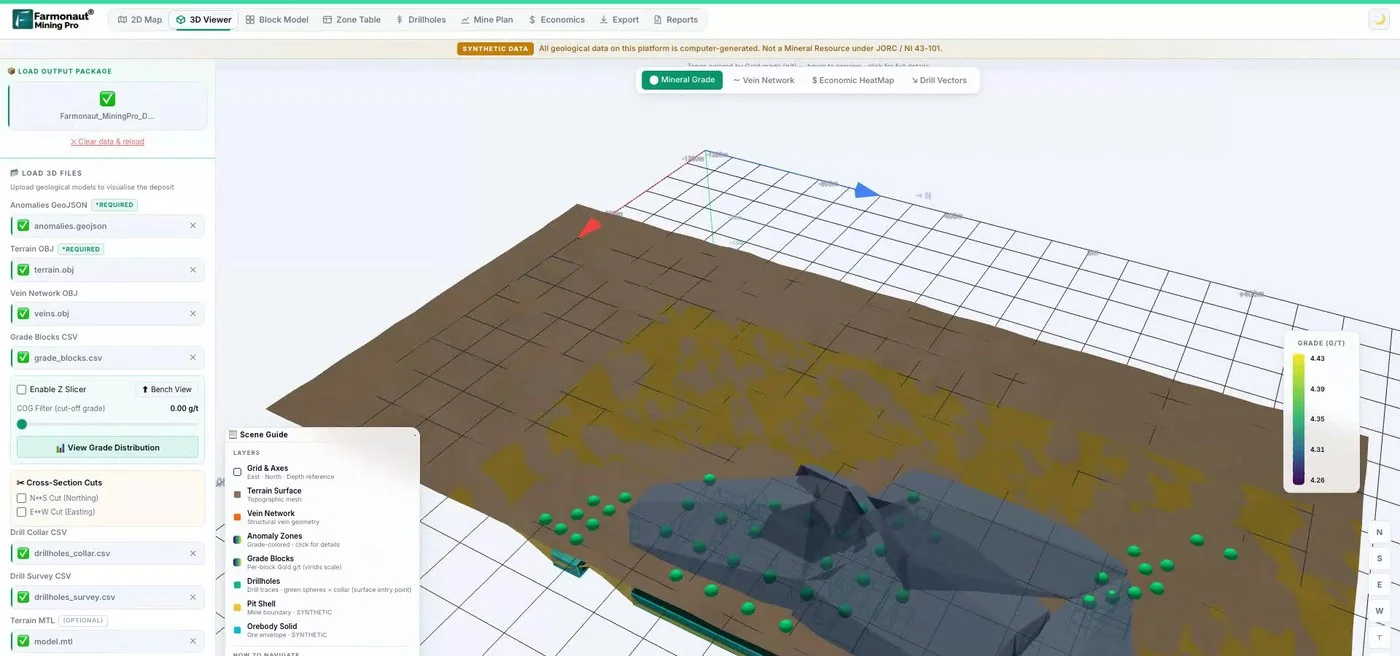
Mining Pro sample view, synthetic data
Keep reading
Sources
- Barrick, Second Quarter 2026 Results (10 Aug 2026): s25.q4cdn.com
- Newmont, Q2 2026 Operating Statistics: s24.q4cdn.com
- Freeport-McMoRan, Second-Quarter 2026 Results (23 Jul 2026): s22.q4cdn.com
- Rio Tinto, 2026 Half Year Results (29 Jul 2026): announcements.asx.com.au
- Pan American Silver, Q2 2026 results: panamericansilver.com
- World Gold Council, All-in sustaining costs and all-in costs: gold.org
- World Gold Council, AISC gold cost curve (Metals Focus): gold.org
- Fresnillo, Interim Results, six months to 30 June 2026: investegate.co.uk
- USGS, Mineral Commodity Summaries 2026: Gold: pubs.usgs.gov
- USGS, Mineral Commodity Summaries 2026: Silver: pubs.usgs.gov
- USGS, Mineral Commodity Summaries 2026: Copper: pubs.usgs.gov
- USGS, Mineral Commodity Summaries 2026: Iron ore: pubs.usgs.gov
- USGS, Mineral Commodity Summaries 2026: Lithium: pubs.usgs.gov
Discussion
Questions, corrections or field experience? Share them below. First-time comments are reviewed before they appear, and your email is never published.
No comments yet. Be the first to add a question or your experience.

 Qader Group
 Ileys General Trading
 SG Gold Mining LLC
 VRV Global Pte Ltd
 Omsri International FZE
 G.I.T.T.
 Jaunita Erss Ltd
 Almosi SARL
 SRK Consulting
 Berks Gold Limited
 Mwerezi Minerals Company Limited
 Mining SARL
 SenGold Invest SAS
 Sean Mining Limited
 NTS Group (Pty) Ltd
 Mine4Africa
 Lithspo Minerals Limited
 Tintina Mining Group

 Licence holder · Nigeria · Gold + lithium










