

Crop monitoring · Buyer’s guide
7 Crop Scouting Apps That Will Transform Your Farming
The best apps for crop monitoring and scouting each do a different job. Satellite crop monitoring apps like Farmonaut and OneSoil watch whole fields from space, Plantix diagnoses a sick plant from a photo, and FarmQA, TELUS Agronomy and Taranis are built for agronomists and ag retailers.
Key takeaways
- A satellite crop monitoring app (Farmonaut, OneSoil, Atfarm) is best for checking many fields at once without walking them.
- A photo diagnosis app (Plantix) is best for identifying a pest, disease or nutrient problem on a single plant.
- Agronomist platforms (FarmQA, TELUS Agronomy, Taranis) are best for advisors who write scouting reports and recommendations for many growers.
- Most satellite apps use NDVI, a crop health score made from satellite images, to show where a field is struggling.
- No crop scouting app replaces walking the field. Use the app to decide where to walk first.
Disclosure: Farmonaut makes one of the apps on this list. We have labelled it, and we compared every app on the same points using each company’s own website and app store listing.
In this article
- Best crop monitoring apps compared
- The 7 apps, reviewed
- How we chose these apps
- How to choose the best crop monitoring app
- Why crop scouting apps matter
- How satellite crop monitoring works
- Benefits of digital crop monitoring
- How to start crop scouting with an app
- Features every app should offer
- Challenges to plan for
- Future of crop monitoring apps
- FAQ
Best Crop Monitoring and Scouting Apps Compared
This table compares the top 7 crop scouting apps side by side. Start with the “Best for” column: it tells you which crop monitoring app fits your job.
| App | Best for | How it sees the crop | Platforms | Price model |
|---|---|---|---|---|
| FarmonautOurs | Satellite crop monitoring of many fields from a phone or browser | Satellite imagery + AI advisory | Android, iOS, web, API | Paid subscription, priced by area |
| Plantix | Diagnosing a sick plant from a photo | Your phone camera + AI | Android | Free |
| FarmQA | Agronomists writing field scouting reports | Field notes, photos, imagery | Android, iOS, web | Paid, free trial |
| OneSoil | Free satellite NDVI checks on a few fields | Satellite imagery | Android, iOS, web | Free app, paid Pro |
| TELUS Agronomy | Ag retailers needing label-checked recommendations (formerly Agrian) | Field observations, photos | Web, iOS | Paid (by quote) |
| Atfarm by Yara | Nitrogen planning and variable-rate fertiliser | Satellite imagery + N-Tester | Android, iOS, web | Free to download |
| Taranis | Large row-crop farms working with an advisor | Leaf-level drone imagery + AI | Web, iOS | Paid, through ag retailers |
Checked against each company’s website and app store listing on 12 October 2026. Prices and features change, so confirm before you buy.
The 7 Best Crop Scouting and Crop Monitoring Apps, Reviewed
The market for crop scouting apps is large, but only a few combine useful insights, ease of use and fair pricing. Here are the seven digital crop monitoring and field scouting apps that stand out for farmers, agronomists and agribusinesses, with what each one does best and what to watch out for.
Farmonaut: Satellite Crop Monitoring App for Many Fields
Best for monitoring many fieldsOur product
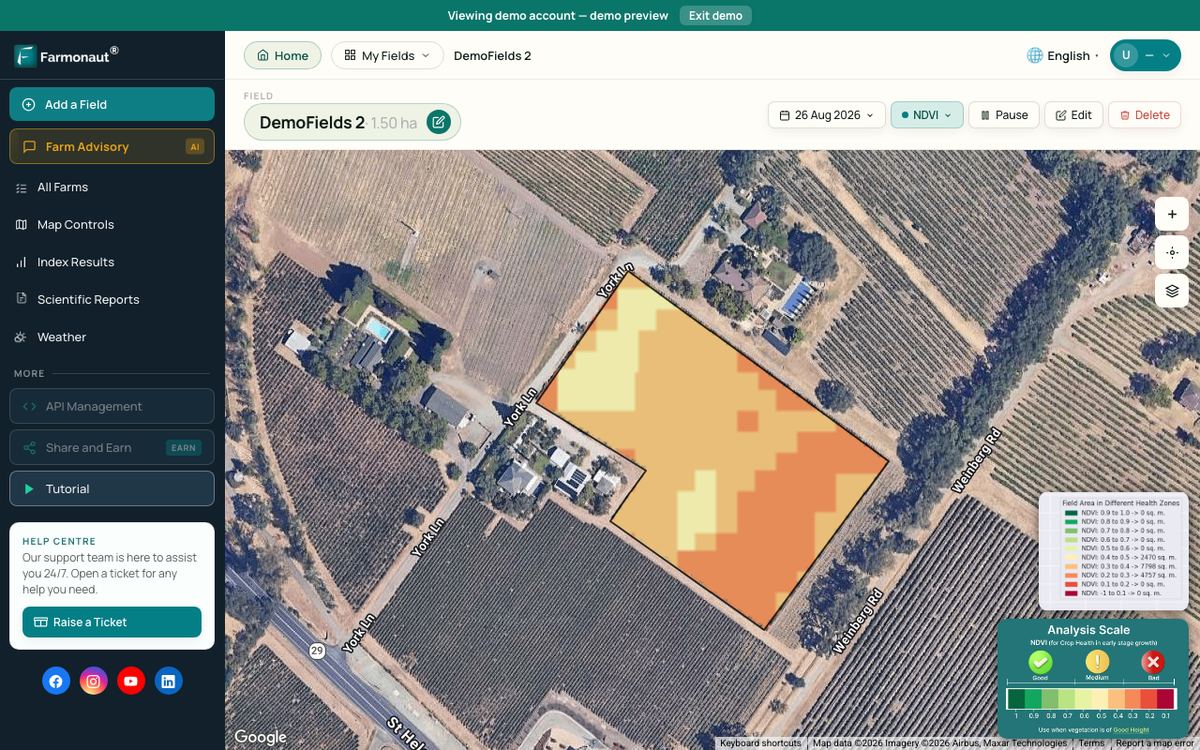
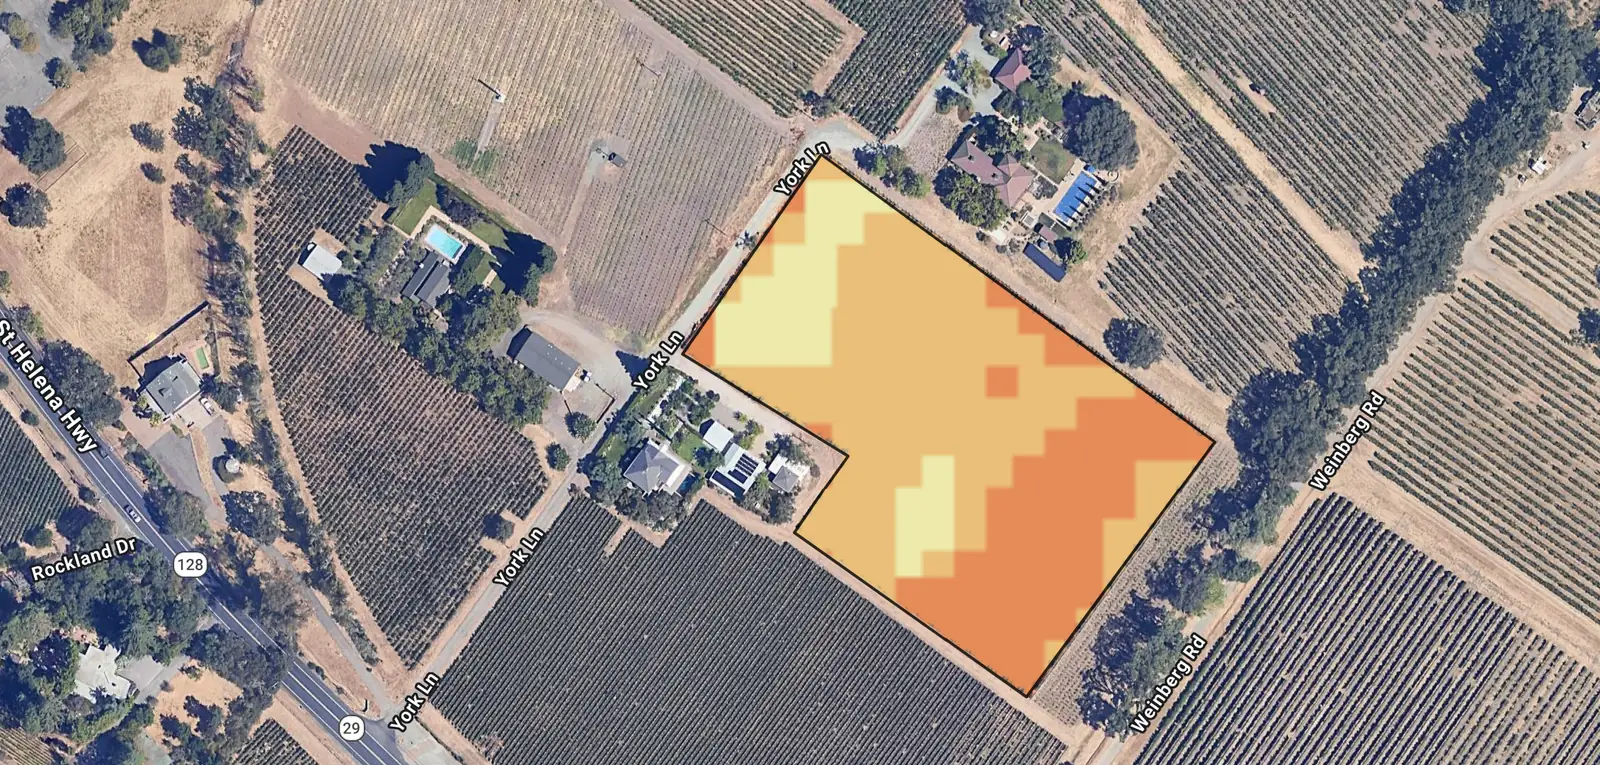
Farmonaut is a satellite crop monitoring app. It uses multispectral satellite images to map crop health, soil moisture and growth on every field you add, so you can see which part of a field needs attention before you go out. You draw the field boundary once, and new crop health maps arrive as fresh satellite images come in. Its AI-based JEEVN advisory turns those maps and the local weather into practical advice. You can read more about it in our guide to the Farmonaut crop scouting app.
- Satellite crop health monitoring: NDVI, soil moisture and growth maps from multispectral satellite data, across every field area.
- AI-based JEEVN advisory: crop management advice and weather forecasts for your exact field.
- Blockchain traceability: secure product tracking through the supply chain. Farmonaut Traceability
- Carbon footprinting: track and reduce the farm’s emissions. Farmonaut Carbon Footprinting
- Resource and fleet management: track vehicles and machinery to cut costs. Farmonaut Fleet Management
- Large-scale farm management: map and oversee plantations of any size. Agro-Admin App
- Crop loan and insurance verification: satellite checks that speed up loans and cut insurance fraud. Crop Loan & Insurance
- API for developers: add Farmonaut satellite and weather data to your own software. Satellite API · Developer docs
Pros
- No hardware or drones needed
- Watches every field at once
- Works for all major food and fibre crops
- Web, Android, iOS and API
Cons
- Paid subscription, priced by area
- Satellite images refresh every few days, and clouds can delay them
- Pair with field walks for insect counts
- Platforms
- Android, iOS, web, API
- Price
- Paid subscription, priced by area
- Crops
- All major food and fibre crops



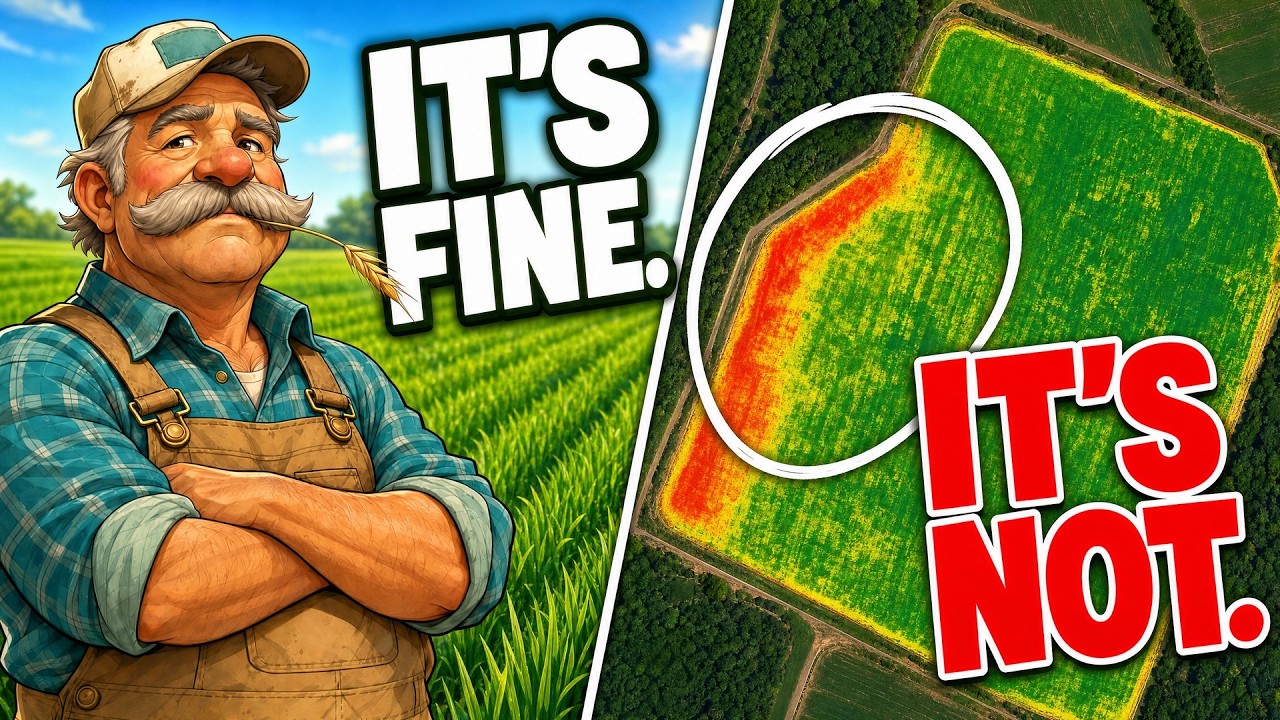
▶ Demo: how Farmonaut Satellite + AI spots the weak corner of a field · 4:32
Plantix: AI Pest and Disease Identification App
Best for diagnosing a sick plant from a photo
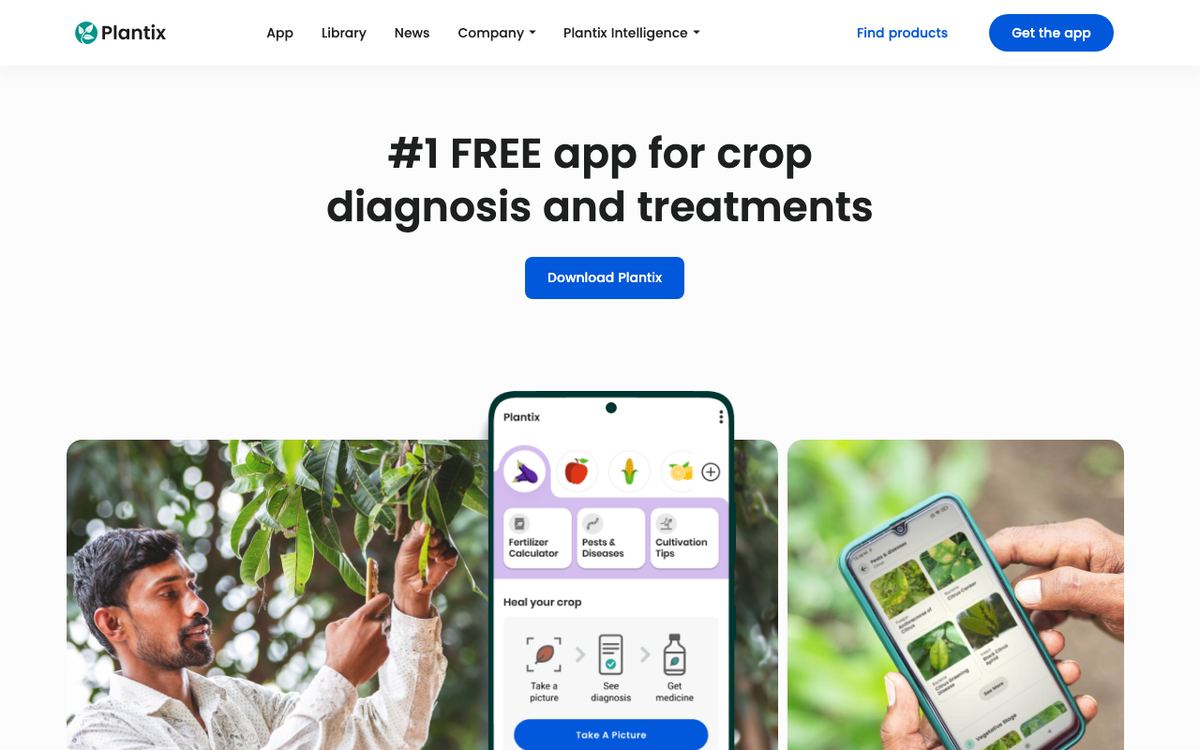
Take a photo of a damaged leaf and Plantix suggests the likely pest, disease or nutrient deficiency, with treatment advice and links to local suppliers. It also has a farmer community where you can ask questions. It is one of the most popular free crop scouting apps for smallholder farmers.
Pros
- Free
- Fast photo diagnosis in the field
- Treatment advice and community help
Cons
- Android only (we found no official iOS app)
- Looks at one plant at a time, not the whole field
- Platforms
- Android
- Price
- Free
- Crops
- Major food and horticultural crops
FarmQA: Field Scouting App for Agronomists
Best for agronomists writing scouting reports
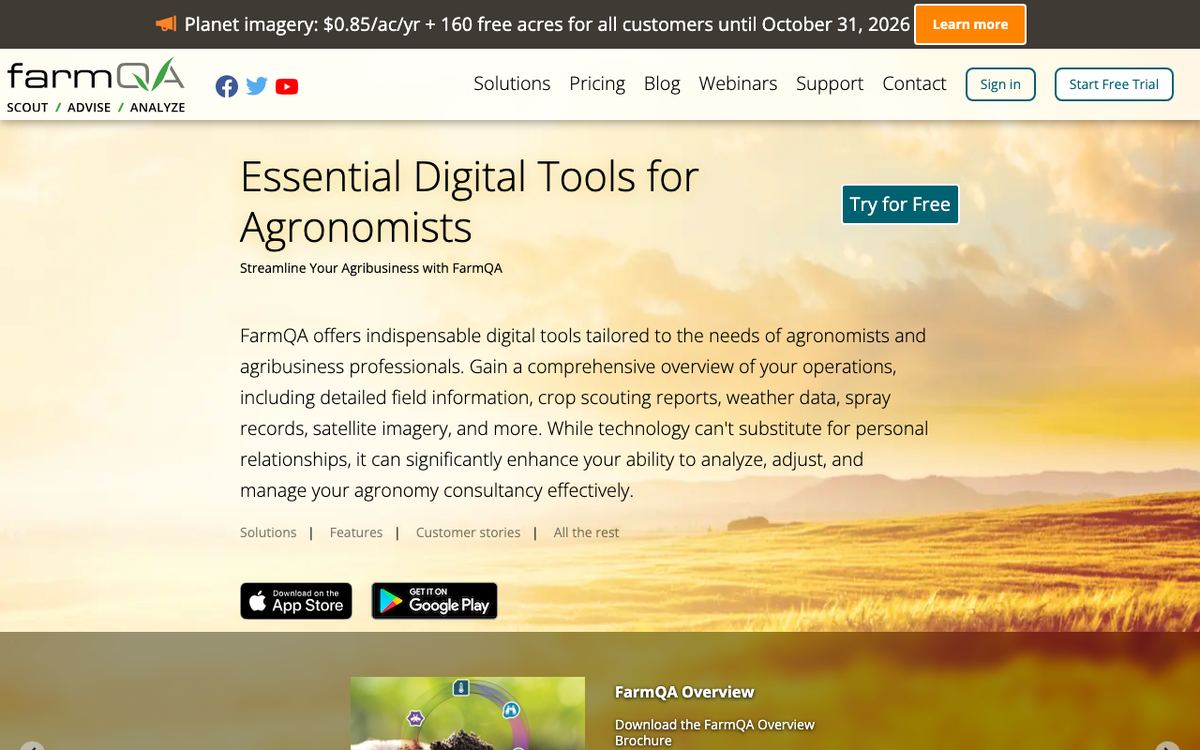
FarmQA (called FarmQA Scouting until 2023) is a field scouting app and web platform for agronomists. It offers custom scouting forms, geotagged photos, treatment recommendations, spray records, satellite imagery and soil-sample tracking, and turns them into reports that advisors can share with growers.
Pros
- Custom scouting forms and reports
- Recommendations and records in one place
- Mobile and web
Cons
- Paid after the free trial
- Built for advisors more than single farms
- Platforms
- Android, iOS, web
- Price
- Paid, with a free trial
- Crops
- Major field and specialty crops
OneSoil: Free Satellite NDVI Monitoring App
Best for free satellite checks on a few fields
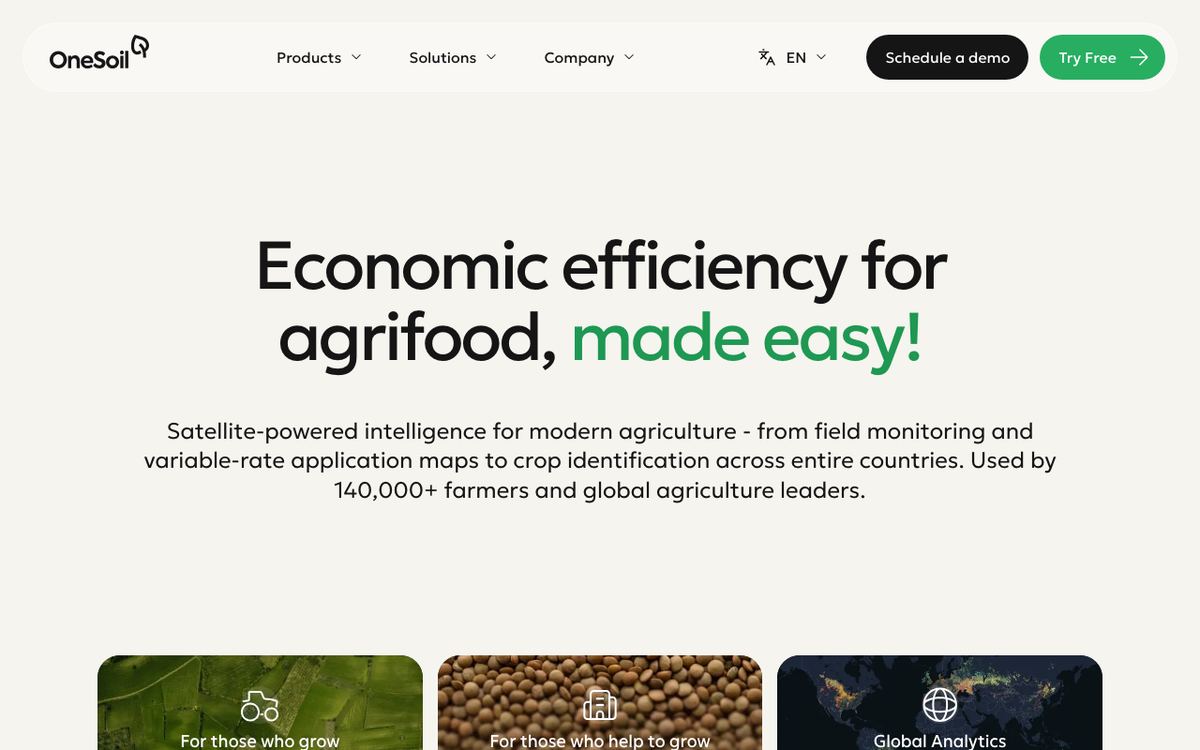
The free OneSoil Scouting app lets you add fields, see the latest satellite image, keep field notes and check field weather, which makes it a simple way to try remote crop monitoring. A subscription adds season-long image history, short-term rain forecasts and spraying windows. The web version, OneSoil Pro, adds productivity zones, variable-rate maps, soil sampling and yield analysis.
Pros
- Free mobile app
- Satellite images and field notes together
- Variable-rate maps in Pro
Cons
- Image history and forecasts need a paid plan
- Less suited to diagnosing a specific pest
- Platforms
- Android, iOS, web
- Price
- Free app; paid plans and OneSoil Pro
- Crops
- Cereals, soybeans, maize, oilseeds and more
TELUS Agronomy (formerly Agrian): Scouting and Compliance Software
Best for ag retailers needing label-checked recommendations
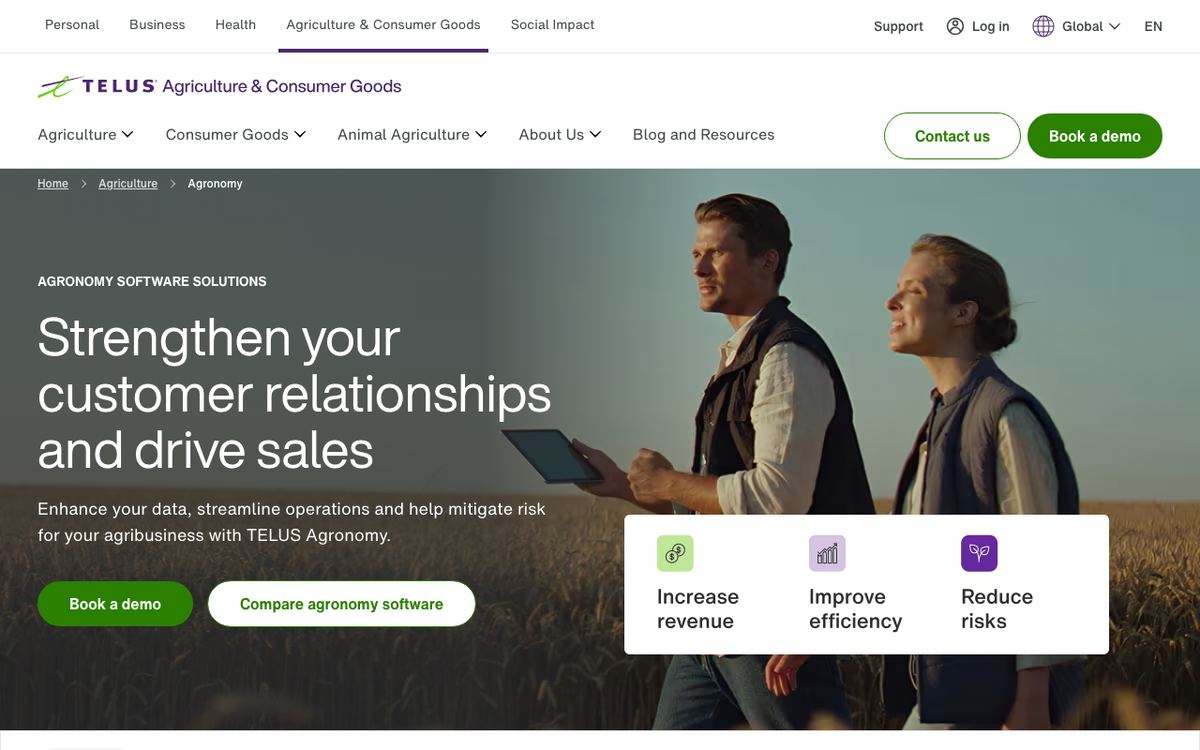
Agrian is now TELUS Agronomy. Its mobile app logs insects, disease, weeds and damage with photos, severity and GPS pins on a field map, and checks each product recommendation against the manufacturer’s label. Records made without signal are queued and sent automatically when you’re back online.
Pros
- Label compliance checks on recommendations
- GPS-pinned scouting records
- Offline records sync later
Cons
- Aimed at agribusinesses, not single farmers
- Pricing only through a demo
- Platforms
- Web, iOS
- Price
- Paid; book a demo for pricing
- Crops
- Grains, vegetables, orchards and more
Atfarm by Yara: Satellite Nitrogen and Variable-Rate App
Best for nitrogen planning and variable-rate fertiliser
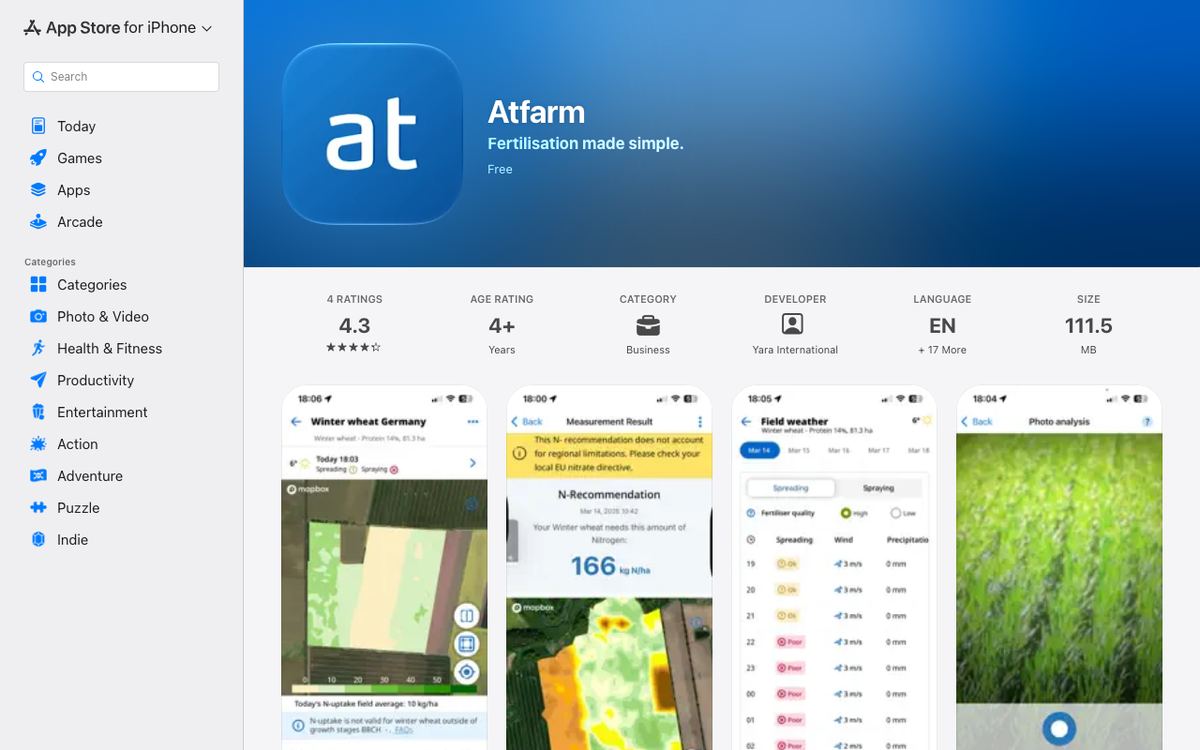
Atfarm uses satellite images to show crop variation and estimate how much nitrogen the crop has taken up. It then builds variable-rate nitrogen maps, even if you don’t have a variable-rate spreader, and works with Yara’s N-Tester BT for in-field readings.
Earlier versions of this list included Yara CheckIT. We couldn’t find it in the app stores in October 2026, so we replaced it with Yara’s current app, Atfarm.
Pros
- Free to download
- Nitrogen uptake maps from satellite
- Variable-rate maps without special equipment
Cons
- Focused on nitrogen, not pests or disease
- Only available in selected countries
- Platforms
- Android, iOS, web
- Price
- Free to download
- Crops
- Mainly cereals and other arable crops
Taranis: Drone-Based Crop Intelligence and Scouting
Best for large row-crop farms working with an advisor
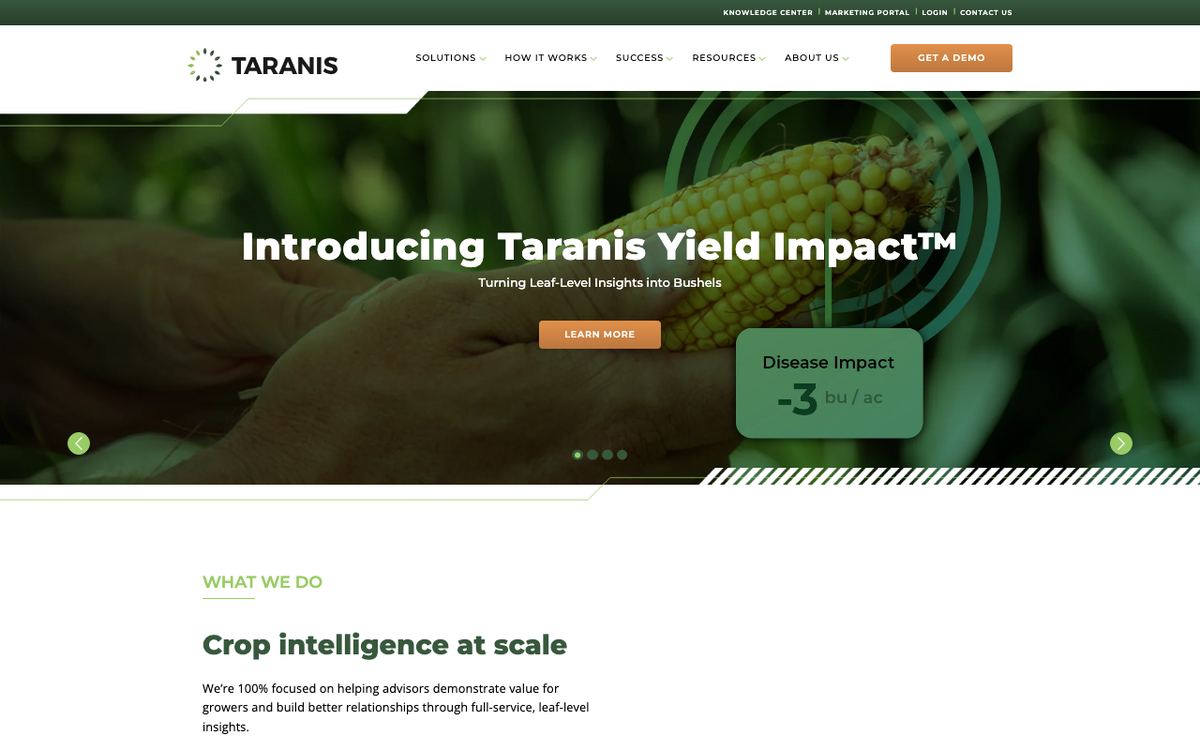
Taranis uses drones to capture leaf-level images, then uses AI to spot weeds, insects, disease and nutrient problems and estimate their effect on yield. Growers usually get it through their ag retailer or crop advisor, who uses the reports to plan treatments.
Pros
- Very detailed, leaf-level images
- Estimates yield impact of each problem
- Advisor support included
Cons
- Sold through retailers, not directly to every farm
- Most useful on large operations
- Platforms
- Web, iOS
- Price
- Paid, through ag retailers and advisors
- Crops
- Corn, soybeans, cotton and specialty crops
How We Chose These Crop Monitoring Apps
We picked apps that are widely used for crop scouting or crop monitoring and are still available today. For each one we checked the company’s own website and its app store listing in October 2026, and compared the same points: what it is best at, how it sees the crop, platforms, price model, pros and cons. Where an app had been renamed or discontinued, we updated or replaced it.
How to Choose the Best Crop Monitoring App for Your Farm
The best app for crop monitoring is the one that answers your most common question. Use this checklist before you sign up:
- What problem do you need to solve? To see which parts of a field are struggling, pick a satellite crop monitoring app. To name a pest or disease on a plant, pick a photo diagnosis app.
- How many fields and hectares? A few fields can start on a free plan. Many fields or estates need a platform that handles bulk mapping and team access.
- Who will use it? Farmers want simple maps and alerts. Agronomists and retailers need reports, recommendations and records for many growers.
- Does it work where you farm? Check crop support, language and country availability, and whether the app works with weak mobile signal.
- What does it cost per hectare? Compare the real yearly cost for your area, not just the starting price.
- Can it connect to your other tools? An API or export lets you move data into farm management software without typing it twice.
- Who owns your data? Read the privacy policy and check you can export your field records.
▶ Precision agriculture for beginners: 6 steps, no robot needed · 4:18
Why Crop Scouting Apps Matter
Crop scouting means checking fields regularly for crop health, pests, disease and nutrient problems. It is the backbone of good field management and sustainable farming. Done by hand, it is slow, and notes on paper get lost or misread.
University extension services set out the basics. Iowa State University Extension suggests starting with an overview of the field, then walking a Z, W or diamond pattern, changing the route each visit, and checking 5 to 15 plants at each stop, or at least 50 to 100 plants per field. South Dakota State University Extension recommends scouting weekly in the growing season, and daily when a pest nears its economic threshold or the weather favours a fast outbreak. On a large farm that is a lot of walking, which is where apps help.
Crop scouting apps and digital monitoring platforms make this faster and more consistent. Satellite and drone images show which parts of a field look different. Photo-based AI helps name the problem. Geotagged notes let the whole team see what was found and where.
Precision farming tools are now common on larger farms. USDA survey data for 2023 shows how use climbs with farm size, which is why simple, low-cost satellite apps matter most for small and midsize farms.
Chart
How many US farms use precision farming tools (2023)
Share of farms using each tool, by farm size
From manual field walks to remote crop monitoring
For decades, scouting meant walking set routes through a field and judging plant health by eye. That still matters, but it is limited by time, field size and how consistent each scout is. Remote crop monitoring changed this. Satellite imagery for farming now covers large areas without a visit to each plot, and mobile apps and sensors keep the data in one place.
- Remote sensing in agriculture: satellites and drones show crop vigour, water stress and problem patches across large areas.
- Machine learning and AI: apps can recognise many diseases and nutrient deficiencies from a photo.
- Geotagging and mapping: every issue is pinned to a location and can be shared with the team.
▶ Explainer: crop health monitoring from space, and why walking every acre does not scale · 4:09
How Satellite Crop Monitoring Works (NDVI Explained)
Infographic
From satellite image to field action, in five steps
- 1Satellite passesA satellite photographs your field in visible and near-infrared light.
- 2NDVI is calculatedEvery pixel gets a crop health score from −1 to +1.
- 3Colour mapLow scores show up as yellow or orange zones on the field map.
- 4Scout those zonesYou walk the weak zones first and find the cause.
- 5Act and trackTreat only where needed, then watch the next map for recovery.
Most satellite crop monitoring apps are built on a vegetation index called NDVI (Normalized Difference Vegetation Index). Healthy plants reflect a lot of near-infrared light and absorb red light. NDVI compares the two:
NDVI = (NIR − Red) ÷ (NIR + Red)
The result runs from −1 to +1. The higher the value, the denser and healthier the green vegetation. Bare soil, water and stressed or thin crops score lower. An app turns these values into a colour map, so a patch that is yellow or orange while the rest of the field is green is the first place to scout. Our guide to NDVI ranges, from farmland to vegetation health explains how to read the values in more detail.
How often will you get a new crop health map?
How often you get a new map depends on the satellites your app uses. There is a trade-off: satellites that see finer detail usually pass over the same field less often. The two European Sentinel-2 satellites photograph the same place about every 5 days at 10 m detail. NASA and USGS’s Landsat 8 and 9 together pass every 8 days at 30 m. MODIS sees every field almost daily, but each pixel is 250 m across, too coarse for most single fields.
Chart
Detail versus frequency: the free satellites behind crop monitoring apps
Lower and further left is better. Filled dots are the constellations most apps use today.
Clouds are the other half of the story. A satellite cannot see through cloud, so in a cloudy season many passes give no usable image, and the wait between clear images grows quickly as cloud cover rises.
Chart
Cloud cover stretches the wait between clear images
Average days between cloud-free images, by cloud cover in your season
Calculator
How many clear satellite images will you get?
Use 5 days for Sentinel-2 or 8 days for Landsat 8 + 9, and your own season’s cloud cover.
- Satellite passes in your season: 24
- Lost to cloud: 12 (50%)
- Average wait between clear images: 10 days
This models the arithmetic, not your local weather. Ask your provider how many cloud-free images they delivered for your area last season.
Benefits of Digital Crop Monitoring Apps
Why are so many farmers and agronomists switching to digital crop monitoring apps? These are the main benefits:
- Less time in the field: you go straight to the patches that need attention instead of walking every row.
- Better decisions: irrigation, fertiliser and spraying are based on data, not guesswork.
- Higher yields: problems are caught earlier, while they can still be fixed.
- Lower input use: treating only the areas that need it saves chemicals, fertiliser and water.
- Easier teamwork: findings and actions are shared instantly, from anywhere.
- Better records: every observation is dated and mapped, which helps with planning, audits, loans and insurance.
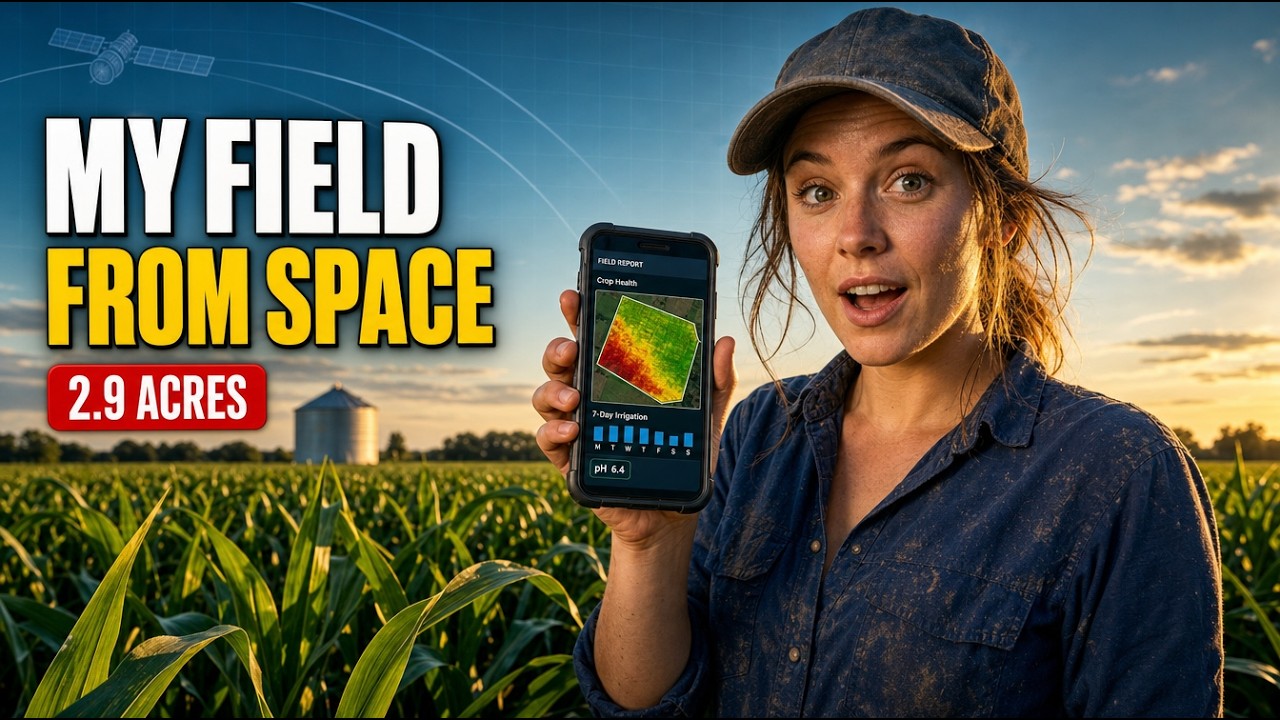
▶ Walkthrough: how a satellite farm advisory caught a yield drop · 9:13
How to Start Crop Scouting with an App: Step by Step
- Map your fields. Draw each field boundary in the app, or upload a boundary file.
- Check the latest crop health map. Look for patches with lower NDVI than the rest of the field.
- Plan your route. Mark the weak patches and walk those first, plus a few normal areas to compare.
- Inspect and photograph. Look at leaves, stems and roots. Use a photo diagnosis app if you are unsure what you see.
- Record what you found. Save a geotagged note with the problem, how severe it is and what you will do.
- Act and follow up. Treat only where needed, then compare the next satellite map to see if the patch recovers.
- Share the report. Send it to your team, agronomist or buyer so everyone works from the same information.
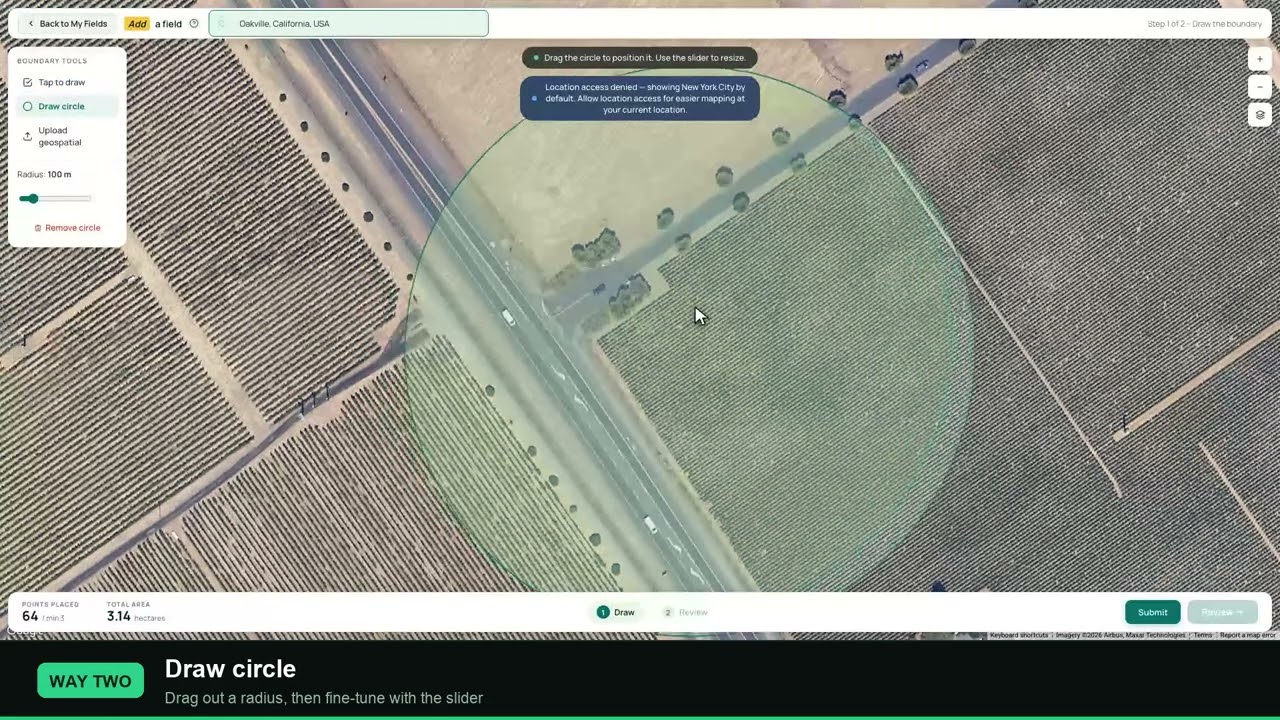
▶ Tutorial: add a field in Farmonaut, all 3 ways · 3:50
Want to see what this could mean for your own fields? Try the numbers below.
Calculator
How much scouting time could a satellite map save you?
Enter your own numbers. The tool compares walking every stop with walking only the zones a crop health map flags.
- Walking every stop: 37.3 hours (20 stops a round)
- Walking only flagged zones plus check stops: 14.9 hours (8 stops a round)
- Over 8 rounds on 100 ha
Example values only, not a benchmark. A satellite map shows where to look, not what is wrong, so keep a few check stops in healthy areas. Travel between fields is not included.
Key Features Every Crop Scouting App Should Offer
When we evaluate field scouting apps, these are the features that make a real difference to day-to-day farm management:
- Real-time crop health monitoring: up-to-date views from satellites, drones or sensors, so you can spot problem areas.
- Pest and disease identification: diagnosis from photos, for early action against insects, fungi or viruses. The stakes are high: the UN Food and Agriculture Organization estimates that up to 40% of global crop production is lost to plant pests and diseases each year.
- Custom forms and reports: geotagged photos and notes you can turn into shareable reports.
- Offline use: data is saved in fields with no signal and synced later.
- Integration with farm management software: an API or export so you don’t type data twice.
- Alerts: a notice when a field’s health drops or the weather turns risky.
▶ Can AI really spot crop pests? Phone apps, traps, drones and satellites compared · 6:32
Challenges and Considerations When Adopting Crop Scouting Apps
Every change has a learning curve. Plan for these before you roll out a crop scouting app:
- Digital skills: not everyone on the team will be comfortable with apps or dashboards at first. A little training goes a long way.
- Data privacy and security: farm data is valuable. Choose apps with clear privacy policies and strong security.
- Poor internet: in remote areas, offline support matters.
- Too many separate tools: pick apps that connect to each other, such as through Farmonaut’s developer API.
- Cost versus value: free apps are a good start; paid plans make sense when deeper analysis saves more than they cost.
Future Outlook: Where Crop Monitoring Apps Are Heading
- Smarter AI advice: advisory systems such as Farmonaut’s JEEVN AI will become more personal, using field history, satellite data and local observations.
- Wider access: as mobile internet spreads, more farmers will get real-time crop health monitoring, wherever they farm.
- Connected farms: apps, sensors, machinery and supply-chain tools will share data, from soil to store.
- Traceability and carbon reporting: as buyers and rules ask for proof, traceability and emissions records will become standard.
Frequently Asked Questions About Crop Monitoring Apps
What is the best app for crop monitoring?
It depends on the job. For monitoring many fields by satellite, Farmonaut, OneSoil and Atfarm are strong choices. For diagnosing a plant from a photo, Plantix is the most popular free option. For agronomists, FarmQA, TELUS Agronomy and Taranis are built for reports and recommendations.
What is a crop scouting app?
It is a mobile or web app that helps you check crop growth, find pest and disease damage, and record what you saw with a location. It replaces paper notes with shareable, mapped data.
Is there a free crop monitoring app?
Yes. Plantix is free, and OneSoil and Atfarm are free to download, with paid features for more history or analysis. Paid apps usually add more frequent maps, advice and team features.
How does remote sensing help farmers?
Satellite or drone images show crop health and differences across a whole field. That tells you where to look first, saves time and helps you act before a problem spreads.
What is the NDVI formula?
NDVI = (NIR − Red) ÷ (NIR + Red), where NIR is near-infrared light and Red is red light reflected by the crop. Values run from −1 to +1; higher values mean denser, healthier vegetation. See our step-by-step guide to the NDVI formula and calculation.
Can crop scouting apps help with precision agriculture?
Yes. By showing exactly which parts of a field need water, fertiliser or treatment, they let you apply inputs only where needed, which is the core of precision agriculture.
How do I start with satellite crop monitoring?
With an app like Farmonaut, you sign up, draw your field boundary on the map, and the app starts sending satellite crop health maps and advice for that field.
What if my fields have poor internet?
Choose an app that saves records offline and sends them when you’re back online. TELUS Agronomy, for example, does this. Check each app’s offline support before you buy.
How much do crop scouting apps cost?
Plantix is free, and OneSoil and Atfarm are free to download. Farmonaut, FarmQA, TELUS Agronomy and Taranis are paid, usually priced by area or by user. See the comparison table.
Can I add satellite data to my own system?
Yes. Farmonaut offers a satellite API with developer docs for adding satellite and weather data to your own dashboards or software.
Which app is best for large farms and agribusinesses?
For monitoring many fields, a satellite platform such as Farmonaut, with its Agro-Admin app, scales well. Advisors serving many growers may prefer FarmQA, TELUS Agronomy or Taranis.
How do these apps improve sustainability?
They help you use less fertiliser, water and chemicals by treating only the areas that need it. Tools like Farmonaut’s carbon footprinting and blockchain traceability also make the farm’s impact easier to measure and prove.
The Bottom Line
Pick the crop scouting app that matches your job. For a quick diagnosis of one plant, use Plantix. For watching many fields from space, use a satellite crop monitoring app such as Farmonaut, OneSoil or Atfarm. For writing reports and recommendations for growers, use FarmQA, TELUS Agronomy or Taranis. Whatever you choose, use the app to decide where to walk, not to replace the walk.
Farmonaut crop monitoring
See your own fields from space
Draw your field once. Farmonaut sends satellite crop health maps and advice for it on web, Android or iOS.
Keep reading

Sources
- Plantix, official website: plantix.net
- FarmQA, “FarmQA Scouting to Mobile” (app rename, 2023): farmqa.com
- OneSoil Scouting, App Store listing: apps.apple.com
- TELUS Agriculture, “Agrian is now TELUS Agronomy”: telusagcg.com
- TELUS Agriculture, “Mobile agronomy”: telus.com
- Atfarm by Yara, App Store listing: apps.apple.com
- Taranis, official website: taranis.com
- USGS, “Landsat Normalized Difference Vegetation Index”: usgs.gov
- Copernicus, “Sentinel-2 images the globe every 5 days”: copernicus.eu
- Farmonaut satellite platform: sat.farmonaut.com
- FAO, “Climate change fans spread of pests and threatens plants and crops” (2021): fao.org
- Iowa State University Extension, “Crop Scouting Basics”: iastate.edu
- South Dakota State University Extension, “Field Crop Scouting Basics for Soybean”: sdstate.edu
- USDA Economic Research Service, “Precision agriculture use increases with farm size and varies widely by technology” (Dec 2024): ers.usda.gov
- USGS, “Landsat 9 data release” (8-day combined revisit with Landsat 8): usgs.gov
- NASA, “MODIS: About” (Terra and Aqua, 250 m bands, 1–2 day coverage): nasa.gov
Discussion
Questions, corrections or field experience? Share them below. First-time comments are reviewed before they appear, and your email is never published.
No comments yet. Be the first to add a question or your experience.

 Exurbia Geospatial
 MWS Research Centre
 FieldZero
 Indico Company
 Kubota
 FFBS
FFBS Jontra
 Kalustyan
 Tucor
Tucor Geno
Geno Hayleys Agriculture
 Linx Agritech
 Adinet
 Save Your Soils
