

Crop health · AI tools guide
AI Plant Disease Detection: Accuracy, Tools and Limits
AI plant disease detection names a likely disease from a leaf photo or flags weak patches from satellite images. Lab models score above 99%, but field accuracy is far lower, so use AI to find problems fast and confirm the cause before you spray.
Key takeaways
- A 2016 deep learning model scored 99.35% on lab leaf photos but about 31% on photos taken in other conditions (Frontiers in Plant Science, 2016).
- In a cassava field trial, the Nuru app scored 65%, against 40 to 58% for extension agents and 18 to 31% for farmers; checking six leaves per plant raised it to 74 to 88% (Frontiers in Plant Science, 2020).
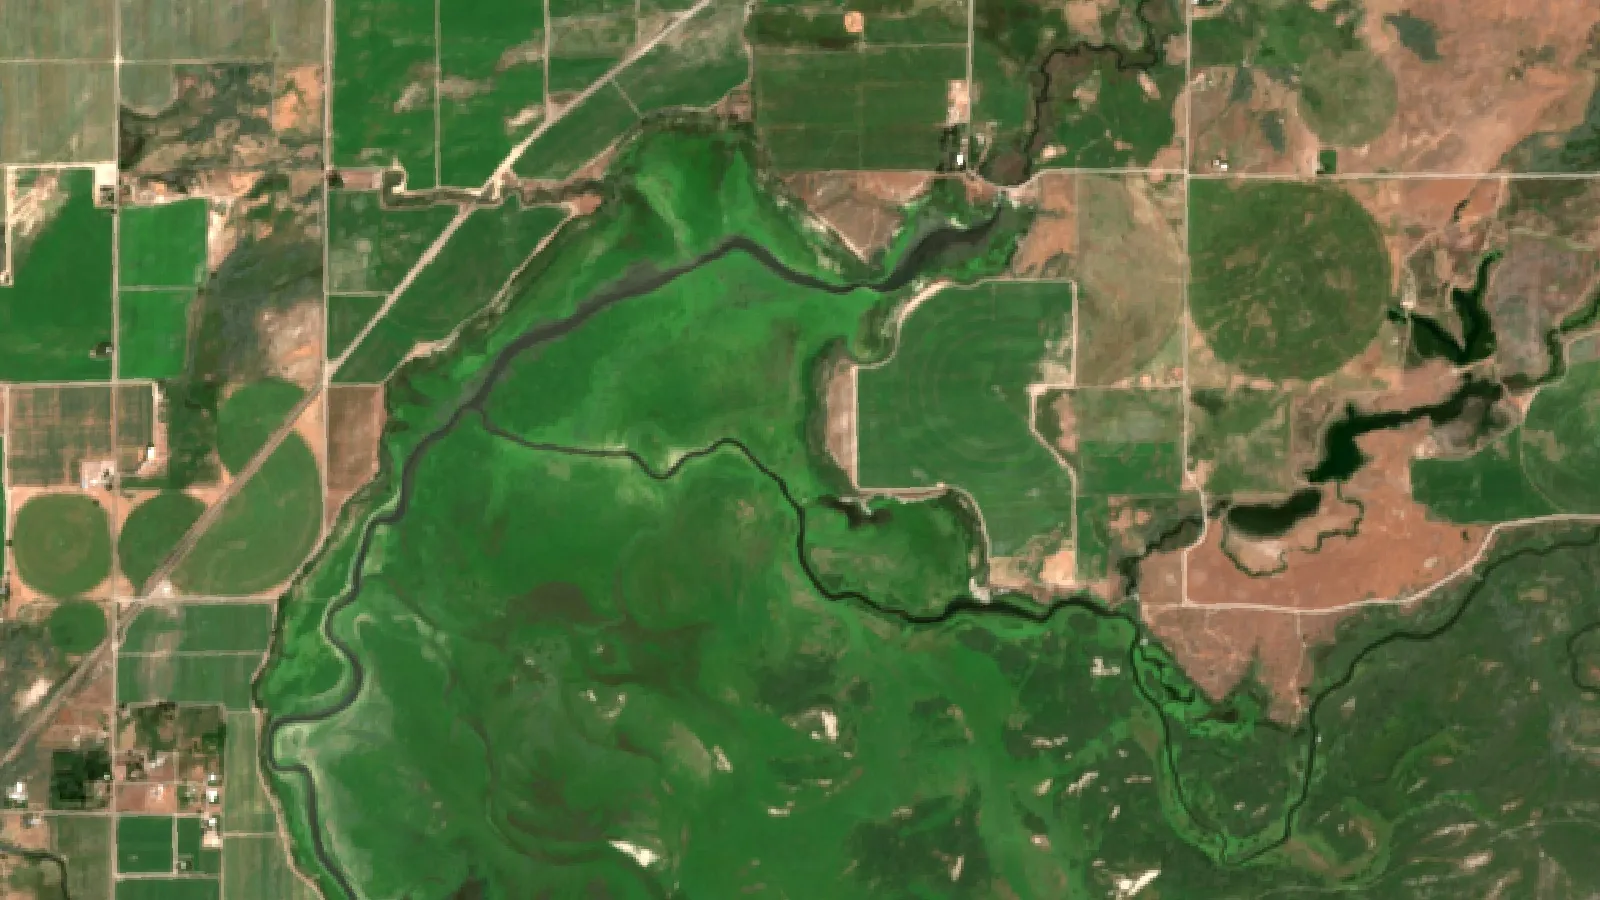
- Satellite maps such as Sentinel-2 (10 m pixels, 5-day revisit at the Equator) show where crops are weaker, not which disease is present.
- A university clinic such as UW-Madison lists a $25 photo review and a $30 base fee per sample (list prices, January 2026).
- Pathogens and pests cut global wheat, maize and soybean yields by about 21 to 23% in an expert survey (Nature Ecology and Evolution, 2019).
In this article
- What AI plant disease detection is
- Why early detection matters
- How AI plant disease detection works, step by step
- How accurate is AI plant disease detection?
- Satellite and drone crop monitoring for disease scouting
- Comparison: scouting, phone apps, satellites and lab tests
- What a lab diagnosis costs
- Practical uses on the farm
- How to choose an AI plant disease detection tool
- How to add AI to your scouting routine
- What is next for AI in crop protection
- FAQ
AI plant disease detection uses a trained computer model to name a likely disease from a photo of a leaf, or to flag stressed patches in a field from satellite or drone images. In lab tests the best models score above 99%, but on photos taken in other conditions accuracy can fall to around 31%, so a phone app is a fast first opinion, not a final diagnosis. This guide explains how the tools work, what the published accuracy numbers really measure, what a lab test costs, and how to fit AI tools into scouting on your farm.
Plant diseases cost growers real money. A global survey of experts put average losses to pathogens and pests at 21.5% for wheat, 22.5% for maize and 21.4% for soybean (Savary et al., Nature Ecology and Evolution, 2019). Finding a problem early gives you more options, and that is where AI can help.
What AI plant disease detection is
There are two main kinds of tools. They answer different questions, and many farms use both.
- Leaf-level tools. You take a photo of a leaf, stem or fruit with a phone. A model trained on labelled photos returns the most likely disease, often with a confidence score.
- Field-level tools. Satellites, drones or fixed cameras record light that plants reflect. Software maps patches where the crop looks weaker than the rest of the field. It tells you where to look, not what the cause is.
A leaf photo can point to a named disease. A satellite map cannot. A low vegetation index can come from disease, drought, waterlogging, nutrient shortage, insects or hail. You still need to walk to the patch and check.
Chart
Global yield lost to pathogens and pests
Average % loss by crop, global expert survey estimates
Why early detection matters
Many diseases spread fast in warm, wet weather. Once symptoms cover a large part of the canopy, a fungicide may only slow the damage. Early detection helps in four ways:
- It limits crop loss, because you can act while the disease is still in a small area.
- It can cut spray use, because you treat the patches that need it rather than the whole field.
- It improves later decisions, such as variety choice and crop rotation, because you have a record of where problems start.
- It protects income, because a smaller loss means more crop to sell.
Long-term loss data show how much a single disease can grow. The Crop Protection Network loss calculator reports that frogeye leaf spot of soybean cost Midwestern states about 460,000 bushels a year in 1996 to 2000, and about 7.6 million bushels a year in 2013 to 2017. For a wider view of why prevention pays, see our page on the importance of crop protection.
How AI plant disease detection works, step by step
Most leaf-photo tools follow the same five steps:
- Image capture. You photograph a leaf, stem or fruit. Good light and a sharp, close image matter more than the phone model.
- Image processing. The app crops and resizes the photo so the model can read it.
- Pattern recognition. A deep learning model, usually a convolutional neural network, compares the image with patterns it learned from thousands of labelled photos.
- Classification. The model returns the most likely crop and disease, often with a confidence score.
- Advice. Some apps add management notes. Check any spray advice against the product label and your local extension service.
The method became well known after a 2016 study trained a model on 54,306 PlantVillage leaf images covering 14 crops and 26 diseases (Mohanty, Hughes and Salathé, Frontiers in Plant Science, 2016). It is still a useful guide to both the promise and the limits.
How accurate is AI plant disease detection?
The honest answer is: it depends on the photos. The 2016 PlantVillage model reached 99.35% accuracy on a held-out test set from the same image collection. Those photos were taken under controlled conditions, one leaf on a plain background. When the authors tested the same model on photos taken in other conditions, accuracy fell to 31.4% on one set and 31.7% on another. That is still far better than a random guess among 38 classes (2.6%), but it is not good enough to act on alone.
Chart
Same model, different photos
Accuracy of the 2016 PlantVillage model, % correct among 38 classes
Field trials give a more realistic picture. A study of the PlantVillage Nuru app on cassava found that the app identified disease symptoms with 65% accuracy, compared with 40 to 58% for extension agents and 18 to 31% for farmers. When users checked six leaves per plant, the app’s accuracy rose to 74 to 88% (Mrisho et al., Frontiers in Plant Science, 2020). The same study found experts were 95% accurate for one cassava disease and 81% for another, mainly because some infected plants showed few or no symptoms.
Three lessons follow from these studies:
- Lab scores overstate field results. Ask how a tool was tested, not just its headline accuracy.
- More photos help. Scanning several leaves per plant, and several plants per patch, raised accuracy in the cassava trial.
- Hidden infections are missed. A phone photo cannot show a disease that has not yet caused visible symptoms on the leaf it photographs.
Chart
Who diagnosed cassava symptoms best
Accuracy range, % correct, field study
Satellite and drone crop monitoring for disease scouting
Field-level tools work at a different scale. The European Sentinel-2 satellites carry a sensor with 13 spectral bands, four of them at 10 m resolution, and revisit every 5 days at the Equator with both satellites in orbit (ESA SentiWiki). Their images are open to anyone through the Copernicus programme. Many crop monitoring services build vegetation index maps, such as NDVI, from this data.
At 10 m, one pixel covers 100 square metres. A satellite map will not show a single sick plant. It can show a patch that is greening up more slowly than the rest of the field, or one that is fading earlier. Clouds can block images for days, so expect gaps in wet weather. Drones give much finer detail but need a pilot, flight time and processing.
Satellite services such as Farmonaut map crop vigor across whole fields so you can decide where to scout first. Use the map to plan your walk, then use your eyes, a phone app or a lab sample to find the cause.
▶ How satellite NDVI maps show crop stress across a large farm before you walk it. · 4:09
Comparison: scouting, phone apps, satellites and lab tests
| Method | What it tells you | Scale | Main limit |
|---|---|---|---|
| Walking the field | Symptoms, pests, plant stage | Plants you reach | Time, and skill varies |
| Phone AI app | Likely disease name and confidence | One leaf per photo | Field accuracy below lab scores |
| Satellite maps | Where the crop is weaker | Whole fields | No cause; clouds; 10 m pixels |
| Drone images | Fine detail on weak patches | Field by field | Pilot time and processing |
| Diagnostic lab | Confirmed pathogen | One sample | Days to get a result; fees |
What a lab diagnosis costs
When an app and your own eyes disagree, a university plant disease clinic can confirm the cause. As one example, the University of Wisconsin Plant Disease Diagnostics Clinic lists a $25 digital photo analysis fee and a $30 base fee per physical sample (list prices, update dated 1 January 2026). DNA-based PCR tests there cost $40 for the first test and $20 for each additional one. Fees at other clinics differ, so check your own state or provincial service.
Extension fact sheets are also a good check on what an app tells you. Penn State Extension, for example, has a guide to identifying and controlling plant diseases, and Clemson’s Home and Garden Information Center lists common tomato diseases and disorders, including problems that look like disease but are not.
Practical uses on the farm
1. Targeted spraying
Best for: growers who already scout by zone. If a map and a field check show that a disease is confined to a few patches, you may be able to treat those patches rather than the whole field. Always follow the product label and local rules, and ask an agronomist when you are unsure.
2. Planning scouting routes
Best for: large or scattered fields. A weekly vigor map shows which fields and which corners changed most since the last image, so you can walk those first.
3. Yield planning
Best for: farms that track yield by field. Season-long vigor records help explain why one area yielded less. They are a planning aid, not a yield forecast you can bank on.
4. Soil and nutrient checks
Best for: patches that come back year after year. A weak area that repeats every season often points to soil, drainage or nutrients rather than disease. Our guide to sustainable soil management covers what to test.
5. Pest monitoring
Best for: crops where insects and disease cause similar damage. AI photo tools increasingly cover insects too, but check the pest list before you rely on one.
6. Records for crop insurance
Best for: growers who want dated evidence of crop condition. Dated maps and photos can support your own records. Your insurer decides what evidence it accepts, so ask your agent first.
▶ A plain test of the different AI tools that look for crop pests, and what each can and cannot see. · 6:32
How to choose an AI plant disease detection tool
Use these questions before you pay for any app or service:
- Does it cover your crops and diseases? A model can only recognise what it was trained on.
- How was it tested? Ask for field results, not just a lab score. A 2022 review searched three app stores, found 606 candidate apps and judged only 17 relevant enough to rate (Siddiqua et al., arXiv, 2022).
- Does it work offline? Many fields have weak signal.
- Does it link to local advice? Good tools point you to extension guidance and labels, not just a product to buy.
- Who owns your data? Read the terms before you upload farm maps.
- What does it cost per acre or per field? Compare that with the loss you hope to avoid, using the calculator below.
For a side-by-side list of apps, see our plant diagnosis app guide. For wider farm tech, see our list of precision agriculture tools.
Try the numbers for your own farm below.
Calculator
Does a disease scouting tool pay for itself?
Enter your own field size, yield, price and tool cost.
- Value of yield saved: $500
- Tool cost: $500
- Lab fees: $60
- Loss avoided needed to break even: 1.12 %
Example values only, not a benchmark or forecast; they are set near break-even. Every number is your input. The loss you avoid depends on the disease, the weather and what you do once a problem is found. Lab fee example: UW-Madison Plant Disease Diagnostics Clinic lists a $30 base fee per physical sample (list price, January 2026); other clinics differ.
How to add AI to your scouting routine
- Start with one field. Pick a field with a disease history and compare AI results with your own notes for a season.
- Train your team. Show everyone how to take sharp, close photos of several leaves per plant.
- Use maps to plan, eyes to confirm. Walk the weak patches the map shows, then photograph what you find.
- Confirm before you spray. If the app is unsure, or the call is costly, send a sample to a diagnostic lab.
- Keep records. Save dates, photos, map snapshots and lab results. They help next season.
Resistant varieties remain one of the best defences. Cornell, for example, has bred New York adapted tomatoes with resistance to several fungal and bacterial diseases. AI tools work best alongside good varieties, rotation and hygiene, not instead of them.
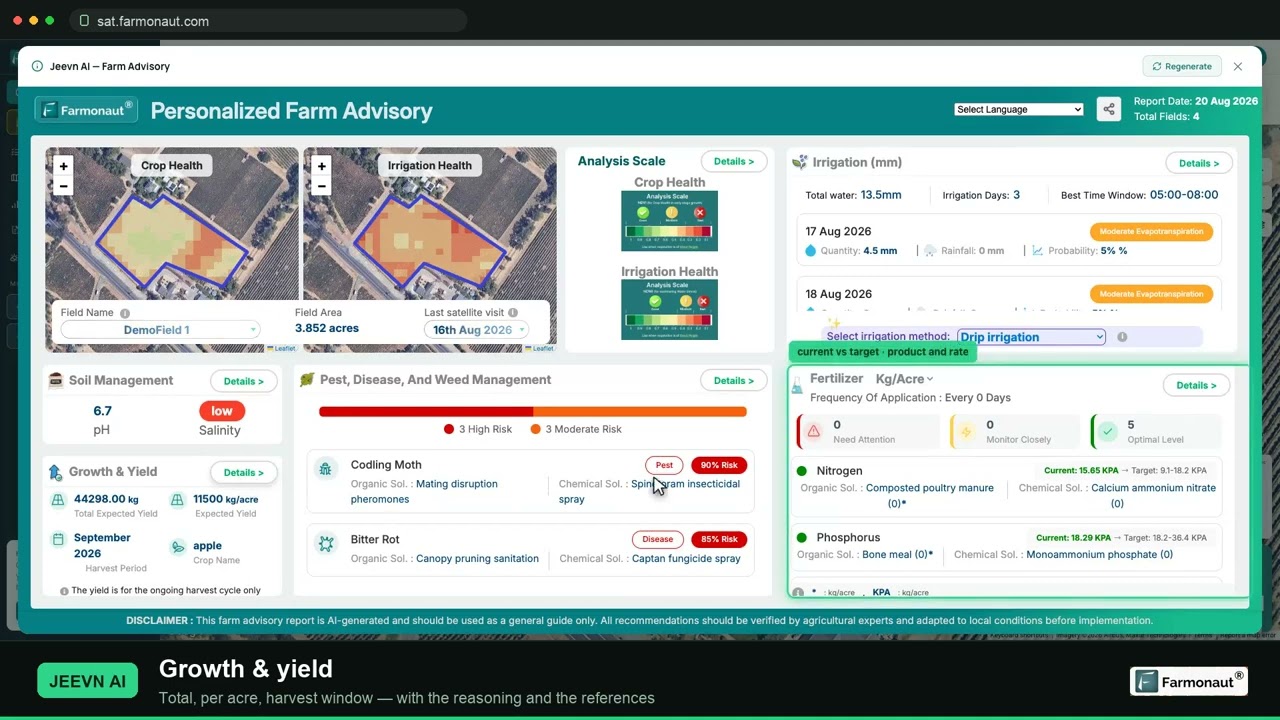
▶ A walkthrough of reading NDVI maps and pulling a field report for your own field. · 19:36
What is next for AI in crop protection
Research is moving in a few clear directions. Disease risk models combine weather data with crop stage to warn before an outbreak. Robots and smart sprayers aim to pair detection with spot treatment. Shared surveillance networks pool reports across regions. Each of these is still being tested, so judge any product on its field evidence. Developers can find our data services through the links below.
Related pages on our site: satellite data API · API developer docs · web and mobile apps
FAQ
How accurate is AI plant disease detection?
It depends on the photos and the crop. A 2016 model scored 99.35% on lab images but about 31% on photos taken in other conditions. A field app for cassava scored 65%, and 74 to 88% when users checked six leaves per plant.
Can a satellite detect a specific plant disease?
No. Satellite maps show where crop vigor is lower, at about 10 m per pixel for Sentinel-2. The cause could be disease, water, nutrients or pests, so you still need to check the patch on foot.
Do I need special equipment?
For leaf photos, a phone with a good camera is enough. For field maps, the satellite images come to you through a web or phone app, so you need no equipment on the farm.
When should I send a sample to a lab?
Send one when the app is unsure, when a costly spray decision depends on the answer, or when symptoms do not match any common disease. Some university clinics accept photos first; UW-Madison charges $25 for a digital diagnosis.
Can AI replace an agronomist?
No. In the cassava study, AI beat farmers and extension agents on average, but experts still did better on some diseases. Use AI to speed up your checks and get professional advice for treatment decisions.
Farmonaut crop monitoring
See which parts of your fields to scout first
Farmonaut maps crop vigor from satellite images so you can plan field checks.




Keep reading
Sources
- Mohanty, Hughes and Salathé, Using Deep Learning for Image-Based Plant Disease Detection, Frontiers in Plant Science (2016): frontiersin.org
- Mrisho et al., Accuracy of PlantVillage Nuru in identifying cassava diseases, Frontiers in Plant Science (2020): frontiersin.org
- Savary et al., The global burden of pathogens and pests on major food crops, Nature Ecology and Evolution (2019): nature.com
- University of Wisconsin Plant Disease Diagnostics Clinic, Services and Fees (2026): pddc.wisc.edu
- Crop Protection Network, Field Crop Disease and Insect Loss Calculator: loss.cropprotectionnetwork.org
- ESA SentiWiki, Sentinel-2 mission: sentiwiki.copernicus.eu
- Siddiqua et al., Evaluating Plant Disease Detection Mobile Applications, arXiv (2022): arxiv.org
- Penn State Extension, Plant Disease Identification and Control: agsci.psu.edu
- Clemson HGIC, Tomato Diseases and Disorders: hgic.clemson.edu
- Cornell Vegetables, New York adapted tomatoes with multiple disease resistance: vegetables.cornell.edu
- Copernicus Data Space Ecosystem, Sentinel-2 data: dataspace.copernicus.eu
Discussion
Questions, corrections or field experience? Share them below. First-time comments are reviewed before they appear, and your email is never published.
No comments yet. Be the first to add a question or your experience.

 Croptimum
 Dalmia Bharat Sugar
 DnCubed
 Pistachio ST
 Field Capacity
 Indosistim Teknologi
 Liquify Digital
 CU Foods
 BeyondTech Global
 Rouge VC
 AgroGreen Dynamics
 AgroRisk
 Oath Inc
 Reddane Farming
 Esri North East Africa
 Cresol
 MDCV UK
 Etech Consulting Madagascar
 Vestlandsforsking

 Licence holder · Niger · Gold










