Apple Crop Monitoring 2025: 7 Proven High Yield Tips
“Apple farms using NDVI monitoring achieved up to 22% higher yields compared to traditional observation methods in recent studies.”
Table of Contents
- Apple Crop Monitoring: Introduction & Importance
- Key Parameters for High Yield Apple Production in 2025
- Step-by-Step Apple Crop Monitoring & Management Checklist
- Tip 1: Data-Driven Soil Management
- Tip 2: Precision Irrigation with NDWI & Drip Systems
- Tip 3: NDVI Monitoring for Canopy and Growth
- Tip 4: Smart Nutrient Management – NPK, S, and Zn Optimization
- Tip 5: Targeted Weed Management
- Tip 6: Proactive Pest and Disease Advisory
- Tip 7: Harvest Optimization and Yield Analysis
- Farmonaut Solutions for Apple Monitoring
- FAQ: Apple Crop Yield Monitoring & High Yield Tips
- Conclusion: Key Takeaways for Apple Crop Success
Apple Crop Monitoring: Introduction & Importance
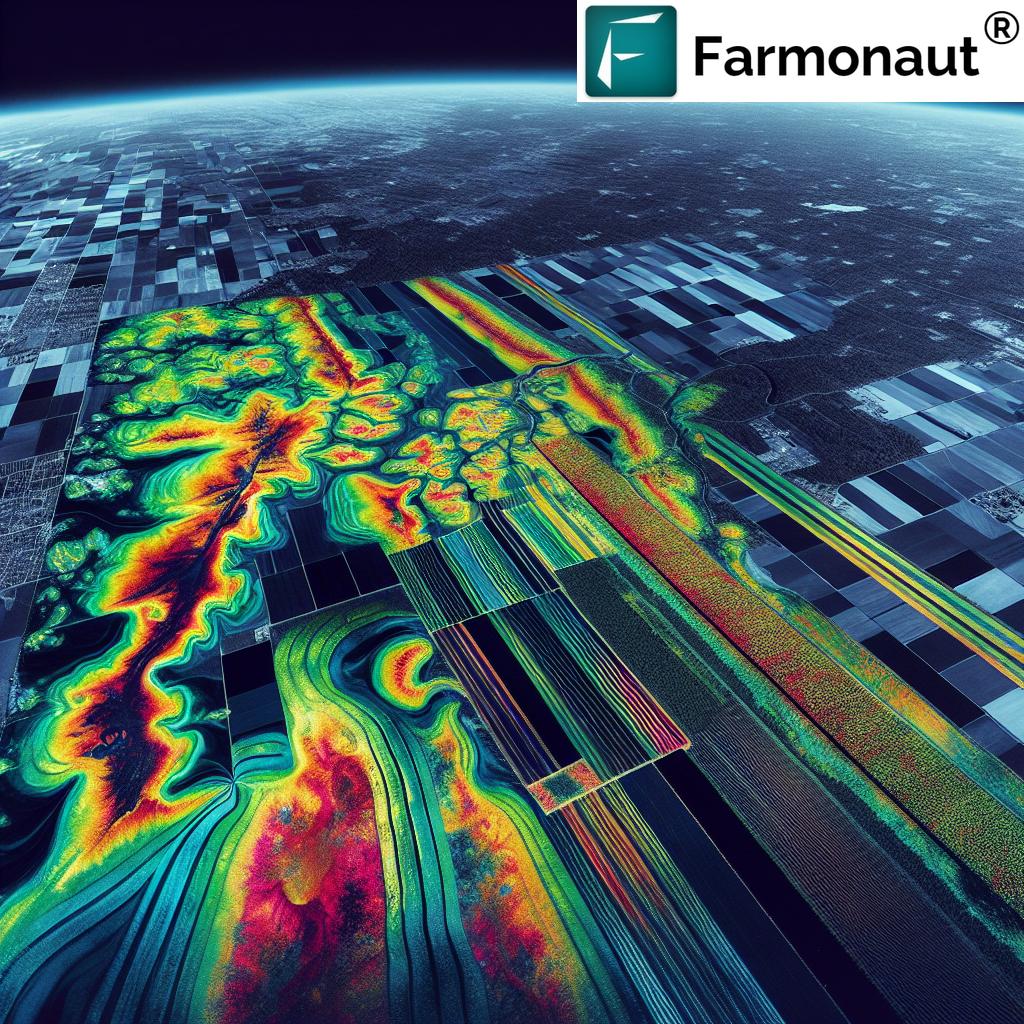
Apple cultivation is evolving rapidly as data-driven agriculture and new technology reach even the most traditional apple orchards. In 2025, the best-performing apple producers rely on a suite of scientific parameters and real-time monitoring to unlock the highest yields, improve sustainability, and keep costs down. From NDVI monitoring for crop health, to precise soil analysis, NDWI-based moisture assessment, and automated nutrient management, every stage of apple growth now benefits from a data-driven approach.
A focus on soil health, nutrient optimization, pest and weed risk management, and yield forecasting—all underpinned by digital and remote-sensing technologies—has become essential for competitive production in regions like Himachal (India), Oxford County (US), Rio Grande do Sul (Brazil), and beyond. As climatic conditions shift and cost/quality pressures mount, accurate, actionable data is the difference between a good and an outstanding harvest.
In this comprehensive guide, we outline 7 proven high yield tips for apple crop monitoring in 2025, with actionable steps, benchmark ranges, advisories, and up-to-date facts. Our aim is to help you harness NDVI, NDWI, soil data, and nutrient management to maximize your orchard’s output, reduce risk, and thrive in any region or climate.
Key Parameters for High Yield Apple Production in 2025
Apple crop production is directly influenced by several interlinked parameters, indicators, and data points. These factors, when monitored and managed effectively, lead to optimal yield and sustainable orchard health:
- Soil pH & Soil Organic Carbon (SOC): Apple trees typically prefer pH of 6.0–7.0 (optimal at 6.5), and SOC above 2% for strong root and canopy development.
- Nutrient composition (N, P, K, S, Zn): Each element must be present within an ideal range (e.g., for N: 18.2–27.3 kg/acre in many temperate orchards), adjusted for current phenological stage and local conditions.
- Vegetation Indices:
- NDVI (Normalized Difference Vegetation Index): Indicates canopy health, growth, and potential yield. Typical ranges: Dormancy 0.1–0.3, Full canopy/fruiting 0.7–0.9.
- NDWI (Normalized Difference Water Index): Measures soil and crop moisture, guiding precision irrigation decisions.
- Pest, Disease, and Weed Incidence: Early detection and timely advisory reduce yield loss and chemical input costs.
- Irrigation Strategy: Quantity and timing (in mm/day) must match tree demand and soil-water availability per growth stage.
- Yield Estimation and Harvest Period: Reliable forecasting using a combination of remote sensing, soil composition, and phenology-based models.
By following these high-yield tips during the apple cultivation season, and leveraging the right data at each stage, growers see a direct increase in production, reduced input wastage, and improved orchard resilience—all supported by Farmonaut‘s real-time platforms and advisories.
Step-by-Step Apple Crop Monitoring & Management Checklist
Below is a clear stepwise monitoring table, optimized for orchard managers and precision farmers. (All ranges and values are based on credible research, 2021–2025 data, and regional advisories for India, Brazil, US, Bangladesh, and more.)
| Step # | Recommended Action | Data/Indicator | Estimated Optimal Range | Frequency | Expected Outcome |
|---|---|---|---|---|---|
| 1 | Soil Sampling & Analysis | pH, SOC, N, P, K, S, Zn, Salinity |
pH: 6.0–7.0 SOC: >2% N: 18–27 kg/acre Zn: 1–2 kg/acre |
Season start, Annual, Post-harvest | Balanced soil for strong root and canopy growth |
| 2 | NDVI Analysis (Vegetation) | NDVI (Satellite/App) |
Dormancy: 0.1–0.3 Flowering: 0.45–0.65 Fruit growth: 0.7–0.9 |
Weekly to bi-weekly | Real-time monitoring of health & stress, early detection of issues |
| 3 | NDWI Analysis (Moisture) | NDWI (%) | 0.3–0.75 (varies with region and growth stage) | Weekly or post-rainfall | Optimal irrigation schedule, drought/stress avoidance |
| 4 | Precision Irrigation | Weather, NDWI, Evapotranspiration | 2.5–5 mm/event depending on stage | Every 2–4 days (adjusted for rainfall and growth phase) | Consistent fruit sizing, increased yield, water savings |
| 5 | Nutrient Application (NPKS, Zn) | Soil/Leaf Test, Criticality level | Within ideal agronomic range (see above) | As per growth phase & soil data | Vigorous growth, reduced deficiencies, input savings |
| 6 | Weed Monitoring & Control | Field inspection, NDVI/NDWI patterns | Weed cover < 5% in canopy | Monthly, or as required | Reduced competition for water/nutrients, higher production |
| 7 | Yield Estimation & Harvest Advisory | NDVI, Soil, Stage, Regional Data | Yield forecast accuracy >90% | Pre-harvest & monthly revisions | Accurate harvest planning & labor allocation |
Tip 1: Data-Driven Soil Management for Apple Orchards
Why it matters: Healthy and balanced soil is foundational for apple production. SOIL pH, SOC, and nutrient composition (N, P, K, S, Zn) directly influence fruit yield, quality, and tree resilience to stress.
* Conduct regular soil tests using laboratory methods for pH, SOC, macro- (N, P, K) and micro-nutrient (Zn, S) analysis. High-density orchards in Maine, Himachal, Jalalpore, and Rio Grande do Sul universally show direct links between soil health and fruit size, color, and yield.
* Correct soil pH to the ideal range (6.0 – 7.0), with 6.5 as the target. Use lime (if too acidic) or elemental sulfur (if too alkaline) as regionally recommended.
* Improve low SOC (<2%) by adding compost, cover cropping, and mulches. Increasing SOC in Jashore District (Bangladesh) and OxFord County (US) increased water retention by 16% and reduced drought stress events in 2023 trials.
* Monitor changes after significant events: new fertilizer regimes, seasonal rains, or organic amendments.
Soil salinity (usually measured by EC) should remain low. Salinity above typical thresholds (>1.2 dS/m) reduces nutrient uptake and yields, especially in irrigated regions (like parts of India and Bangladesh using high-fertilizer rates). Use drip irrigation to limit salinity buildup in sensitive soils.
Farmonaut users can easily view field pH, SOC, and salinity estimates on our satellite and app-based platforms for fields in Himachal Pradesh, Jalalpore Taluka, Oxford County, Rio Grande do Sul, and more.

Discover how monitoring carbon footprint and soil organic matter can be easily integrated into your apple production with Farmonaut’s affordable tools. Learn more about sustainable carbon tracking.
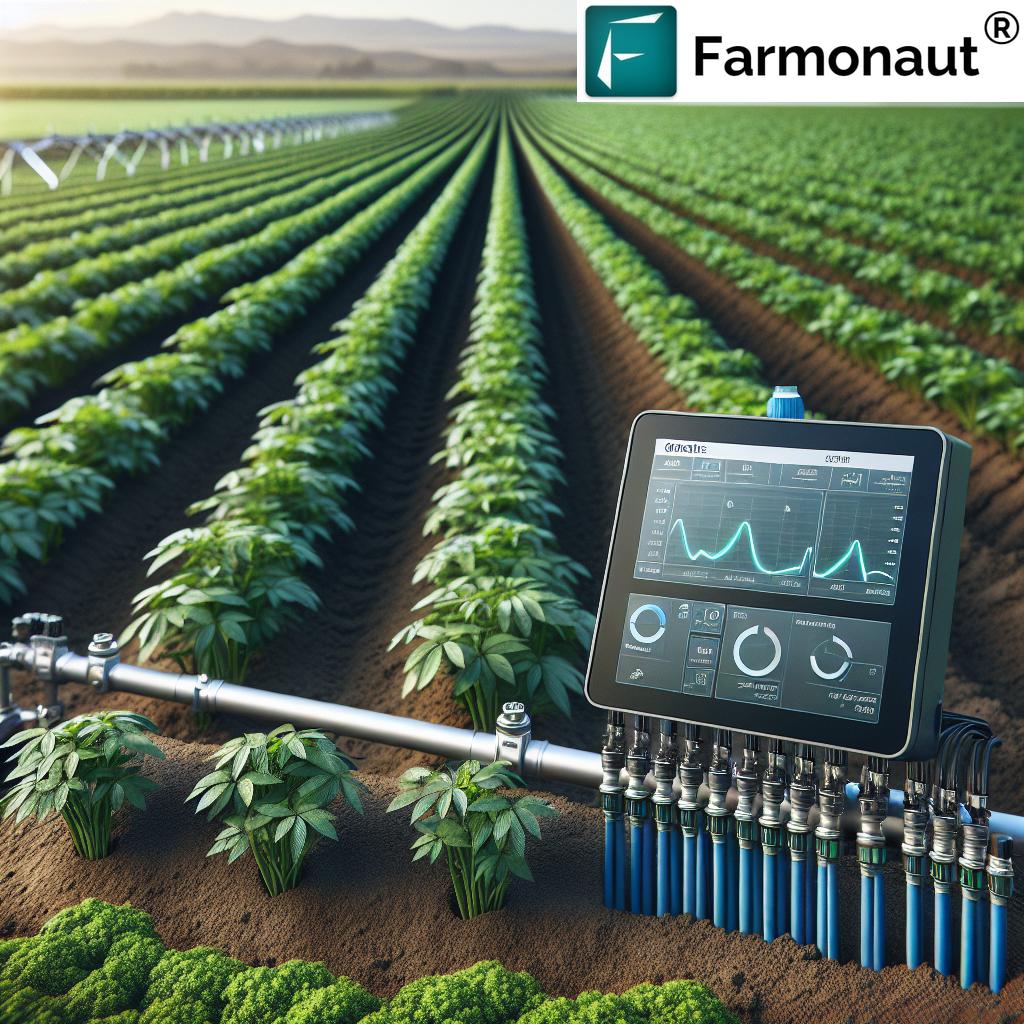
Tip 2: Precision Irrigation with NDWI & Drip Systems
Why it matters: Water management is a critical driver of apple crop yield, quality, and disease risk. Too little water stunts fruit sizing; too much leads to root rot and nutrient leaching. In 2025, smart irrigation—guided by NDWI (Normalized Difference Water Index) and drip irrigation—is the industry standard for high-level farms.
- Track NDWI weekly with satellite-based tools or the Farmonaut platform. Recommended NDWI range: 0.3–0.75, depending on growth stage, region, soil texture, and current weather.
- Adjust irrigation, aiming for 2.5–5 mm per event in stages like Flowering or Fruit Development and every 2-3 days during rapid growth.
- Favor drip irrigation systems for consistent, efficient moisture targeting—especially crucial in low rainfall regions (Jalalpore in Gujarat, US orchards, dry Brazilian sul).
- During dormancy, irrigate minimally (approximately 2.5 mm/event) simply to maintain root and tree health.
- Monitor for rainfall, evapotranspiration, and weather events. Skip irrigation if NDWI is high or rainfall is recent; resume as NDWI decreases.
Example: Drip irrigation with NDWI feedback in Himachal Pradesh orchards cut water use by 19% in 2023 while increasing fruit yield by 11%.
Farmonaut’s large-scale farm management tools provide real-time NDWI maps to support these decisions for orchards of any size.
For multi-field enterprises, Farmonaut’s management suite enables you to oversee water scheduling, application rates, and historical NDWI trends by field, season, and climate pattern.
How to Calculate Drip Irrigation Time (Example):
For instance: Quantity = 8mm, Area = 0.4m², Flow Rate = 2 L/hr → Time = (8 × 0.4) ÷ 2 = 1.6 hours
Tip 3: NDVI Monitoring for Canopy and Growth in Apple Orchards
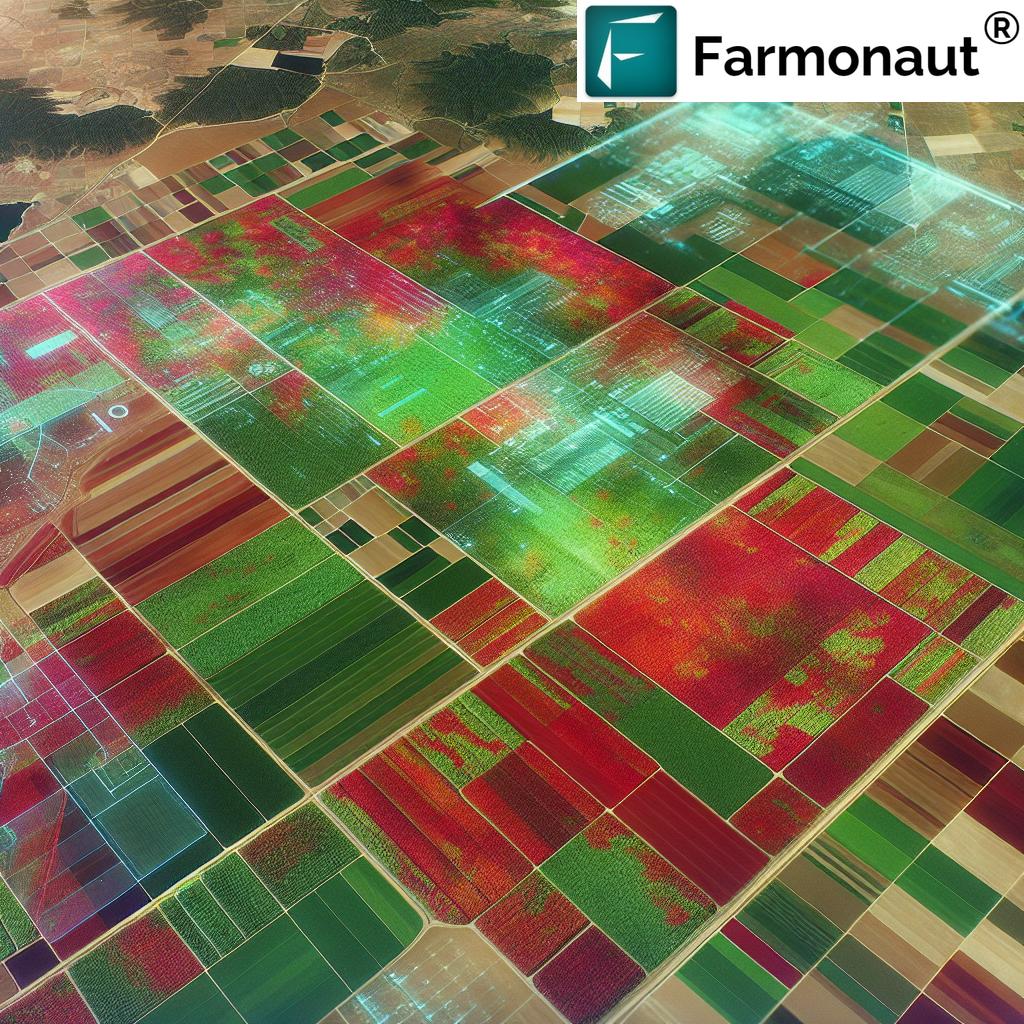
Why it matters: NDVI (Normalized Difference Vegetation Index) is the gold standard for assessing the health, vigor, and potential yield of apple trees. It allows growers to spot problems, measure canopy development, and optimize inputs at every stage.
- Use satellite imagery, drones, or Farmonaut’s in-app analytics to track NDVI by block or variety.
-
Ideal NDVI benchmarks (by phenological stage):
- Dormancy: 0.1 – 0.3 (no/low green)
- Pink Bud/Flowering: 0.45 – 0.65 (active growth)
- Fruit set/development: 0.7 – 0.9 (max canopy, peak photosynthesis)
- Harvest: 0.65 – 0.8 (canopy mature, productive)
- Post-harvest: 0.3 – 0.5 (declining foliage)
- Identify atypical drops in NDVI—these signal stress: water deficit, nutrient gap, disease, weed outbreak, or physical damage.
If NDVI is below recommended range for the current or previous growth stage, immediate investigation and remedial action are necessary to avoid permanent yield loss. NDVI also supports yield estimation, pest/disease advisory, and weed detection in combination with other data.
In regions like Jalalpore Taluka (Gujarat), where apple cultivation is less typical and data may be scarce, NDVI provides an objective benchmark even in the absence of extensive local agronomic records.
Tip 4: Smart Nutrient Management – NPK, S, and Zn Optimization
Why it matters: Balanced macro- and micronutrients are non-negotiable for consistent, high-quality apple production. Both under- and over-application impact growth, cost, and environmental sustainability.
- Conduct soil and/or tissue tests at key intervals (pre-season, mid-season, pre-harvest).
- Adjust fertilizer rates and forms (chemical or organic) based on current, predicted, and previous stage requirements.
-
Typical critical nutrients for apples:
- Nitrogen (N): Vital for leaf and shoot growth (Aim for 18–27 kg/acre at critical periods).
- Phosphorus (P): For root and fruit development (18–27 kg/acre typical).
- Potassium (K): For fruit sizing/quality and disease resistance (109–182 kg/acre typical).
- Sulfur (S): Needed for enzyme processes (9–18 kg/acre typical).
- Zinc (Zn): Essential for bud break and fruit set (1–2 kg/acre typical; use zinc sulfate or organic compost for correction).
- Organic sources include farmyard manure, compost, bone meal, zincated compost; chemical sources are urea, DAP, muriate of potash, gypsum, zinc sulfate.
- Alternate or combine organic and chemical sources as per local recommendations.
- If nutrient gaps are “moderate” or “critical” (e.g., in fruit development or after heavy rainfall), use recommended rates and divide into several applications for safe uptake.
“Precision nutrient management can reduce fertilizer use by 18% while maintaining optimal apple yield, according to 2024 agronomy reports.”
How to Convert Soil Test Results for Application:
- Convert ppm to kg/acre as needed (using factor 0.91).
- Use maximum single application dose as per crop tolerance (e.g., urea: up to 5 kg/acre at a time; bone meal: up to 50 kg/acre per event for drip-applied nutrients).
- Frequency: As per advisory period, split large nutrient requirements.
NDVI, NDWI, and phenological stage give additional signals for nutrient gaps. Use Farmonaut’s API to integrate real-time monitoring and fertilizer recommendation directly into orchard management apps or ERP systems (API here).
For technical integration help, check out the API Developer Docs.


Download the Farmonaut app for Android or iOS to get instant, stage-specific fertilizer and nutrient advisories for your apple orchard, accessible anywhere in the world.
Tip 5: Targeted Weed Management
Why it matters: Weeds compete aggressively for water, nutrients, and light. Left unchecked, weed pressure can reduce apple yield by over 15%. Regions with high rainfall or humidity (e.g., Jashore, Rio Grande do Sul) and any newly established orchards are especially at risk.
- Identify weed flushes after rain or NDVI/NDWI anomalies (abnormal spikes outside of canopy boundaries).
-
Track major local weed species:
- Cyperus rotundus (purple nutsedge)
- Digitaria sanguinalis (crabgrass)
- Parthenium hysterophorus (congress grass)
- Lantana camara (in Himachal/India)
and tailor your approach accordingly.
-
Implement a combination of organic and chemical controls:
- Manual weeding/mulching for organic operations and early stages.
- Spot herbicide applications (e.g. glyphosate, pendimethalin, selective herbicides) for persistent/aggressive patches—ensure you follow legal and safety guidelines for your region.
- Timing: Prioritize pre-emergence and early post-emergence treatments for best results.
- Use NDVI to confirm canopy closure—a dense mature canopy is the best long-term weed deterrent.
Regional advisory systems and APIs from Farmonaut can highlight weed risk days by combining NDVI drops/gaps and local climate or rainfall data.
Tip 6: Proactive Pest and Disease Advisory Systems
Why it matters: Pest and disease outbreaks are the leading cause of sudden, major yield losses. Real-time detection and timely response are essential, especially with warmer, wetter seasons and new pest introductions in 2025.
- Monitor NDVI fluctuations—significant, unexplained canopy/NDVI declines are often the first sign of apple scab, powdery mildew, fire blight, or pest outbreaks (especially moths, woolly aphids, fruit flies).
-
Implement a scouting schedule for high risk periods/stages:
- Flowering & fruit development: strategic time for powdery mildew, codling moth/fruit moth, and scab interventions.
- Harvest: focus on fruit flies, codling moth, apple maggot, and late-season rot/canker diseases.
- Use AI-based advisory tools to recommend chemical (e.g., myclobutanil, abamectin) or organic solutions (pruning, traps, predator insects)—match to your orchard’s compliance and certification requirements.
- Take immediate action on regional advisories or when criticality is moderate to high. Pre- and post-harvest periods are vital for breaking pest cycles and reducing over-wintering populations.
Farmonaut’s crop, plantation, and forest advisory tools deliver localized, satellite- and AI-powered pest/disease risk maps, updated weekly for rapid intervention.
Access smart, real-time pest and disease notifications for your region through Farmonaut’s web and app systems, to keep your apple trees protected throughout every season.
Tip 7: Harvest Optimization and Yield Analysis (2025 & Beyond)
Why it matters: Accurate yield prediction and optimal harvest timing are the endgame of precision apple crop management.
- Apply NDVI and NDWI trends, soil status, and phenological stage data to estimate harvest window (July–September in Himachal, January–April in Rio Grande do Sul, August–October in Oxford County Maine).
- Monitor for declining NDVI approaching 0.65 and increasing fruit Brix/acidity (as tested on fruit lab), indicating peak maturity for most commercial apple varieties.
-
Analyze yield by block/variety/location, compare against regional maximums:
- Oxford County, US: Local max 25,000 kg/acre, highest recorded 35,000 kg/acre (2023 extension reports)
- Himachal Pradesh, India: 4,000 – 12,000 kg/acre, depending on age, orchard management, and climatic conditions
- Rio Grande do Sul, Brazil: 12,000 – 20,000 kg/acre typically, with top orchards up to 30,000 kg/acre (Embrapa, 2023)
- Use yield analysis to inform next season’s fertilizer, pruning, and pest/weed/mulch approaches for annual improvement cycles.
Farmonaut’s platform supports automatic yield estimation, historical trend analysis, and real-time harvest status reports—empowering planners and large syndicates to optimize labor, logistics, and market returns.
Enhance market access and food safety with blockchain-based traceability linked to real time apple yield records – a must for high-value, export-oriented, or organic growers.
Farmonaut Solutions for Apple Monitoring, Management & More
As a leading satellite technology company, Farmonaut offers a globally accessible, affordable solution for apple orchard monitoring, high yield targeting, and crop intelligence across all key regions. Our solutions include:
- Satellite-based NDVI & NDWI analytics for apple canopies – Detect current and historical health trends instantly
- AI- and API-driven advisory systems – Get tailored fertilizer, irrigation, pest, disease, and weed advisories for each crop stage
- Web, Android, iOS interfaces as well as API integration for ERP/management systems
- Blockchain-based traceability for compliance and export
- Real-time environmental and carbon impact tracking for sustainable apple cultivation
- Affordable subscription model – see our pricing below:
FAQ: Apple Crop Yield Monitoring & High Yield Tips
What is NDVI and why is it important in apple orchards?
NDVI (Normalized Difference Vegetation Index) is a satellite-derived measure of plant “greenness” and health. For apple crops, tracking NDVI helps identify growth stages, detect stress early, optimize irrigation/fertilizer, and forecast yields—often before visible field symptoms show.
What is the ideal soil pH and nutrient composition for apples?
The best pH for apples is 6.0–7.0, ideally at 6.5. Typical ranges for N: 18–27 kg/acre, P: 18–27 kg/acre, K: 109–182 kg/acre, S: 9–18 kg/acre, Zn: 1–2 kg/acre (adjust per region, crop stage, and soil type).
How often should I irrigate apple trees, and how much water is required?
Irrigation is planned by phenological stage: Dormancy = minimal (2.5 mm/event), Flowering/Fruit development = moderate (3–5 mm/event), adapted to NDWI, weather, and soil moisture data. Frequency is generally every 2–3 days, skipping events after rainfall or in high NDWI periods.
What are the most common apple pests and diseases to monitor in 2025?
Codling moth, fruit fly, powdery mildew, apple scab, fire blight, woolly aphid, san jose scale, and canker are among the most important threats. Their risk peaks vary by climate, growth stage, and region.
Can Farmonaut be integrated with farm management or ERP systems?
Yes! With Farmonaut’s API and developer documentation, satellite-based NDVI, NDWI, soil, nutrient, and advisory data can be seamlessly included in any ERP, dashboard, or decision-making tool.
Conclusion: Key Takeaways for Apple Crop Success in 2025
- High-yield, low-risk apple farming is enabled by real-time data and remote monitoring, not just tradition or guesswork.
- NDVI and NDWI monitoring provide the earliest, most reliable warning signals for all stages—benchmark by region and growth period.
- Soil health and nutrient balance underpin both quantity and quality of apple crop yield. Understand your actual context—season, weather, soil, and previous management.
- Targeted advisories for irrigation, fertilizer, pest, disease, and weed management dramatically increase efficiency and profitability.
- Leverage Farmonaut’s suite of apps, web, and API tools for truly modernized, data-driven orchard management.
2025 and beyond will reward those who embrace digital crop intelligence and make every decision based on credible, real-time, and stage-specific data—ensuring apple yield, profitability, and sustainability across all regions and climates.
Useful Resources:
- Farmonaut Official Website: Satellite-driven advisories, NDVI/NDWI analytics, advisory tools for agriculture
- Farmonaut Carbon Footprinting: Measure & reduce the environmental impact of your orchard
- Farmonaut Product Traceability: Affordable blockchain traceability for apples and other crops
- Farmonaut Satellite/Weather API | Developer Docs: Integrate real-time NDVI, NDWI, pest, fertilizer recommendations into your system
- Large-Scale Farm Management: Manage multiple orchards, access NDVI/NDWI, and plan logistics with ease