NDVI Satellite Imagery: 7 Powerful Ways to Boost Crop Yields
Understanding NDVI Satellite Imagery: The Cornerstone of Modern Agriculture
The Normalized Difference Vegetation Index (NDVI) stands at the forefront of precision farming and sustainable agriculture practices worldwide. NDVI satellite imagery has transformed how farmers, agribusinesses, and forest managers assess, analyze, and improve vegetation health by enabling efficient, ongoing monitoring. This game-changing technology empowers data-driven decisions, ultimately resulting in optimized resource management, higher crop yields, and reduced environmental impact.
NDVI is a metric that quantifies the density, health, and vitality of green vegetation using satellite imagery. It compares a plant canopy’s reflectance in the red light spectrum and near-infrared (NIR). Healthy, dense plants reflect more NIR and absorb more red light for photosynthesis, creating a consistent and reliable measurement that can be visualized, tracked, and analyzed over time.
NDVI Formula: How NDVI is Calculated
The NDVI of any given area is determined using this formula:
NDVI = (NIR – Red) / (NIR + Red)
- NIR: Near-infrared reflectance
- Red: Red light reflectance
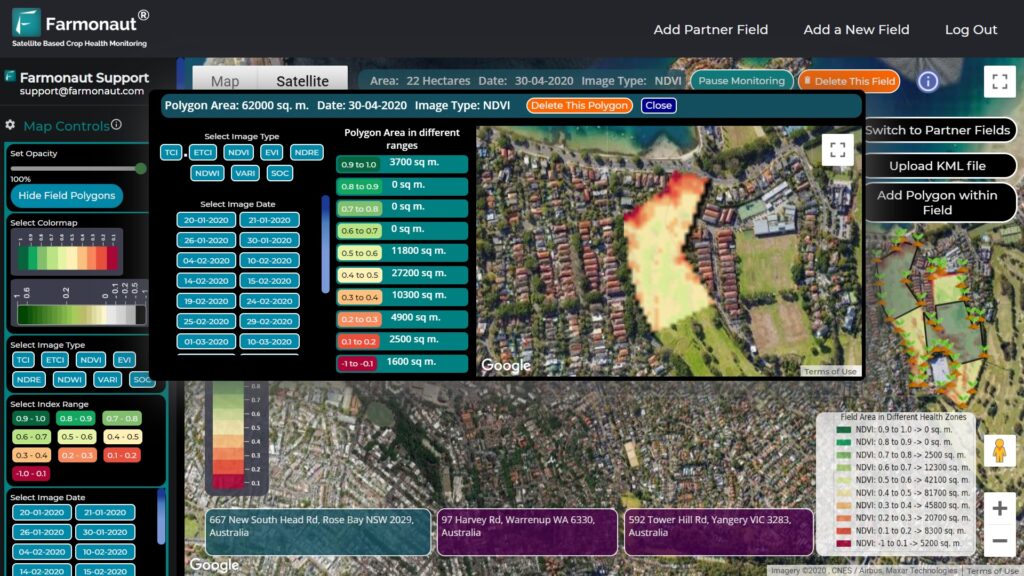
The resulting value will range from -1 (no vegetation) to +1 (very dense, healthy plant coverage). For instance:
- NDVI values between 0.66 and 1.0 indicate very healthy, dense vegetation.
- NDVI between 0.33 and 0.66 signifies moderately healthy vegetation.
- Values below 0.33 typically point to bare soil, stressed crops, or areas with little to no vegetation.
With these metrics, NDVI satellite imagery becomes a crucial indicator for monitoring, assessing, and managing the health of crops, forests, and rangelands.


NDVI: How it Works in Vegetation Health Monitoring
By analyzing satellite imagery, NDVI provides valuable insights about plant vitality for large or small fields. Each pixel’s value—indicating ‘greenness’ and vigor—enables early and continuous detection of stress factors such as water stress, nutrient deficiencies, and pest infestations.
- Satellite sensors capture both the red and NIR bands, allowing for detailed and scalable remote sensing in agriculture.
- Vegetation that is healthy and photosynthesizing reflects greater NIR, resulting in higher NDVI values.
- Stressed vegetation reflects more red and less NIR, causing lower or negative NDVI readings.
The power of NDVI lies in its ability to provide timely, actionable data across vast areas, eliminating the need for labor-intensive field scouting. Modern digital tools, such as those provided by Farmonaut, make it possible to access NDVI readings and satellite-based insights via mobile or web apps from anywhere.
Explore Farmonaut’s Advanced Crop Monitoring & Yield Prediction
NDVI in Precision Farming: Applications & Advantages
NDVI satellite imagery is revolutionizing precision farming by providing real-time information that helps farmers, agricultural businesses, and forest managers optimize every input and make informed, data-driven decisions. Here, we detail seven powerful ways NDVI enhances crop management, increases yields, and promotes sustainable practices.

1. Monitoring Crop Health: Early Stress Detection
Continuous monitoring of crop health is the most widespread application of NDVI satellite imagery. By tracking NDVI values across the growing season, we can identify plant stress factors (drought, nutrient deficiencies, pest infestations) long before they manifest to the naked eye.
- Early detection enables timely interventions—whether increasing irrigation, adding nutrients, or applying pesticide—minimizing yield losses and saving costs.
- NDVI aids in detecting plant vitality drops from environmental factors in its earliest stages.
- Monitoring NDVI time series allows for trend analysis in crop performance and rapid response to anomalies.
By integrating NDVI-based vegetation health monitoring into farm routines, growers can proactively address resource management needs and optimize their productivity.
How to Interpret Satellite Data for Agriculture | Tutorial | Farmonaut Mobile Apps
2. Precision Farming & Variable Rate Applications
Precision farming is about applying the right input, in the right quantity, at the right place and time. NDVI satellite imagery is central to this, providing data for guiding variable-rate applications of water, fertilizers, and pesticides. Rather than blanket coverage, resources are allocated where they are most needed:
- Low NDVI values highlight underperforming zones—areas where crops are stressed or lacking in nutrients.
- By applying additional inputs only to deficient zones, we reduce waste, lower costs, and minimize environmental impact.
- Resource optimization ensures improved yields and sustainability.
This approach facilitates targeted interventions, minimizing input use and promoting sustainable agriculture practices.
Farmonaut’s multispectral NDVI satellite monitoring enables users to verify input efficacy, track input application results, and plan future interventions — conveniently accessible on both web and app platforms.
For large-scale operational oversight and targeted management, discover Farmonaut’s Large Scale Farm Management Platform. It provides a unified dashboard for remotely monitoring multiple farms, plantations, or forest tracts via NDVI satellite data.
3. Crop Yield Prediction: Turning NDVI Data into Market Advantage
Crop yield prediction is vital for harvest planning, logistics, and market supply. Because higher NDVI values closely correlate with increased yields, NDVI satellite imagery is a powerful predictive tool:
- Farmers can estimate potential yield weeks or months before harvest.
- Early estimates enable smarter decisions regarding labor allocation, storage, harvest schedules, and negotiations with buyers or processors.
- Advance yield data supports financial planning and reduces post-harvest surprises.
Using multi-year NDVI data, crop managers can refine models and improve the accuracy of yield forecasts, translating this predictive capability into better risk management and profits.
Farmonaut’s Web App Tutorial: Comprehensive Guide for Interpreting Satellite Data
4. Pest Hotspot Identification Using NDVI
Pest infestations often reveal themselves as localized drops in NDVI values. By comparing NDVI maps over time, we can spot hotspots—clusters with sharply declining plant health—often before there are visible signs.
- Timely pest mapping allows for targeted pesticide application, not blanket sprays, reducing input use and minimizing ecosystem impact.
- Integrating pest risk maps with NDVI data streamlines field scouting and enables precision interventions.
- Alerts for rapid response: satellite-driven NDVI shifts can trigger early warnings, reducing crop losses and pesticide expenses.
For sustained vegetation health monitoring, NDVI-driven pest detection has become a key tool in the integrated pest management toolbox.
5. Precision Irrigation Management
Water is precious. NDVI satellite imagery improves irrigation management by identifying areas with low NDVI values due to water stress. This supports:
- Variable-rate irrigation: Apply water only where actual moisture deficits are detected, boosting crop productivity while reducing water waste.
- Supporting sustainable agriculture practices especially in drought-prone areas.
- Integration with soil moisture maps for even finer resolution (available via Farmonaut’s platform).
Farmers can track irrigation effectiveness and validate water-saving strategies season after season—a critical step in responsible agriculture.
Farmonaut Web app | Satellite Based Crop monitoring
6. Nutrient Deficiency & Stress Identification
Deficient or stressed crops (from nutrients, salinity, soil compaction) reveal their decline long before visual symptoms via reduced NDVI values.
- Early nutrition stress detection enables rapid response: apply missing fertilizers precisely where needed.
- Helps prevent blanket over-fertilization and resulting environmental impact.
- Useful for tracking remediation efforts and verifying input efficiency.
- Combined with soil analysis, NDVI pinpoints how much of the problem is nutritional versus water/pest related.
Precision in nutrient management is a major lever for boosting yields while maintaining sustainability.
7. Forest Management with NDVI
Forestry applications extend beyond agriculture to the world’s woodlands:
- NDVI reveals large-scale forest health, ecosystem change, and patterns of deforestation.
- Forest managers can monitor regrowth in reforestation projects, detect disease outbreaks, and evaluate the effects of climate or human impact.
- Year-to-year NDVI trends support sustainable management, resource accounting, and conservation efforts.
- Farmonaut’s tools support forest management with NDVI for both government and private users seeking to balance ecology and resource utilization.
To learn more about Farmonaut’s advanced crop, plantation, and forestry advisory modules via remote sensing, access our Crop & Plantation/Fleet Forestry Advisory Services page.
Comparative Benefits of 7 NDVI Satellite Imagery Techniques
| Application | Estimated Yield Improvement (%) | Vegetation Health Monitoring Capability | Required Satellite Frequency | Typical Use Case Example |
|---|---|---|---|---|
| Early Stress Detection (Monitoring Crop Health) | 10–25% | High | Weekly | Monitoring wheat for drought-stress before visual wilting |
| Precision Variable Rate Application | 15–23% | High | Weekly | Targeting fertilizer to underperforming corn zones |
| Crop Yield Prediction | 5–17% | Medium | Monthly | Estimating rice harvests months in advance |
| Pest Hotspot Identification | 10–20% | High | Weekly | Locating cotton bollworm outbreaks pre-symptomatically |
| Precision Irrigation Management | 8–15% | Medium | Weekly | Identifying water stress in orchards post-heatwave |
| Nutrient Deficiency Detection | 8–18% | High | Weekly | Pinpointing nitrogen deficiency in soybean fields |
| Forest Management with NDVI | 3–10% | Medium | Monthly | Detecting sudden declines or improvements in forest canopy health |
Limitations of NDVI Satellite Imagery
While NDVI is essential for remote sensing in agriculture and forestry, understanding its limitations is vital for accurate decision-making:
- Saturation in Dense Vegetation: In areas with very dense plant canopies, NDVI values hit a ceiling (saturation). Subtle declines in crop health can go undetected because NDVI no longer increases linearly with vegetation density.
- Soil Background Effects & Influence: In sparse crops or early growth, exposed soil’s reflectance can skew NDVI results. This leads to under- or overestimation of true plant vitality.
- Atmospheric Conditions & Interference: Clouds, haze, and aerosols in the atmosphere can introduce noise or disturbance into NDVI data, complicating year-on-year or month-on-month comparisons.
Nevertheless, when interpreted properly—and especially when combined with other indices and agronomic data—NDVI remains the backbone of vegetation health monitoring in modern agriculture.
Advancements & Alternatives: Enhanced Vegetation Index (EVI) & Soil-Adjusted Vegetation Index (SAVI)
Continuous innovation in remote sensing in agriculture has led to new indices addressing some NDVI shortcomings:
- Enhanced Vegetation Index (EVI) – EVI provides more accurate readings under dense vegetation and accounts for atmospheric conditions and soil background effects. This makes it ideal for forests and crops with thick canopies.
- Soil-Adjusted Vegetation Index (SAVI) – SAVI modifies NDVI to minimize soil influence, especially valuable in early crop growth or sparse plant areas.
Combining NDVI with indices like EVI and SAVI enables more robust, comprehensive assessing of plant health and resource needs.
Farmonaut offers advanced satellite-based analytics, delivering NDVI alongside EVI, SAVI, and additional indices for more nuanced farm or forestry management.
Learn how developers and agribusinesses can leverage Farmonaut’s Satellite and Weather API for scalable, automated NDVI and advanced index monitoring across thousands of fields, or visit the API Developer Documentation for technical integration.
How Farmonaut Empowers NDVI-Based Agriculture & Sustainable Resource Management
We at Farmonaut are dedicated to democratizing precision agriculture by making NDVI satellite imagery accessible and affordable to farmers, agribusinesses, and forest managers worldwide. Our platform blends satellite imagery, advanced AI, blockchain, and machine learning to revolutionize traditional farming and forestry practices.
Key Features of Farmonaut’s Platform:
- Real-time NDVI-based Crop Health Monitoring: Access field-level health status, stress detection, and intervention recommendations from any device via our web, Android, or iOS apps.
- Jeevn AI Advisory System: Personalized, real-time satellite advisories & weather forecasts for improved crop management—empowering farmers to make informed decisions.
- Blockchain Traceability: Full transparency for your agricultural supply chain journeys. Verify every step from field to consumer and build customer trust. (Read more about traceability)
- Fleet and Resource Management: Optimize vehicle, personnel, and input allocation across multiple fields or plantations with robust satellite-powered oversight. (See how fleet management works.)
- Carbon Footprinting: Track your farm or corporate operations’ environmental footprint in real-time and adopt compliance-driven sustainable agriculture practices. (Discover carbon tracking solutions.)
-
Crop Loan and Insurance Verification: Banks and insurers can remotely verify claims and acreage with satellite NDVI for risk reduction and streamlined processing.
(More on satellite crop loan & insurance support.)
Farmonaut offers flexible subscriptions for individual farmers, farms of all scales, cooperatives, government institutions, and corporate clients. Our scalable solutions adapt to your operational needs, from a small vegetable plot to thousands of forest hectares.
FAQ: NDVI Satellite Imagery, Crop Monitoring & Resource Management
What is NDVI, and how does it help agriculture?
NDVI (Normalized Difference Vegetation Index) is a satellite-derived metric that measures the density, health, and vitality of plant vegetation by comparing red and near-infrared reflectance. It allows for efficient, large-scale crop health monitoring, detection of stress factors, precision input management, and sustainable farming practice implementation.
How often should farmers use NDVI satellite imagery?
For best results in precision agriculture, NDVI satellite imagery should be analyzed on a weekly basis during the growing season. This frequency enables early identification of stress, water deficiencies, or pest outbreaks, maximizing intervention efficiency.
Can NDVI differentiate between types of plant stress?
NDVI indicates general plant stress but cannot distinguish the specific cause (drought, nutrient deficiency, pest attack, etc.) on its own. However, when combined with other farm data (soil tests, climate readings, ground scouting) or indices like EVI/SAVI, the source of stress can be narrowed down significantly.
Does NDVI work during all seasons and crop stages?
NDVI is most accurate during stages with high leaf area (mid to late growth). Early crop stages, where soil background influence is strong, may yield less reliable data unless adjusted (e.g., using SAVI). Data is also best when cloud cover is minimal for clear satellite views.
What are alternatives to NDVI for vegetation health monitoring?
Alternatives include the Enhanced Vegetation Index (EVI), which is more effective in dense canopies and considers atmospheric effects, and the Soil-Adjusted Vegetation Index (SAVI) for better results in sparse vegetation or bare soil areas.
How can organizations implement NDVI monitoring at scale?
Platforms such as Farmonaut provide robust satellite and weather APIs for programmatic NDVI and satellite data integration. This allows managers to automate crop, plantation, and forest monitoring across numerous geographies.
Is satellite NDVI data difficult to interpret?
Not anymore. Modern farm management tools, like those developed by Farmonaut, offer user-friendly NDVI maps, charts, and notifications directly on mobile apps and web platforms for all user types—no advanced GIS expertise is required.
Conclusion: The Future of Precision Farming with NDVI Satellite Imagery
NDVI satellite imagery has entered mainstream agriculture and forestry as the backbone of precision farming and vegetation health monitoring. By analyzing red and NIR reflectance, this index enables early stress detection, targeted input application, crop yield prediction, and sustainable resource management.
While limitations exist—most notably in dense or sparse vegetation and under challenging atmospheric conditions—the advent of alternative indices like EVI and SAVI, and the seamless integration of satellite data with digital platforms such as Farmonaut, mean that users now have stronger, more flexible tools for informed decision-making than ever before.
The rise of NDVI satellite imagery—along with remote sensing, big data, and AI—is accelerating the adoption of sustainable agriculture practices globally. Farmers and forest managers who embrace these technologies stand to enhance their yields, optimize costs, and contribute to a more resilient planet.
Ready to transform your fields, plantations, or forests? Try NDVI-powered crop and vegetation management now—directly on Android/iOS/web or via API with Farmonaut.