Revolutionizing Agriculture: Farmonaut’s Integration of EVI for Enhanced Crop Health Monitoring
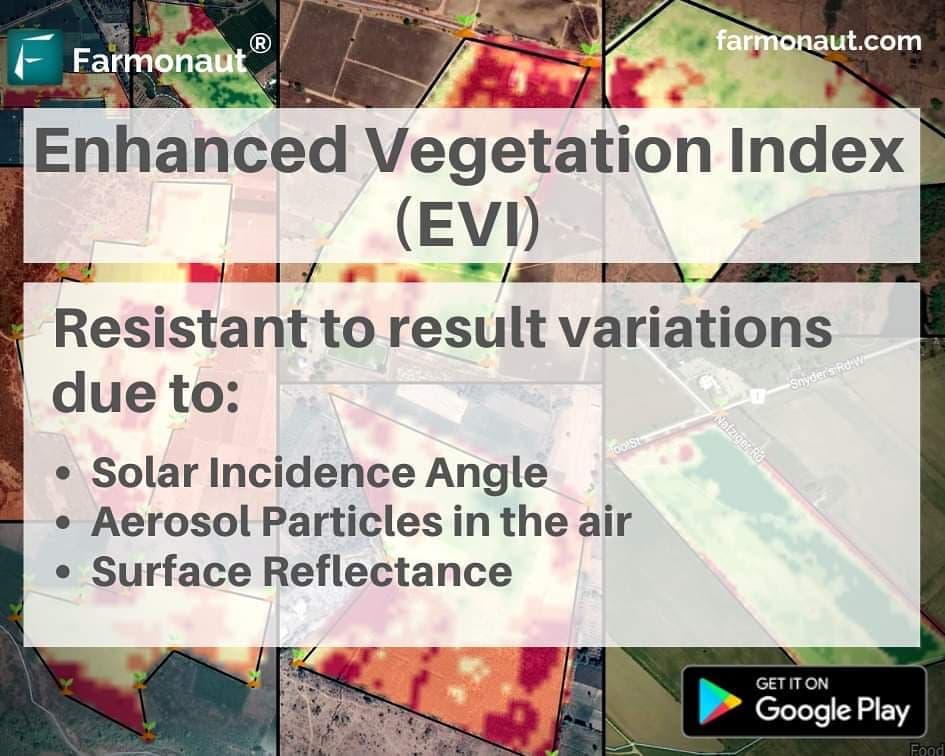
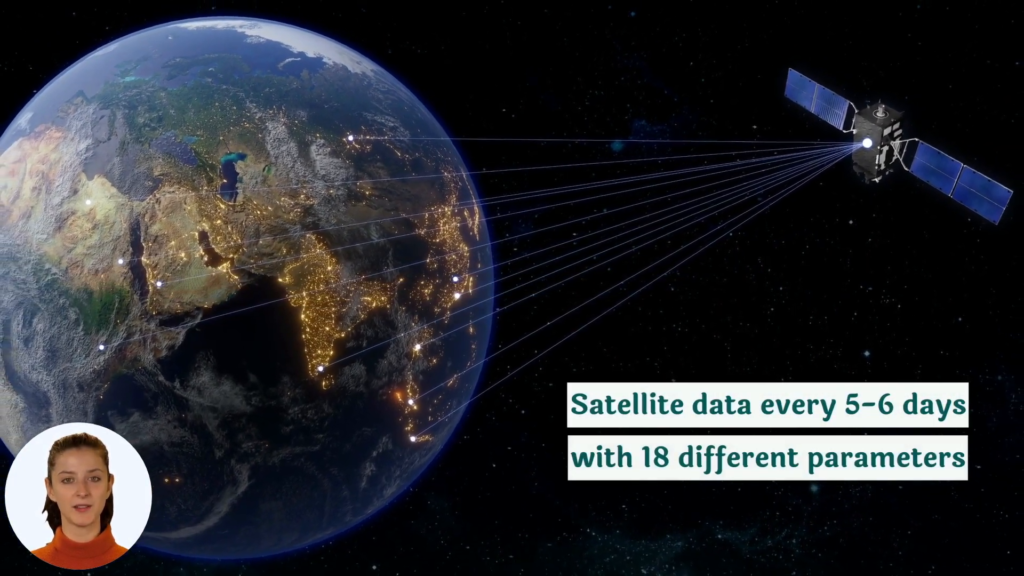
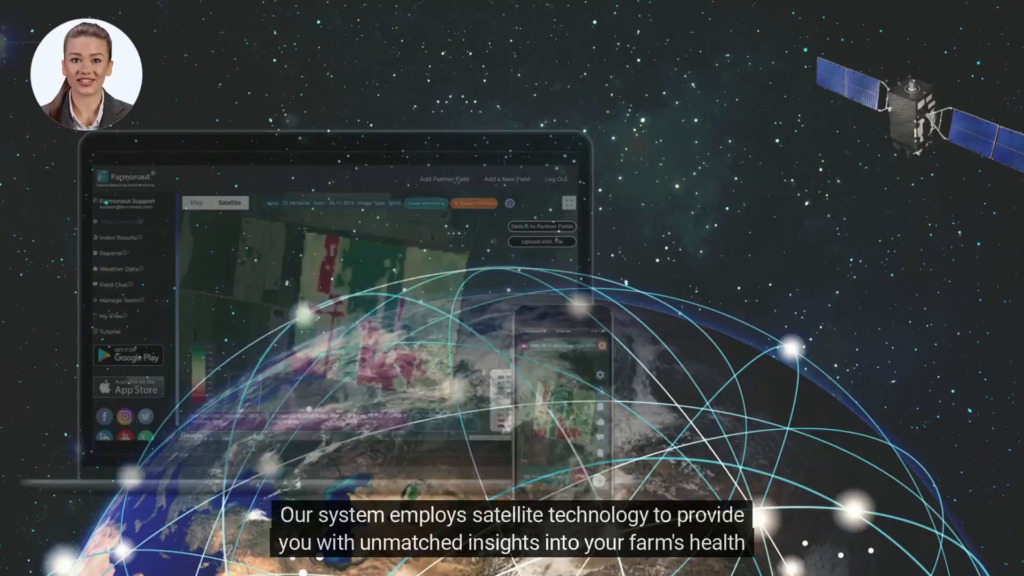
At Farmonaut, we’re constantly striving to improve our satellite-based crop health monitoring services for farmers worldwide. Our commitment to innovation has led us to integrate the Enhanced Vegetation Index (EVI) into our system, accessible through our Android app. This advancement marks a significant step forward in our mission to make precision agriculture more accurate and accessible.
Understanding Vegetation Indices: NDVI, NDWI, and EVI
Before we delve into the specifics of EVI and its benefits, let’s briefly review some key vegetation indices used in remote sensing for agriculture:
- NDVI (Normalized Difference Vegetation Index): A widely used index for assessing vegetation health and density.
- NDWI (Normalized Difference Water Index): Used to monitor changes in water content of leaves and soil moisture.
- EVI (Enhanced Vegetation Index): An optimized index designed to enhance the vegetation signal with improved sensitivity in high biomass regions.
- NDRE (Normalized Difference Red Edge): While not directly related to our current update, this index is useful for detecting changes in chlorophyll content.
The Limitations of NDVI and the Need for EVI
While NDVI has been a cornerstone in remote sensing applications for decades, it does have certain limitations:
- Saturation in densely vegetated areas
- Sensitivity to atmospheric conditions
- Influence from soil background in areas with sparse vegetation
These shortcomings can sometimes lead to inaccurate assessments of crop health, especially in regions with high biomass or challenging atmospheric conditions.
Introducing EVI: A More Robust Solution
The Enhanced Vegetation Index (EVI) addresses these limitations by incorporating additional wavelengths of light and correction factors. Here’s how EVI improves upon NDVI:
- Atmospheric Correction: EVI includes a blue band to correct for atmospheric aerosol scattering.
- Soil Adjustment: It minimizes soil background influences, making it more accurate in areas with sparse vegetation.
- Improved Sensitivity: EVI remains sensitive in high biomass regions where NDVI often saturates.
- Canopy Background Adjustment: It reduces variations caused by canopy background signals.
The EVI Formula
The EVI is calculated using the following formula:
EVI = G * ((NIR – Red) / (NIR + C1 * Red – C2 * Blue + L))
Where:
- NIR = Near-Infrared reflectance
- Red = Red reflectance
- Blue = Blue reflectance
- G = Gain factor (typically 2.5)
- C1 and C2 = Coefficients of the aerosol resistance term (6 and 7.5 respectively)
- L = Canopy background adjustment (typically 1)
Benefits of EVI in Agricultural Remote Sensing
The integration of EVI into our Farmonaut system brings several advantages to our users:
- Improved Accuracy: EVI provides more accurate vegetation health assessments, especially in areas with dense vegetation or challenging atmospheric conditions.
- Better Stress Detection: It can more effectively detect early signs of crop stress, allowing for timely interventions.
- Enhanced Biomass Estimation: EVI’s improved sensitivity in high biomass areas leads to better crop yield predictions.
- Reduced Atmospheric Interference: The index’s built-in atmospheric correction results in more consistent readings across different atmospheric conditions.
- Improved Temporal Monitoring: EVI allows for more accurate tracking of crop growth and health over time.
Farmonaut’s Implementation of EVI
At Farmonaut, we’ve seamlessly integrated EVI into our existing satellite-based crop monitoring system. Here’s how our users can benefit:
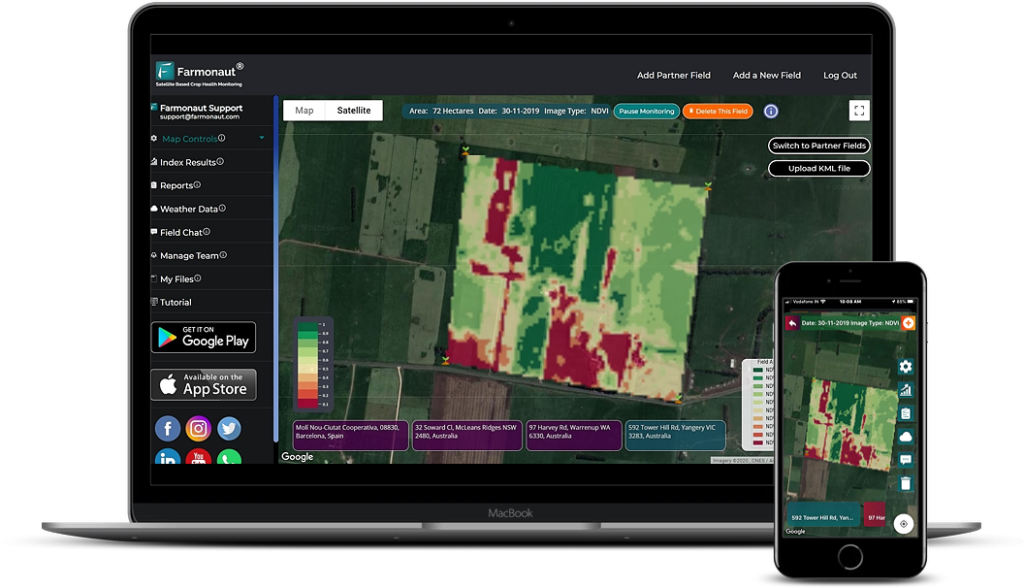
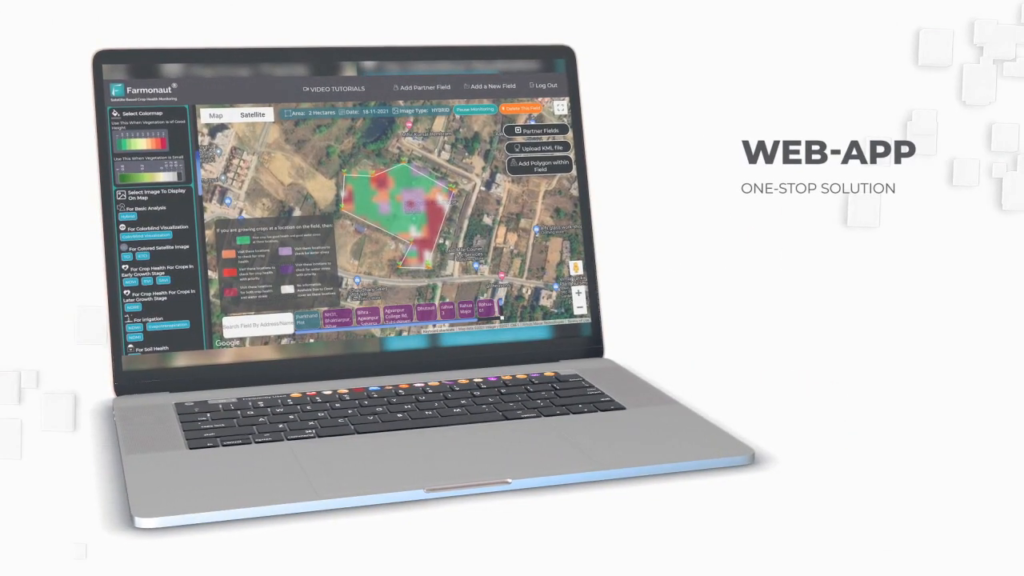
- Easy Access: EVI results are now available through our Android app, alongside our existing NDVI and NDWI data.
- Comprehensive Analysis: Users can compare EVI with other indices for a more complete understanding of their crop health.
- Historical Data: We’re retroactively applying EVI to historical satellite data, allowing for long-term trend analysis.
- Custom Alerts: Users can set up custom alerts based on EVI thresholds, ensuring they’re notified of significant changes in crop health.
- API Access: For our developer community, EVI data is available through our Satellite API.
How Farmonaut’s Satellite System Compares to Drone and IoT-based Monitoring
| Feature | Farmonaut Satellite System | Drone-based Monitoring | IoT-based Monitoring |
|---|---|---|---|
| Coverage Area | Large (Global) | Limited (Local) | Limited (Point-based) |
| Frequency of Data Collection | Regular (Every few days) | On-demand | Continuous |
| Initial Setup Cost | Low | High | Medium |
| Operational Complexity | Low | High | Medium |
| Data Processing Time | Fast | Medium | Real-time |
| Weather Dependency | Low | High | Low |
| Scalability | High | Low | Medium |
The Future of Crop Monitoring with Farmonaut
The integration of EVI is just the beginning of our ongoing efforts to enhance our crop monitoring capabilities. We’re continuously exploring new technologies and methodologies to provide our users with the most accurate and actionable data possible. Some areas we’re focusing on include:
- Machine Learning Models: Developing advanced AI models that can predict crop yields and detect diseases using multi-spectral satellite data.
- Integration with Ground Sensors: Combining satellite data with IoT sensor data for even more precise monitoring.
- Crop-Specific Indices: Researching and implementing vegetation indices tailored to specific crop types.
- Climate Change Adaptation: Providing tools to help farmers adapt to changing climate patterns using long-term satellite data analysis.
How to Access EVI Results on Farmonaut
To start benefiting from our new EVI integration, follow these simple steps:
- Download the Farmonaut app from the Google Play Store or Apple App Store.
- Log in to your account or sign up if you’re a new user.
- Select your field for satellite monitoring.
- Navigate to the “Vegetation Indices” section.
- You’ll now see EVI results alongside NDVI and other indices.
For developers interested in integrating EVI data into their own applications, check out our API documentation.
The Broader Impact of EVI in Agriculture
The adoption of EVI in agricultural remote sensing has implications beyond individual farm management:
- Food Security: More accurate crop health monitoring and yield predictions can help governments and organizations better prepare for potential food shortages.
- Climate Change Research: EVI data can contribute to studies on the impact of climate change on vegetation patterns and agricultural productivity.
- Sustainable Agriculture: By enabling more efficient resource use, EVI contributes to more sustainable farming practices.
- Agricultural Insurance: More accurate crop health assessments can lead to fairer and more precise agricultural insurance policies.
Frequently Asked Questions (FAQ)
- Q: What is the difference between NDVI and EVI?
A: While both are vegetation indices, EVI is designed to be more sensitive in high biomass areas and less influenced by atmospheric conditions and soil background compared to NDVI. - Q: Do I need special equipment to use EVI with Farmonaut?
A: No, you only need our mobile app and an internet connection. We process satellite data to provide EVI results. - Q: How often is EVI data updated?
A: EVI data is updated with each new satellite pass, typically every 3-5 days, depending on your location. - Q: Can EVI replace ground-based observations?
A: While EVI provides valuable insights, it’s best used in conjunction with ground-based observations for comprehensive farm management. - Q: Is EVI suitable for all crop types?
A: EVI is generally applicable to most crop types, but its effectiveness may vary. We’re continuously refining our algorithms for different crops. - Q: How does Farmonaut ensure the accuracy of its EVI data?
A: We use high-resolution satellite imagery and advanced processing algorithms, validated against ground-truth data from various regions. - Q: Can I use EVI data for precision agriculture practices?
A: Absolutely! EVI data can inform precision agriculture practices such as variable rate fertilization and targeted irrigation. - Q: Is historical EVI data available?
A: Yes, we provide historical EVI data for subscribed fields, allowing for long-term trend analysis. - Q: How does EVI handle cloud cover?
A: While EVI is less affected by atmospheric conditions than NDVI, significant cloud cover can still interfere with readings. We use advanced cloud detection and removal techniques to minimize this issue. - Q: Can EVI help in detecting crop diseases?
A: While EVI itself doesn’t directly detect diseases, changes in EVI values can indicate plant stress, which may be caused by diseases. This can prompt farmers to investigate further.
Conclusion: Empowering Farmers with Advanced Technology
At Farmonaut, we’re committed to bringing the latest advancements in remote sensing and agricultural technology to farmers worldwide. The integration of EVI into our platform represents a significant step forward in our mission to make precision agriculture more accessible and effective.
By providing more accurate and reliable crop health assessments, we’re empowering farmers to make better-informed decisions, optimize resource use, and ultimately increase their yields while promoting sustainable farming practices.
We invite you to experience the benefits of EVI and our other advanced features by trying Farmonaut today. Visit our website or download our app to get started on your journey towards smarter, more efficient farming.


